RUM Dashboard
The RUM Dashboard provides an at-a-glance view of your application's real user experience metrics.
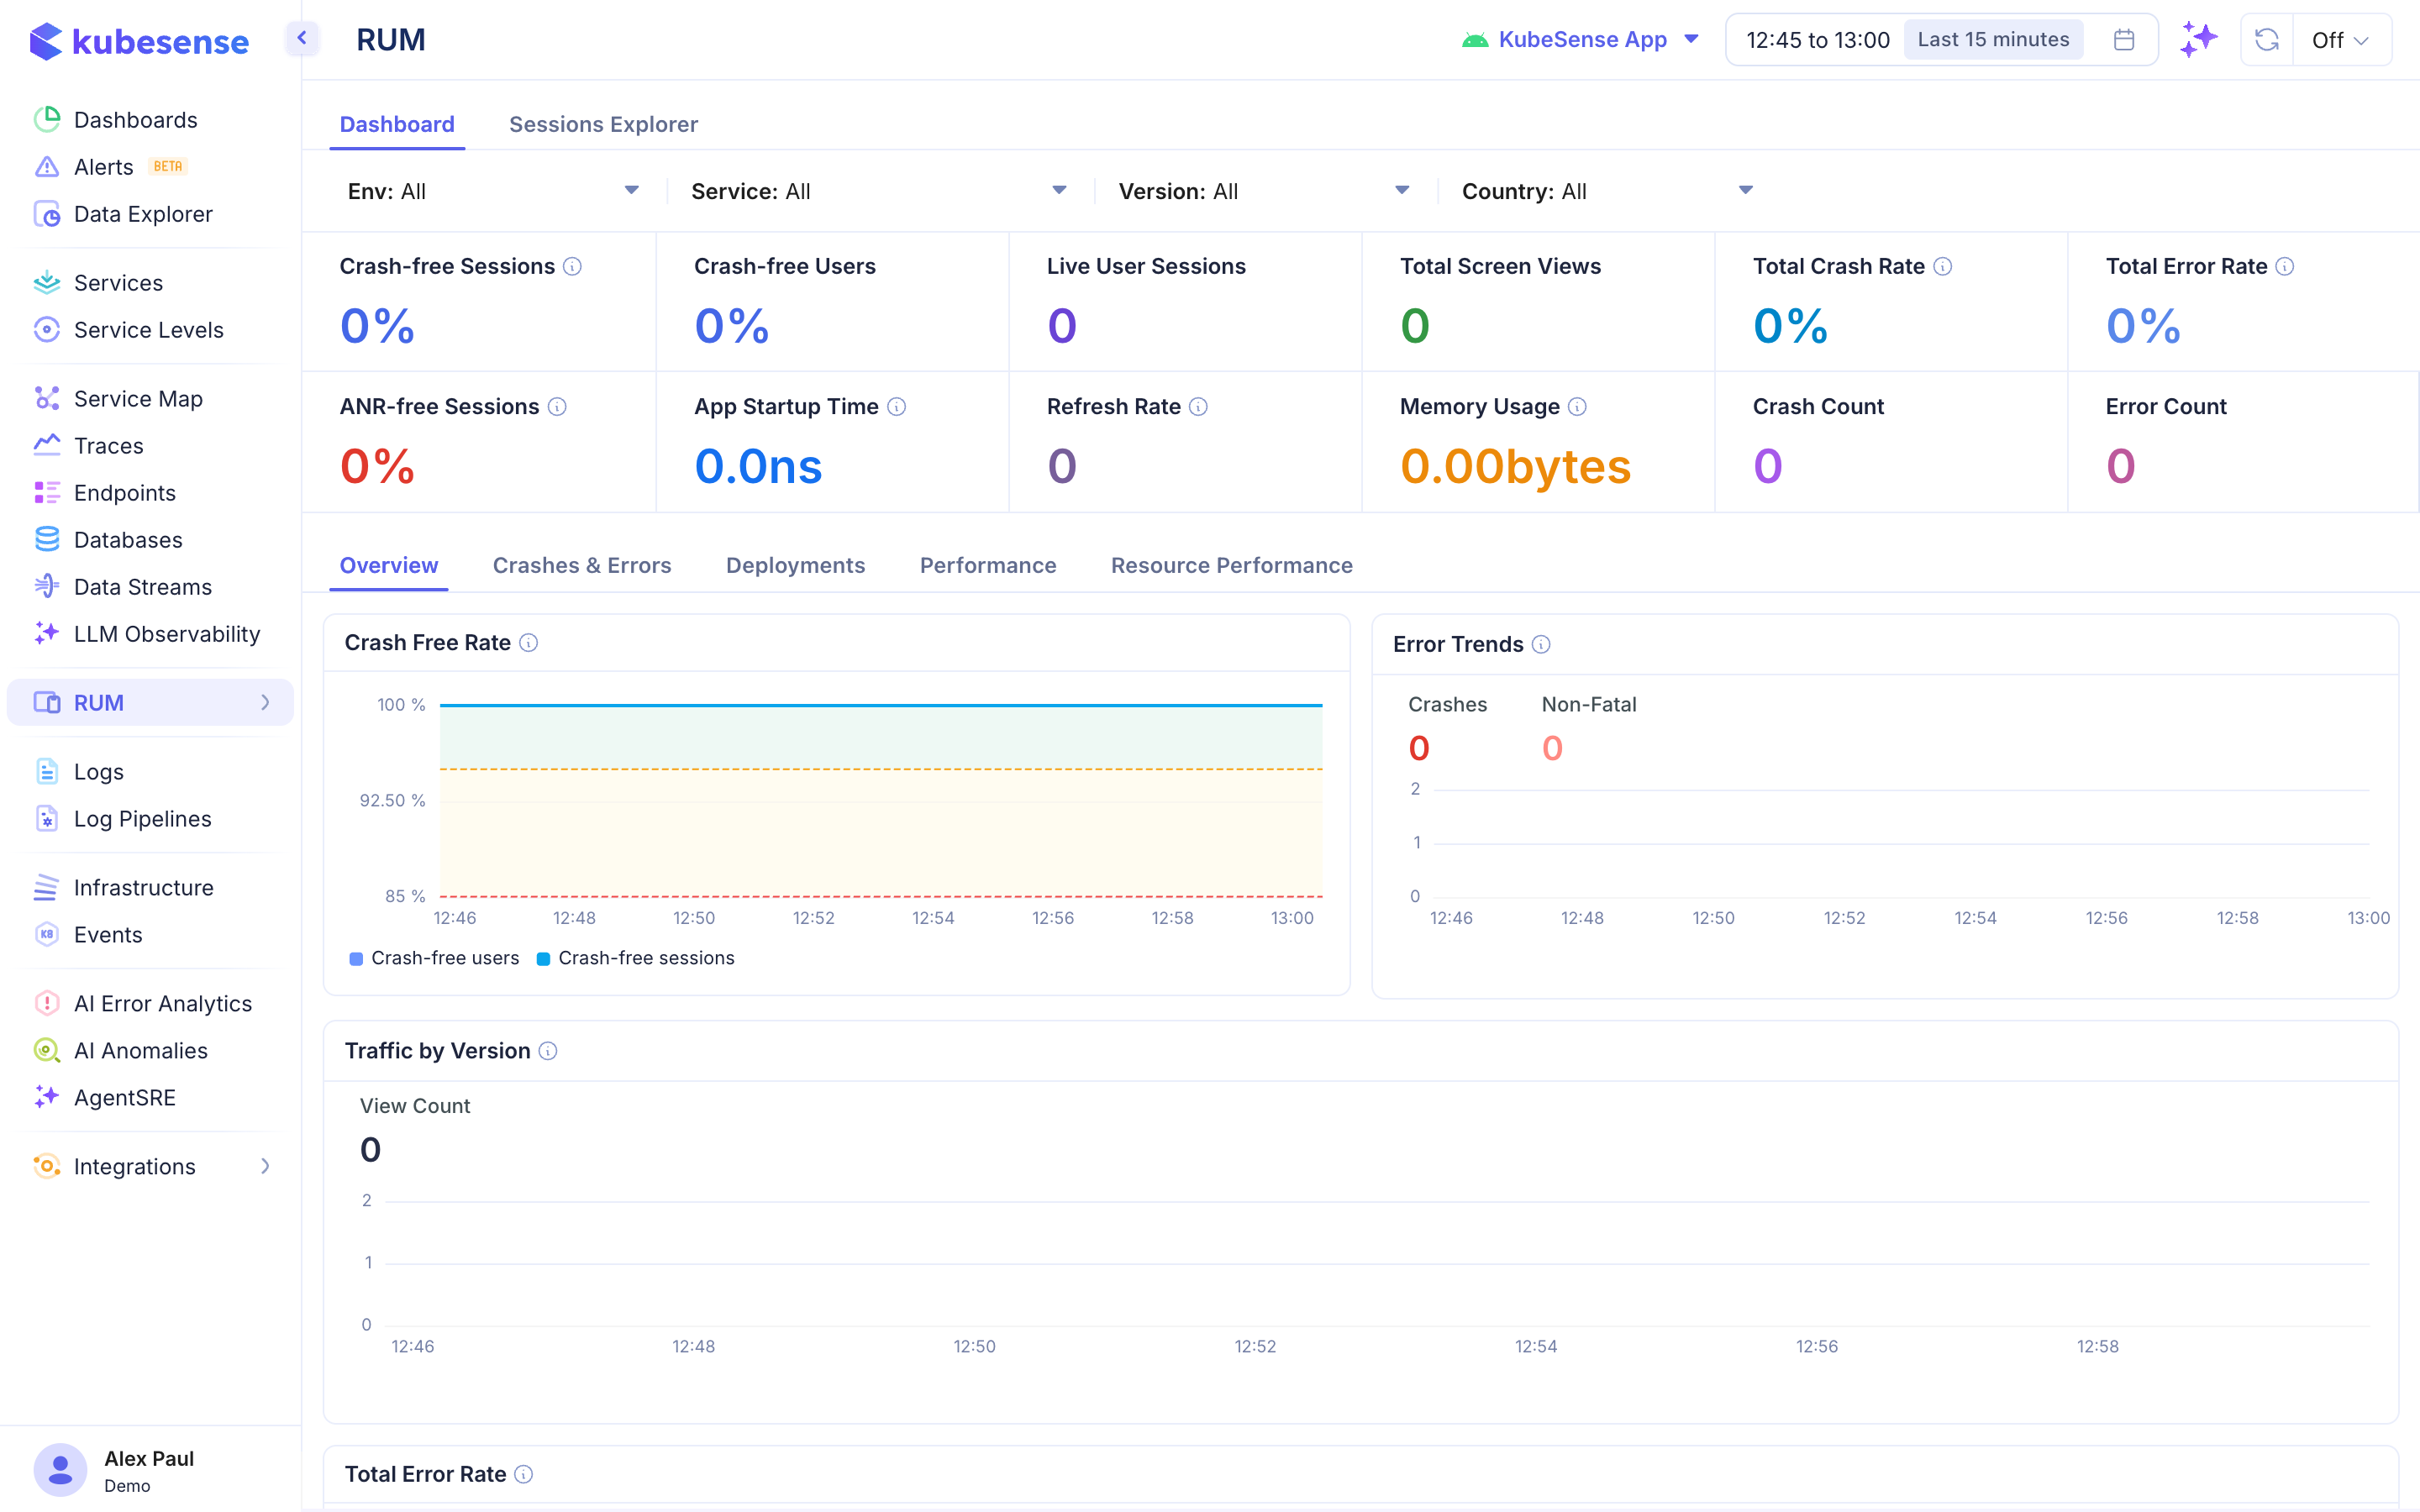
Overview
The dashboard is divided into top-level KPIs, sub-tabs for detailed analysis, and trend charts.
Global Filters
At the top of the page, filter data by:
- App — Select your application (e.g., "KubeSense App")
- Env — Environment (e.g., production, staging)
- Service — Specific service within the app
- Version — App version
- Country — Geographic filter
- Time range — Standard time picker
Key Metrics
| Metric | Description |
|---|---|
| Crash-free Sessions | Percentage of sessions without a crash |
| Crash-free Users | Percentage of users who did not experience a crash |
| Live User Sessions | Number of currently active sessions |
| Total Screen Views | Total screen/page views in the time window |
| Total Crash Rate | Percentage of sessions that ended in a crash |
| Total Error Rate | Percentage of sessions that encountered an error |
| ANR-free Sessions | Sessions without Application Not Responding events (Android) |
| App Startup Time | Average cold-start time for the application |
| Refresh Rate | Average frame refresh rate |
| Memory Usage | Average memory consumption |
| Crash Count | Absolute number of crashes |
| Error Count | Absolute number of errors |
Dashboard Tabs
- Overview — High-level KPIs, crash-free rate trends, error trends, traffic by version
- Crashes & Errors — Detailed crash and error breakdown with stack traces
- Deployments — Performance metrics by app version/deployment
- Performance — Loading times, frame rates, and responsiveness metrics
- Resource Performance — Network request performance from the client side
Trend Charts
- Crash Free Rate — Time-series showing crash-free user and session percentages
- Error Trends — Crashes vs. non-fatal errors over time
- Traffic by Version — View count broken down by app version
- Total Error Rate — Error rate trend over the selected time window