
Service Levels
Service Levels is an upcoming feature. The functionality described below reflects the planned capabilities.
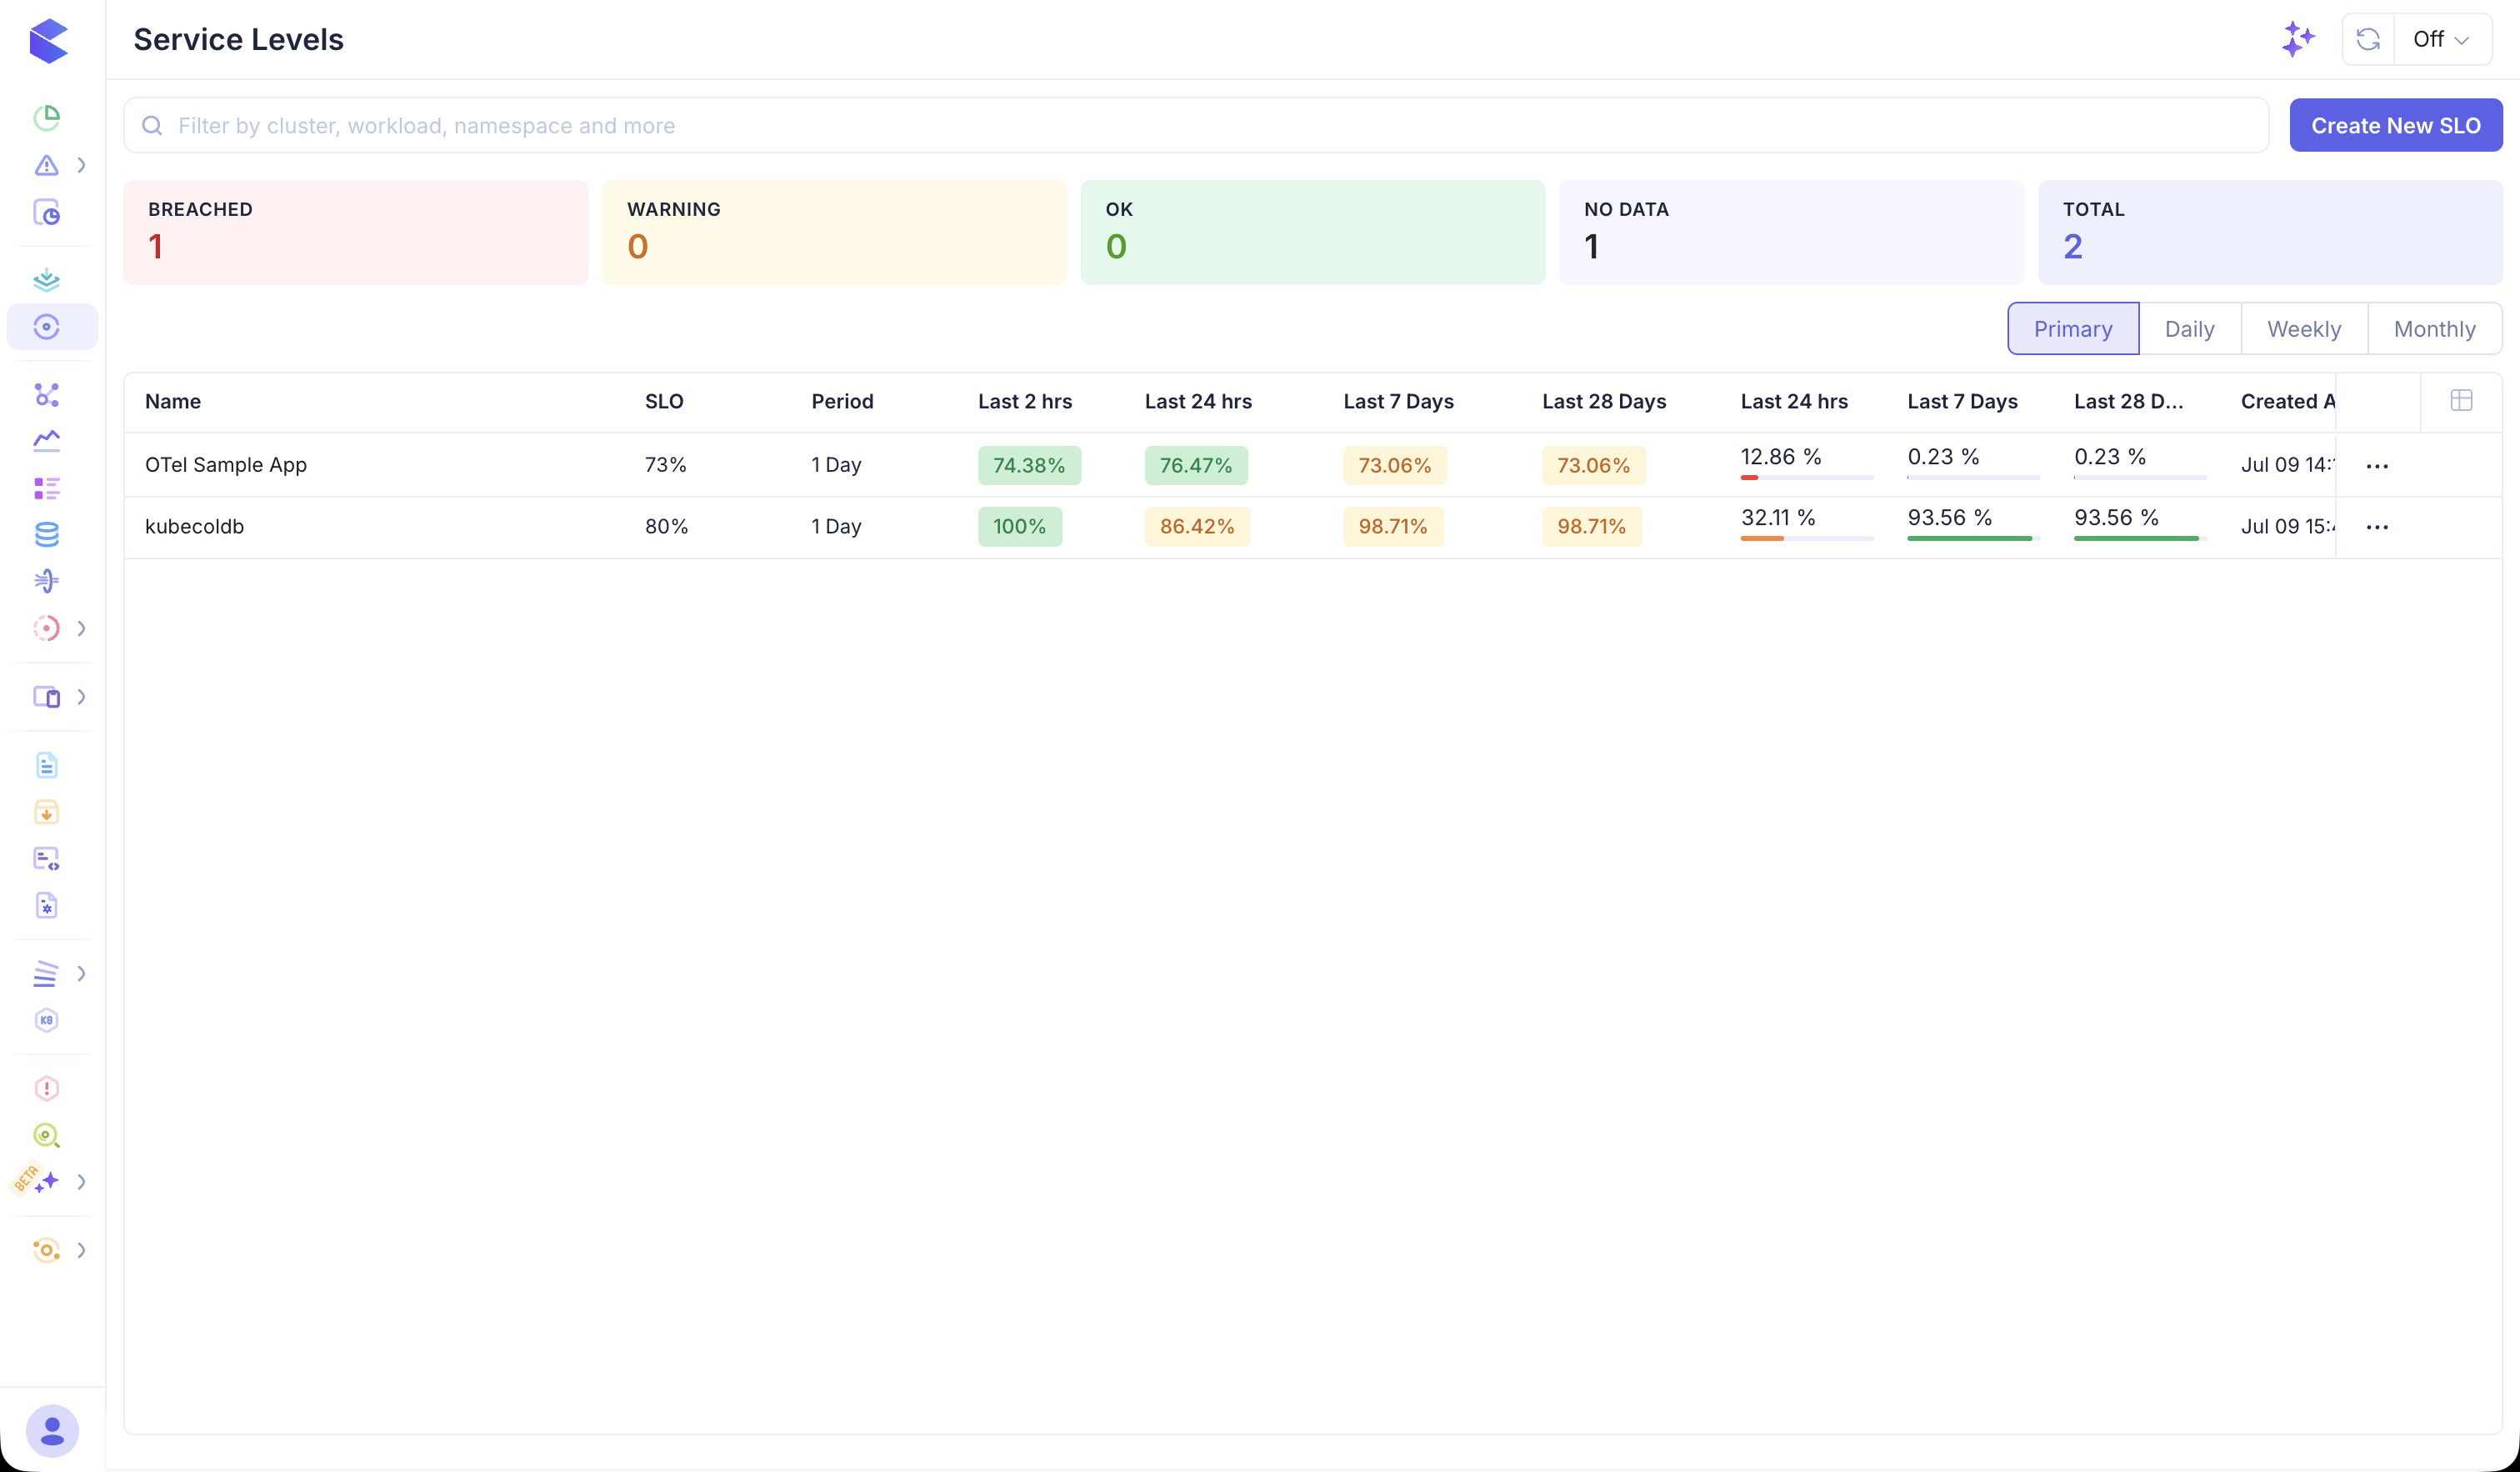
Service Levels allows you to define, track, and monitor Service Level Objectives (SLOs) for your applications and infrastructure, ensuring you meet reliability targets.
SLO Table Time Grain
The SLO table time grain is stored in the URL. Use the Primary, Daily, Weekly, and Monthly tabs above the table to switch views:
| View | Description |
|---|---|
| Primary | Summary metrics for fixed windows (e.g. last 2 hrs / 24 hrs / 7 days / 28 days). No date timeline. |
| Daily | Timeline columns at a day grain, with arrows to scroll the date window. |
| Weekly | Timeline columns at a week grain, with arrows to scroll the date window. |
| Monthly | Timeline columns at a month grain, with arrows to scroll the date window. |
Overview
Service Level management is a core practice for SRE teams. KubeSense Service Levels helps you:
- Define SLOs — Set reliability targets for your services (e.g., 99.9% availability, P95 latency < 200ms)
- Track error budgets — Monitor how much of your error budget has been consumed
- Burn rate alerts — Get notified when your error budget is being consumed too quickly
- Historical SLO reporting — Review SLO compliance over time
Key Concepts
Service Level Indicator (SLI)
A quantitative measure of a service's behavior. Common SLIs include:
- Availability — Proportion of successful requests
- Latency — Proportion of requests faster than a threshold
- Throughput — Request rate staying within expected bounds
- Error rate — Proportion of requests that result in errors
Service Level Objective (SLO)
A target value for an SLI over a time window. For example:
- "99.9% of requests succeed over a 30-day rolling window"
- "95% of requests complete in under 200ms over a 7-day window"
Error Budget
The allowed amount of unreliability, derived from the SLO. For a 99.9% availability SLO:
- Error budget = 0.1% of total requests
- Over 30 days, that's approximately 43.2 minutes of downtime
Planned Capabilities
SLO Configuration
Define SLOs using:
- Count-based SLOs — Good events / total events (e.g., successful requests / total requests)
- Time-based SLOs — Good time slices / total time slices (e.g., minutes where latency < threshold)
Error Budget Tracking
- Remaining budget — Percentage of error budget remaining
- Burn rate — Rate at which error budget is being consumed
- Budget forecast — Projected budget exhaustion date based on current burn rate
SLO Dashboard
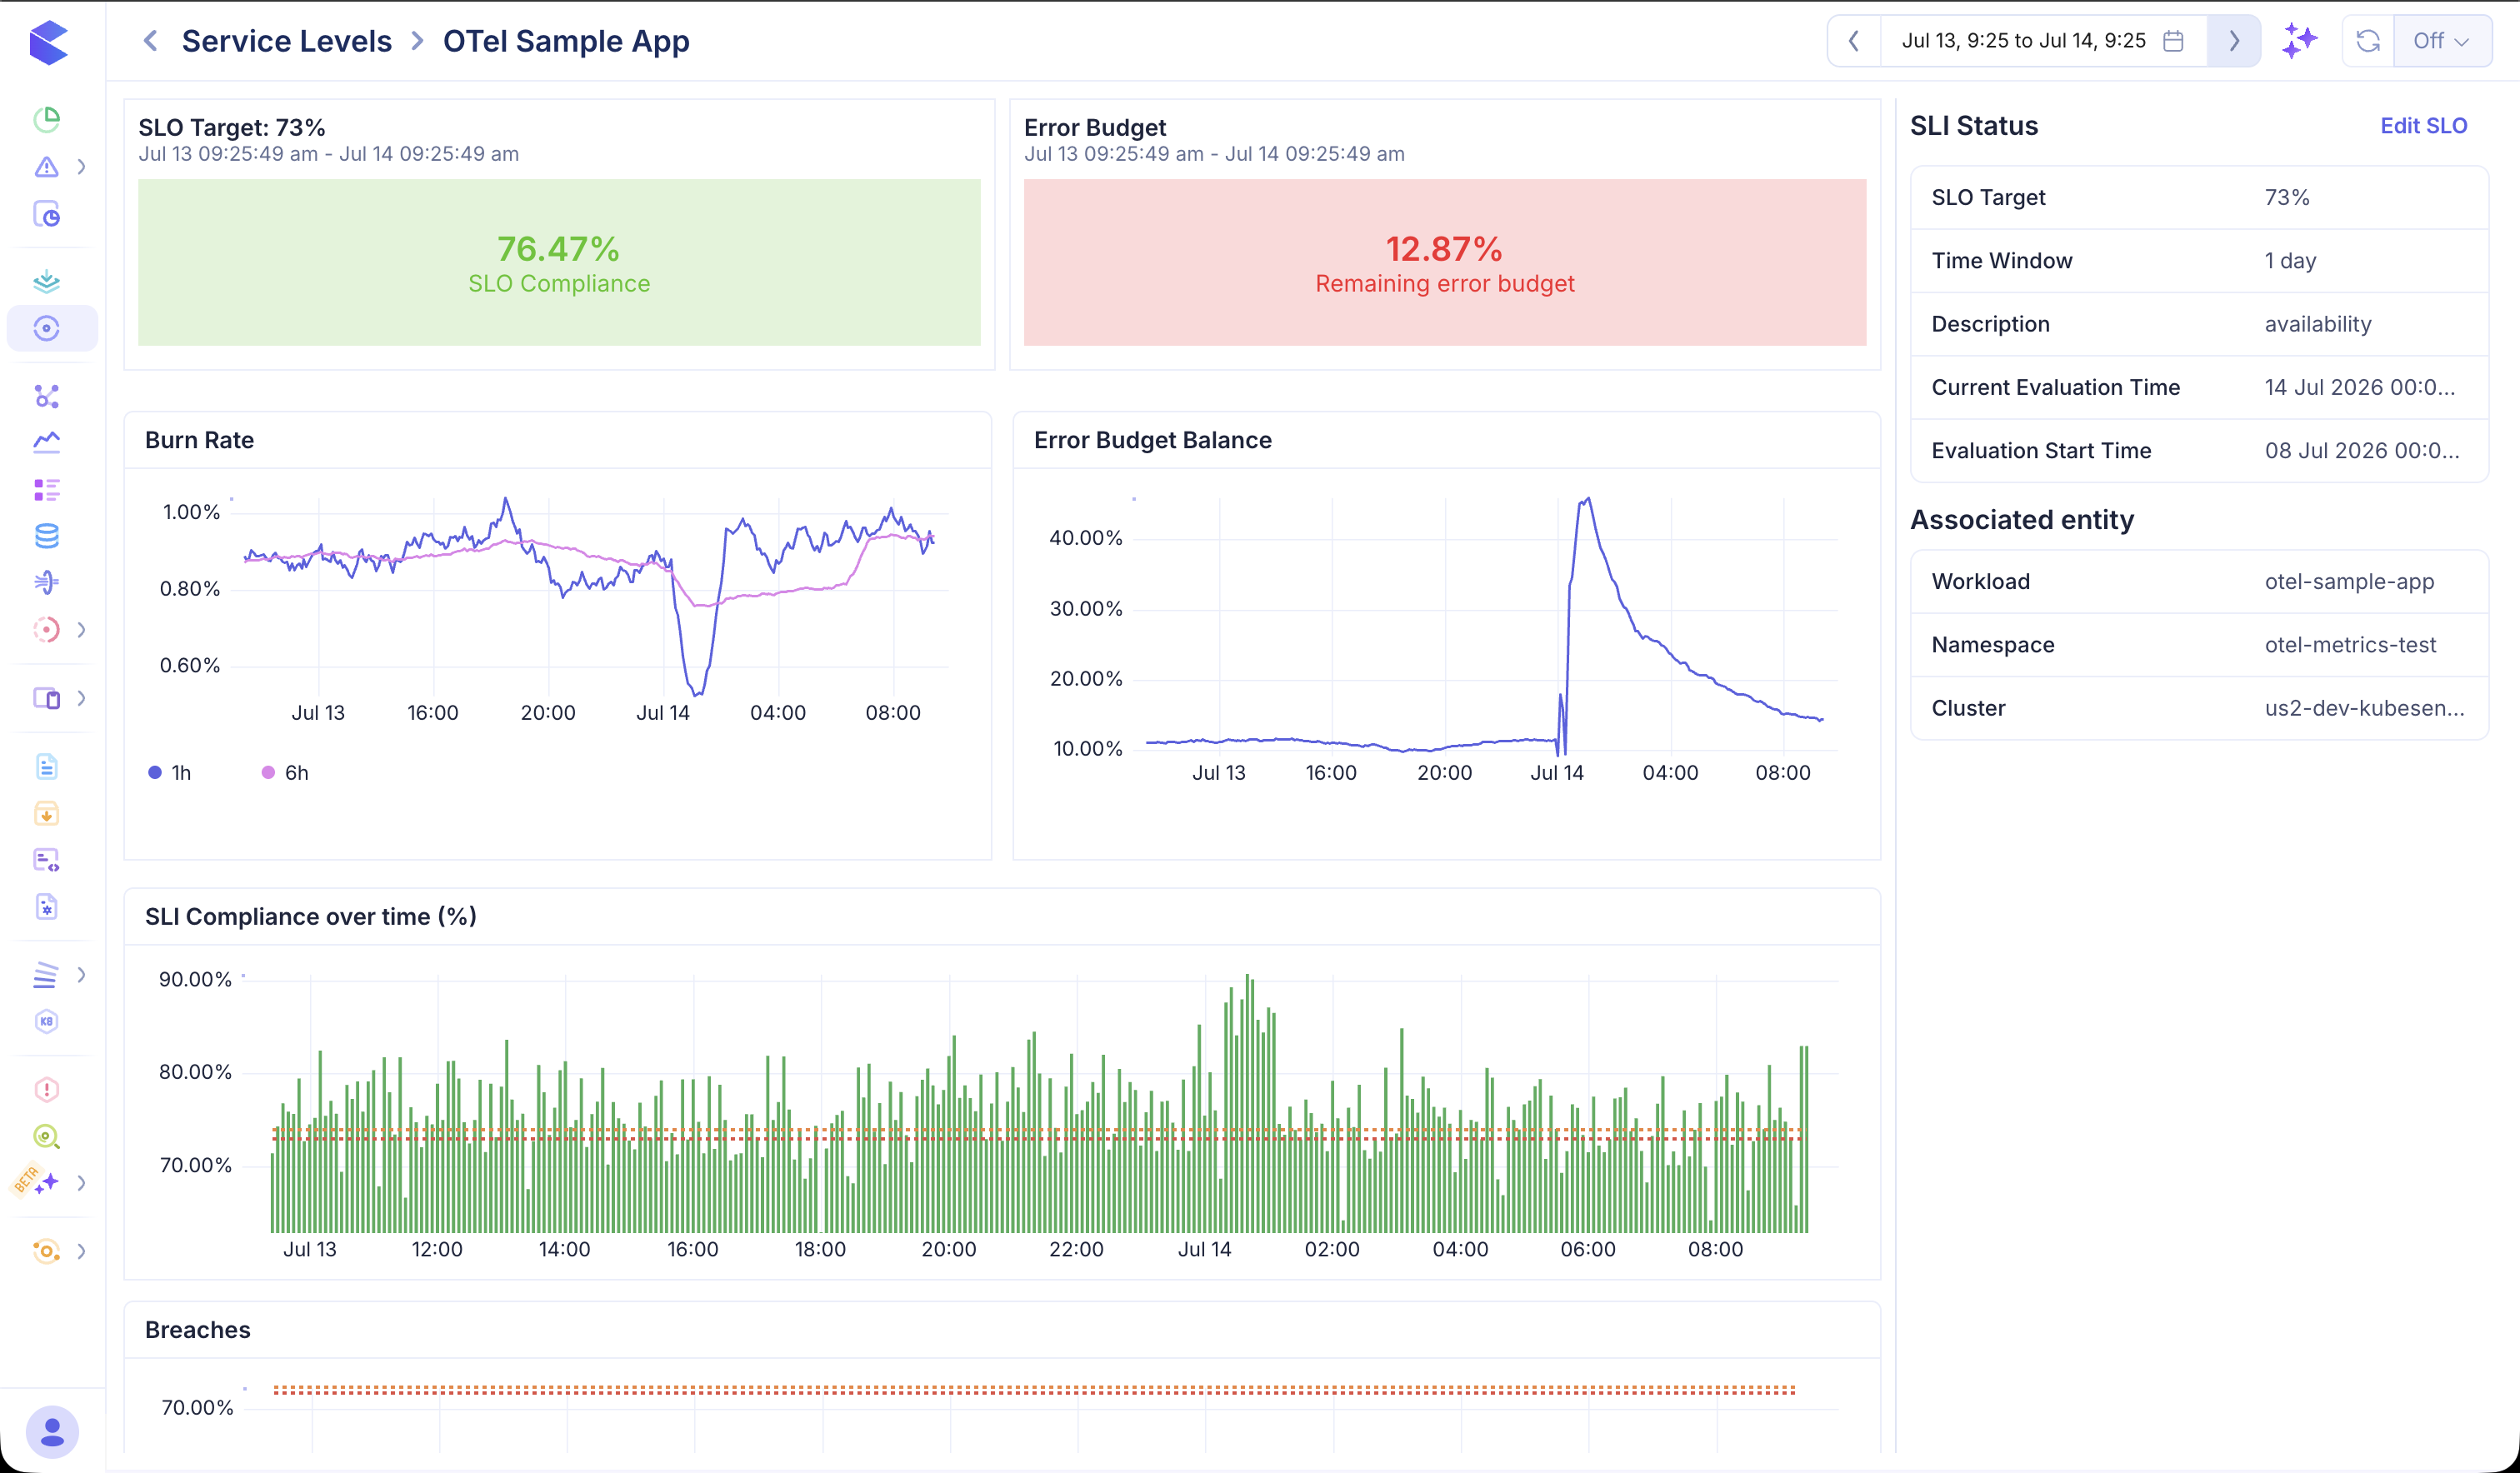
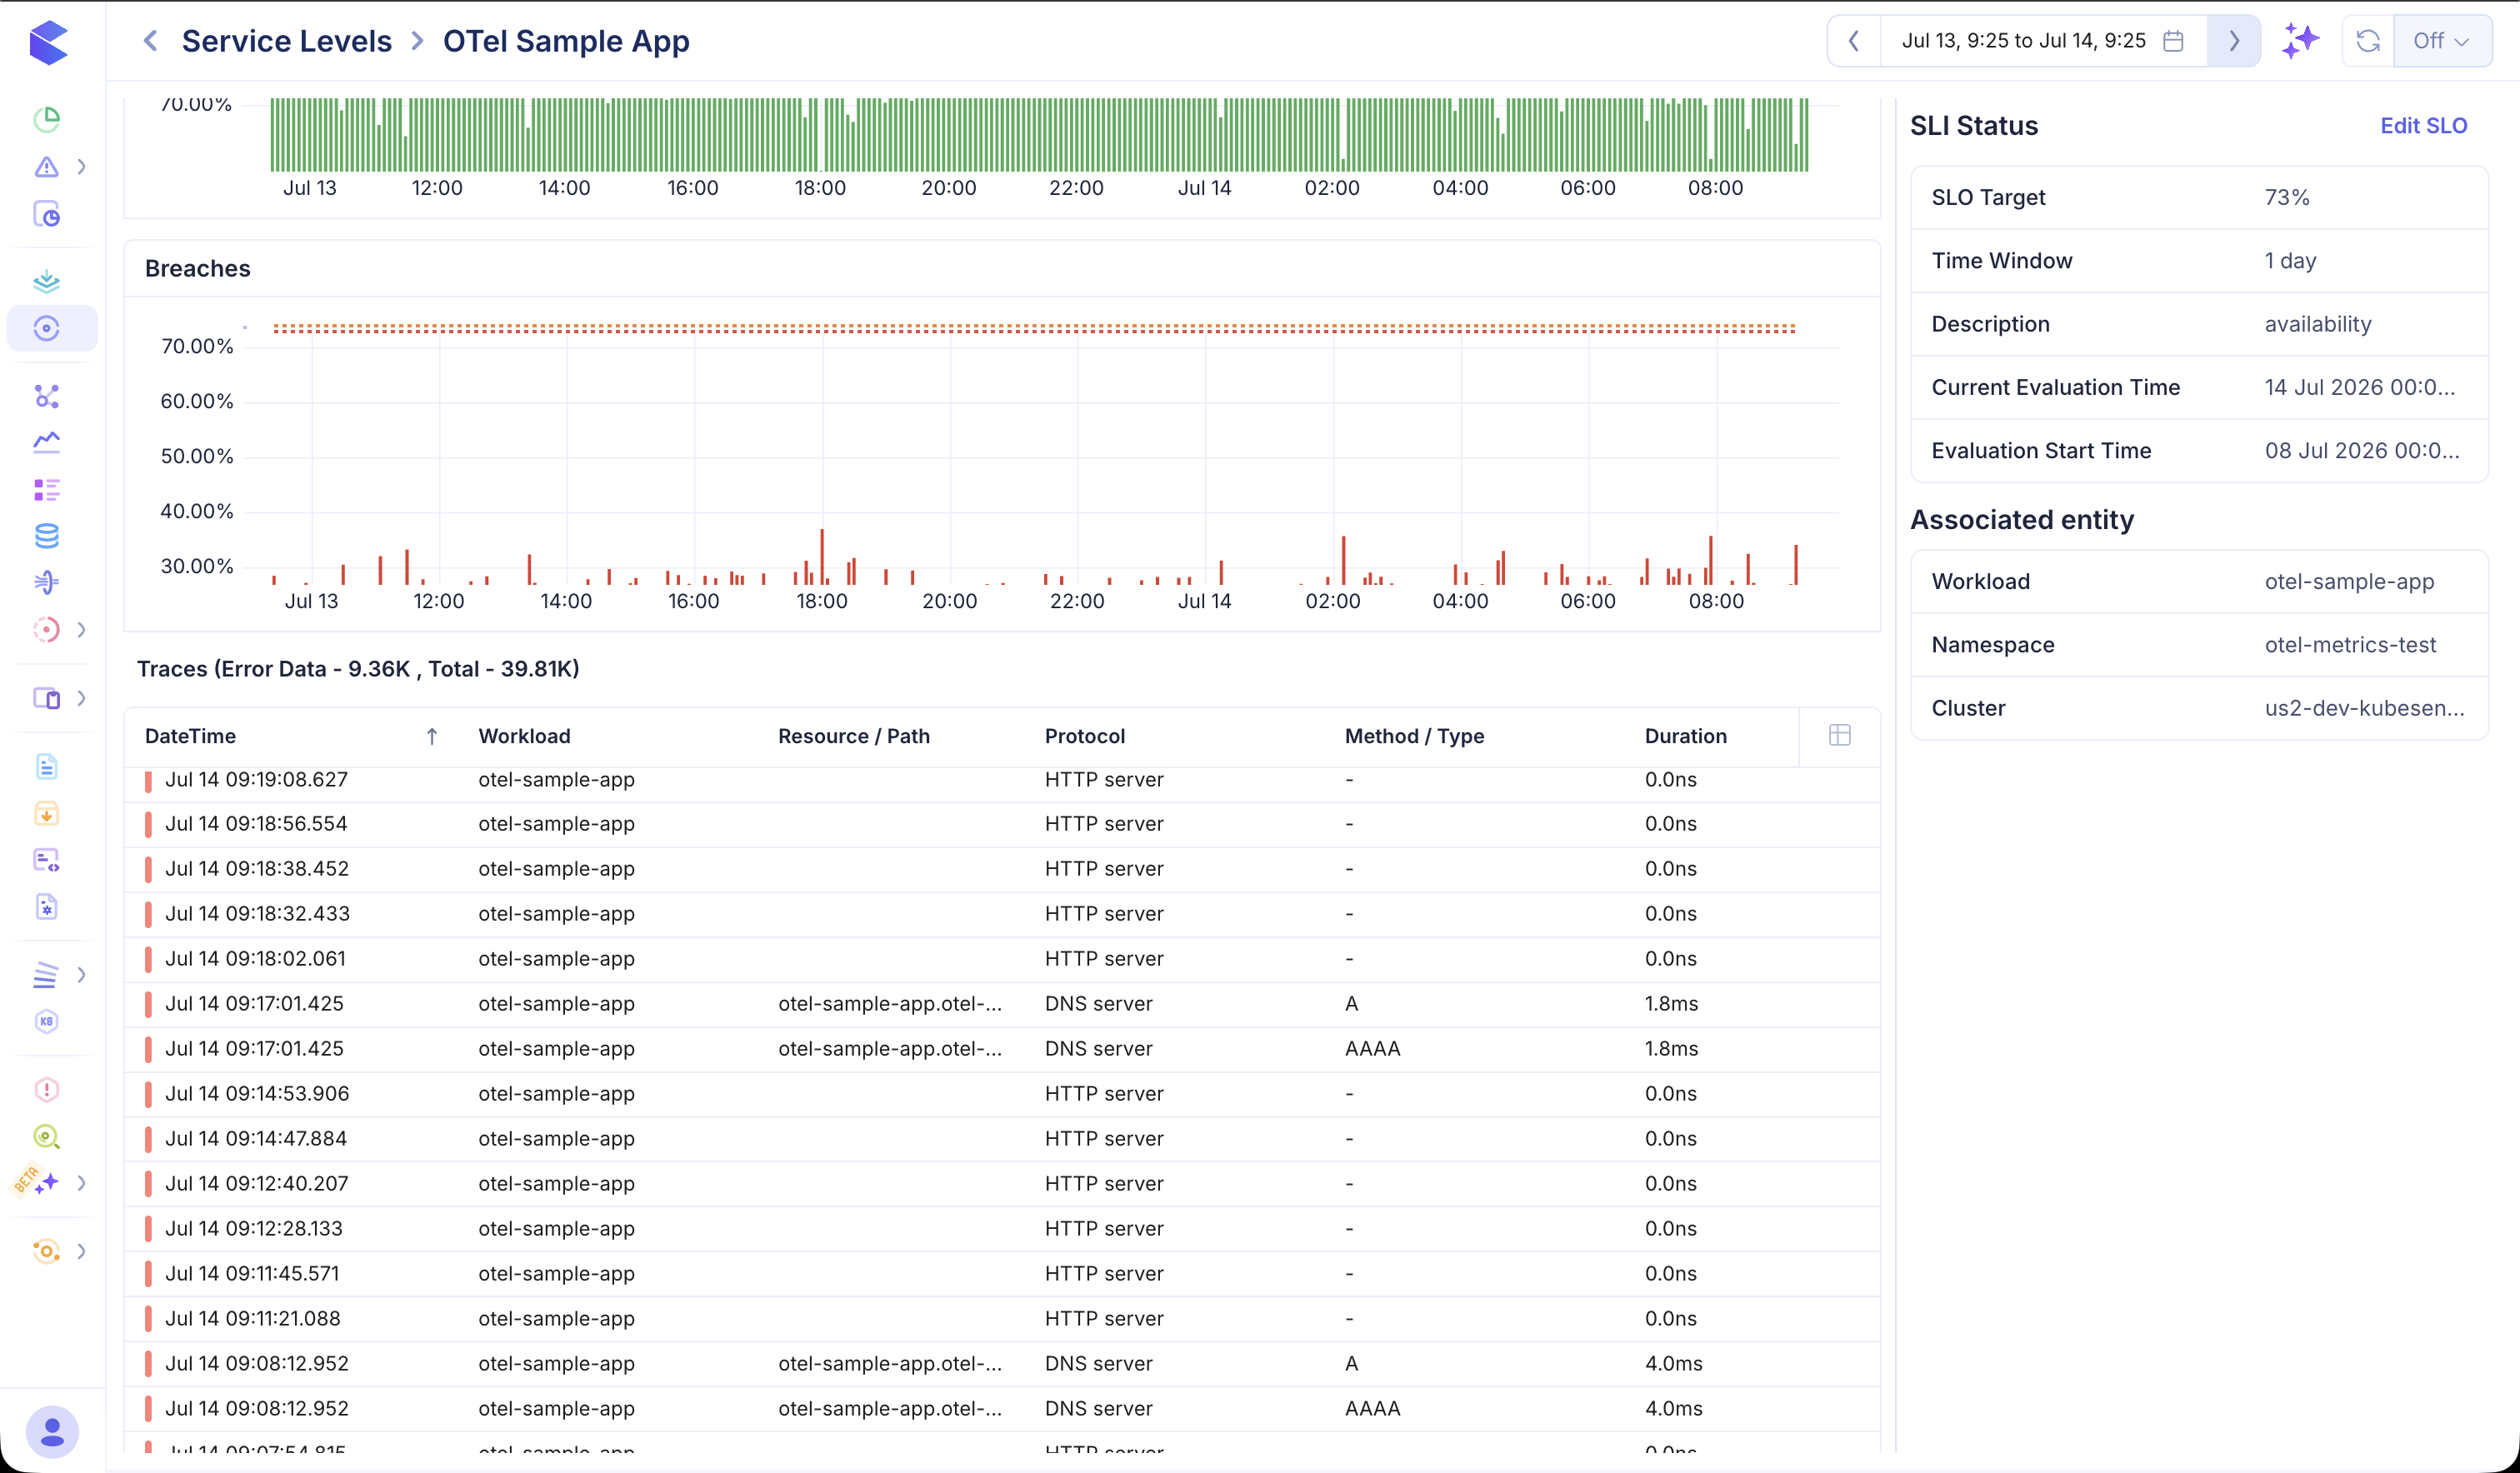
- Per-service SLO status at a glance
- Error budget consumption trends
- SLO compliance history over the selected time range — use the time picker to set the window
Burn Rate Alerts
Automatic alerting when error budget consumption exceeds expected rates:
- Fast burn — Immediate notification for rapid budget consumption
- Slow burn — Warning when steady degradation will exhaust the budget within the window
Getting Started
Service Levels will be accessible from the Service Levels item in the sidebar once the feature is generally available. Stay tuned for updates.