Settings
The Settings page is the central place to configure how KubeSense collects, stores, and manages your observability data. Access it from the sidebar to control data retention, correlation behavior, RUM applications, resource exclusions, metrics usage, notification channels, and audit logs.
Settings is organized into tabs across the top: Domain, Data Retention, API Key Management, Correlation Timeframe, RUM Application Management, Excluded Resources, Metrics, Notification Channels, and Audit Logs.
Data Retention
Control how long each data type is retained and where it is stored. KubeSense supports a two-tier storage model:
- Hot tier (Disk) — Fast, local storage for recent data that you query frequently
- Cold tier (Object Storage / S3) — Cost-effective storage for older data that you access less often
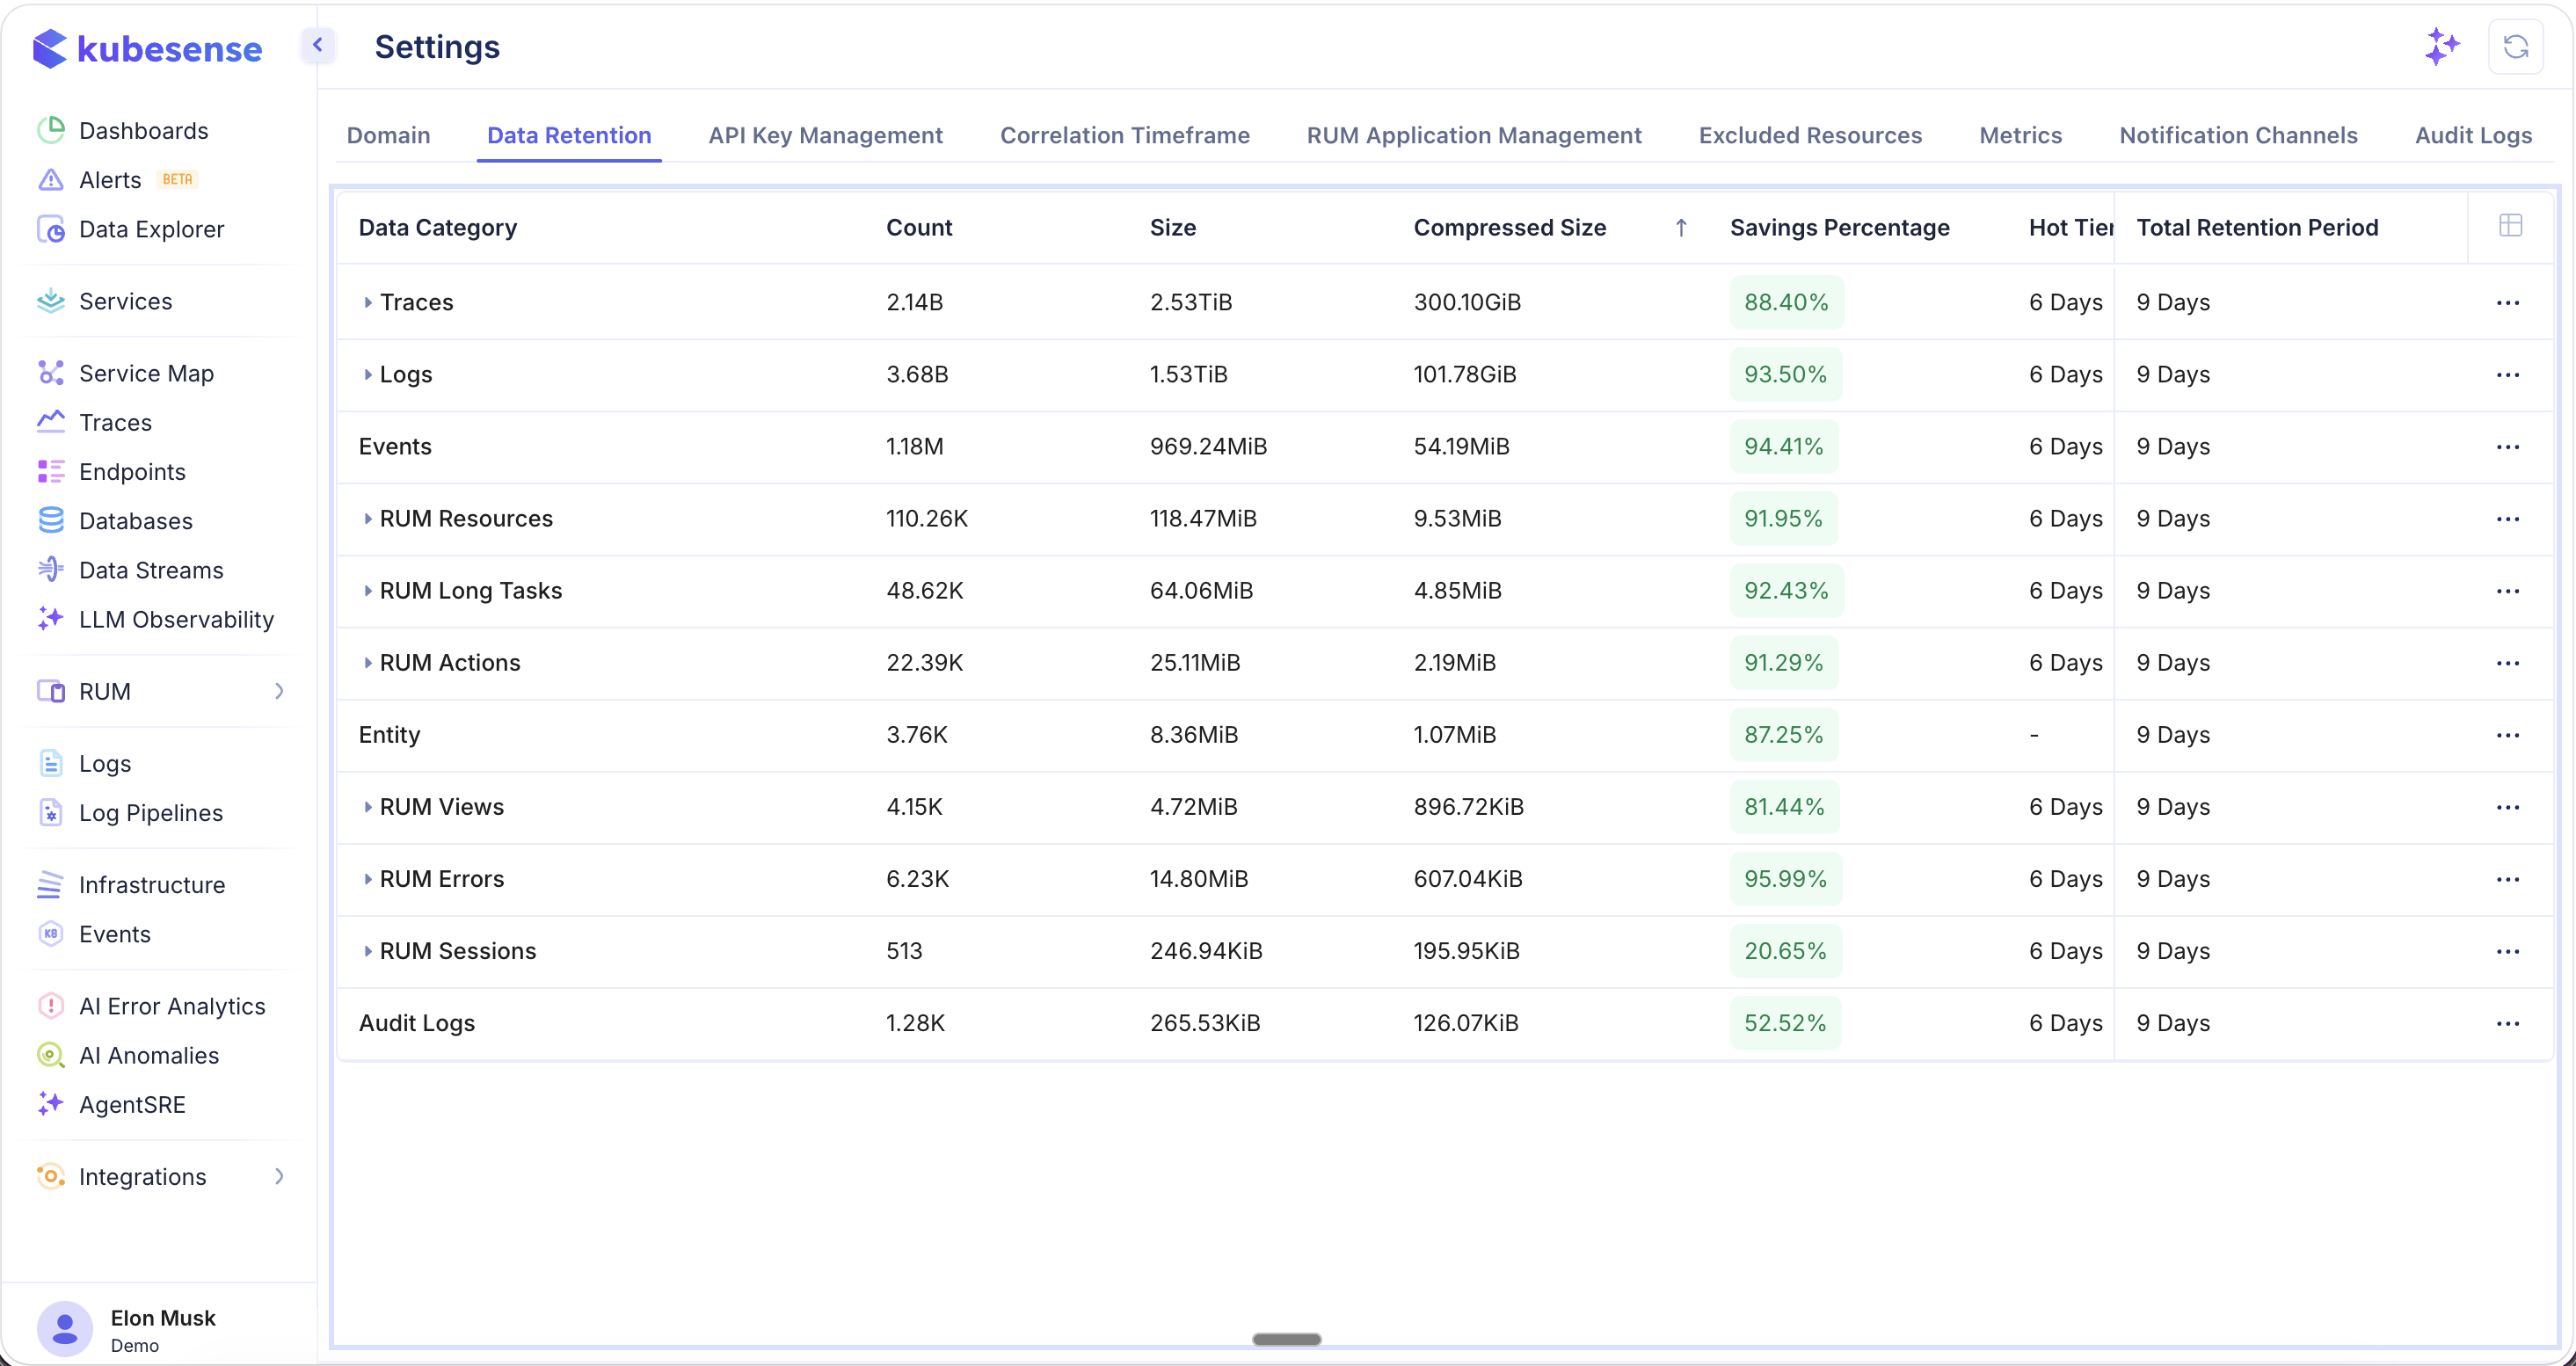
The retention table shows each data type with:
| Column | Description |
|---|---|
| Data Type | The category of observability data (e.g., Traces, Logs, Metrics) |
| Retention Period | How long data is kept before deletion |
| Actual Size | Raw data size on disk |
| Compressed Size | Size after compression — KubeSense achieves 93–95% compression, significantly reducing storage costs |
Editing Retention Rules
Click on any data type to modify its retention settings.
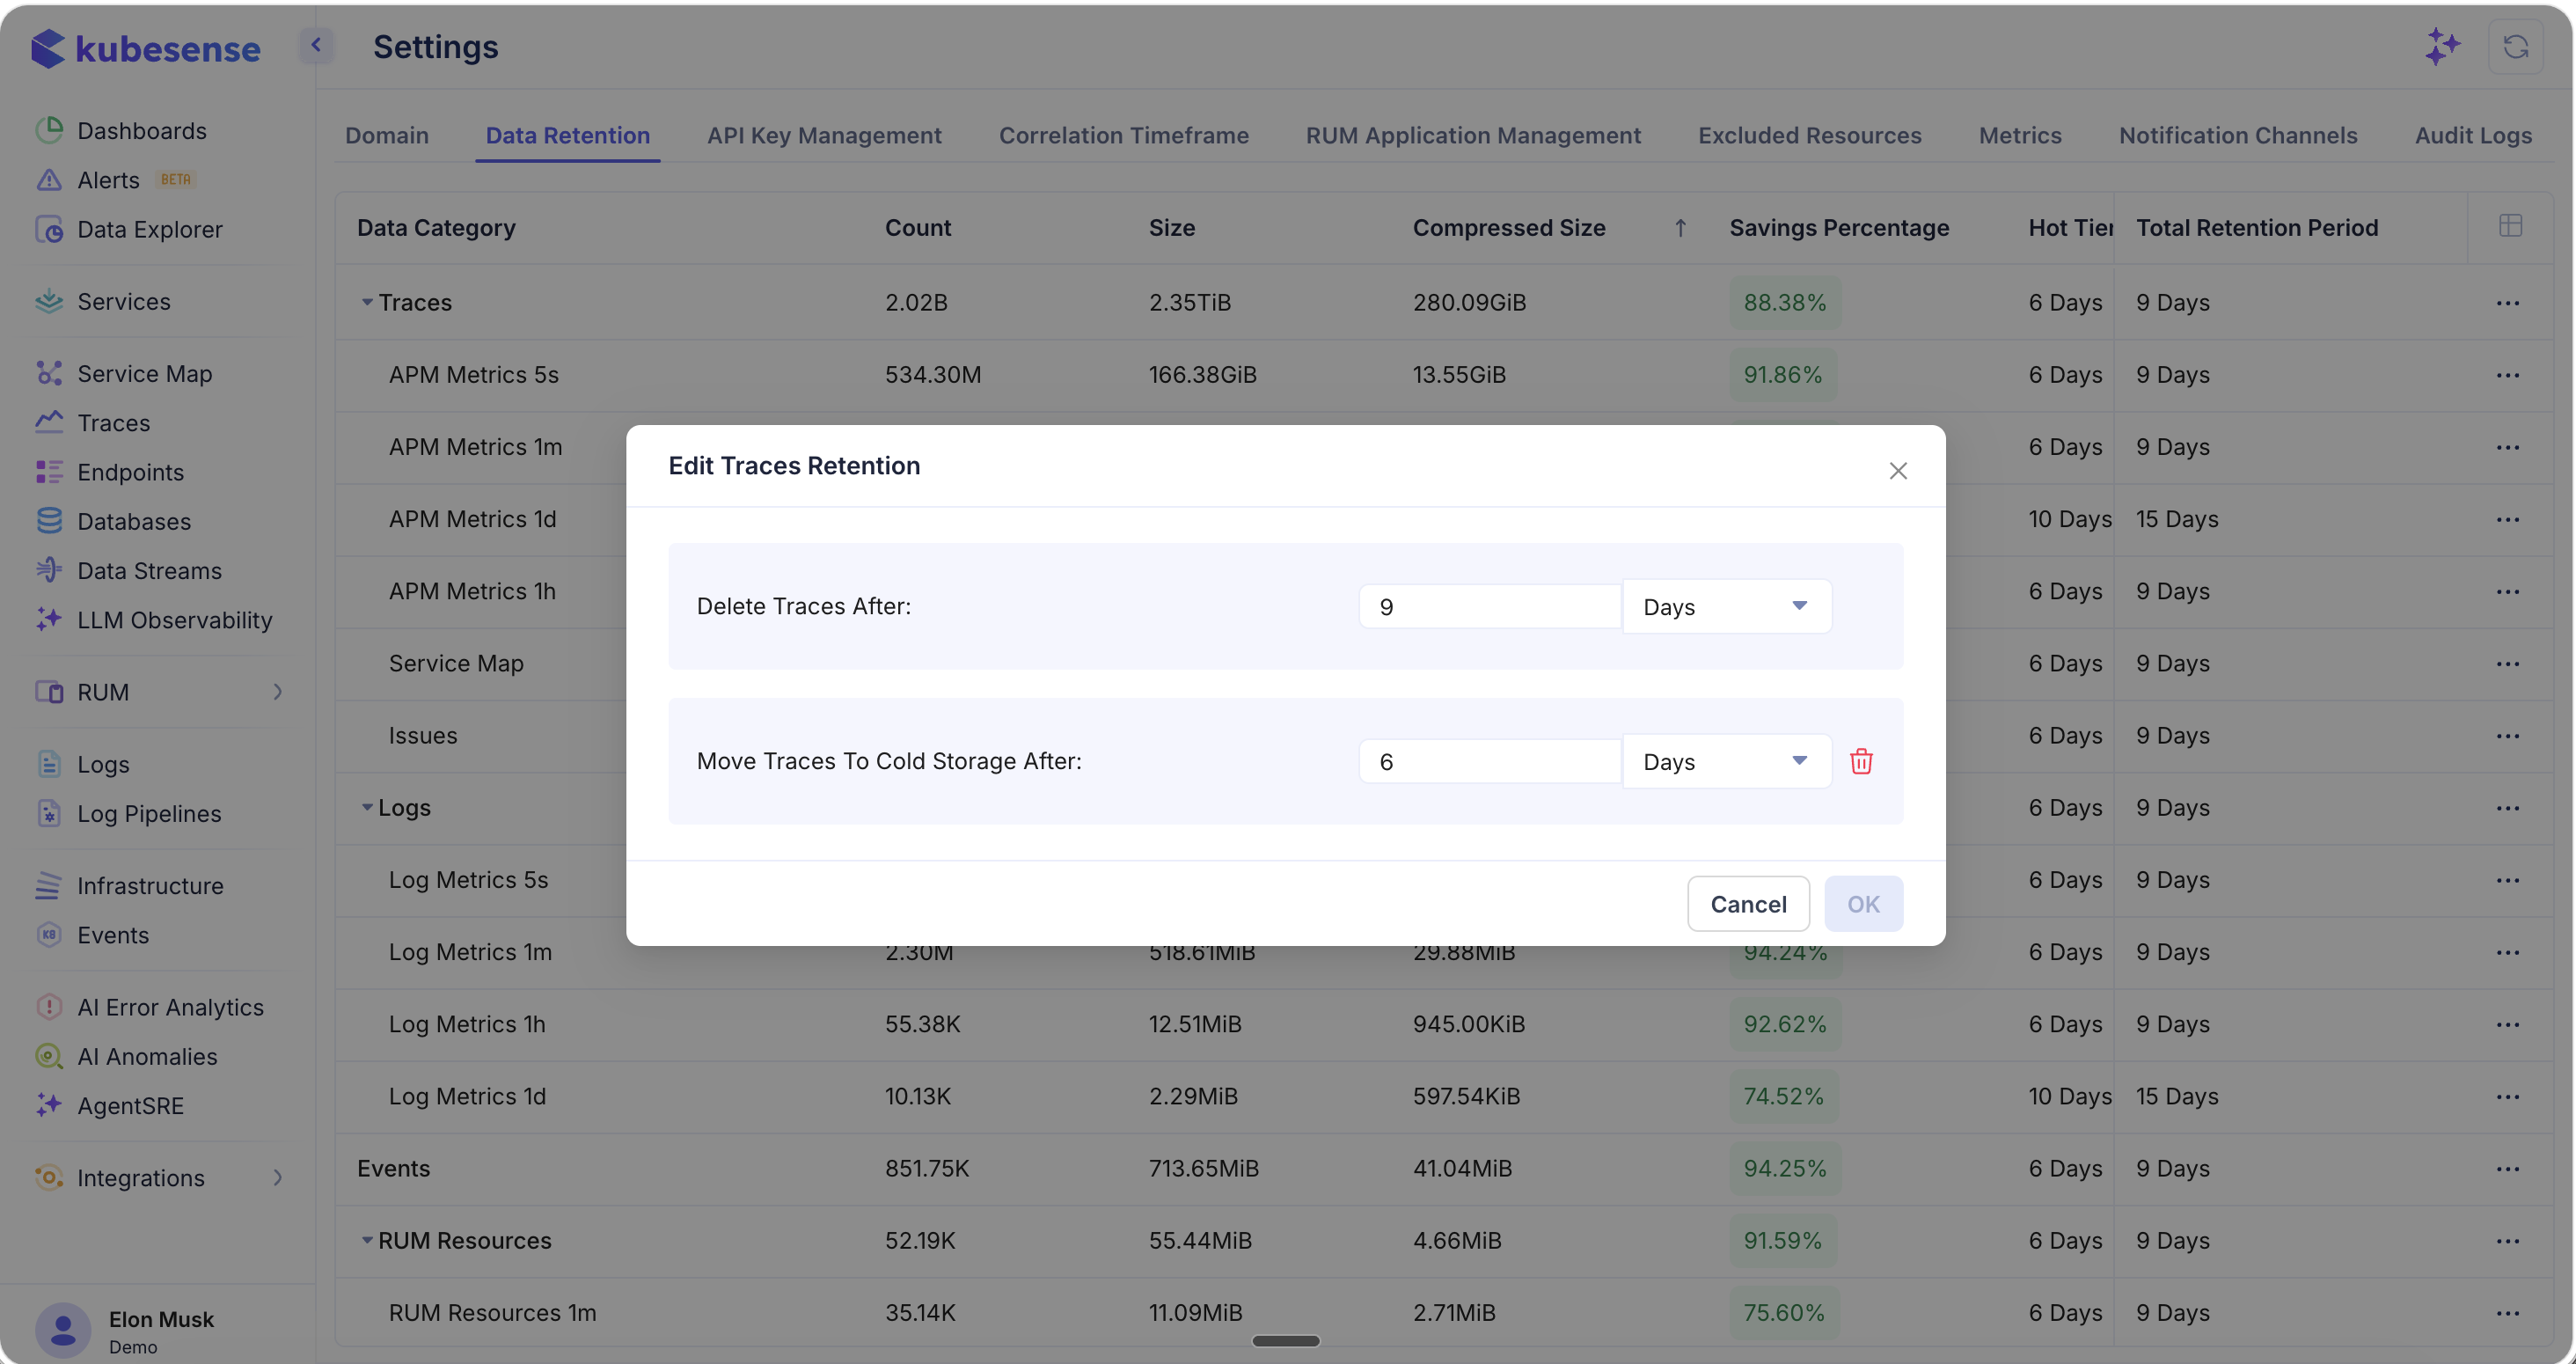
The edit dialog lets you configure:
- Move to cold storage after — Number of days before data moves from the hot tier (disk) to the cold tier (object storage/S3). This keeps recent data fast to query while reducing storage costs for older data.
- Delete traces purge setting — The maximum retention period after which data is permanently deleted.
Correlation Timeframe
Configure the time window used to correlate logs, metrics, and traces when navigating between signals.
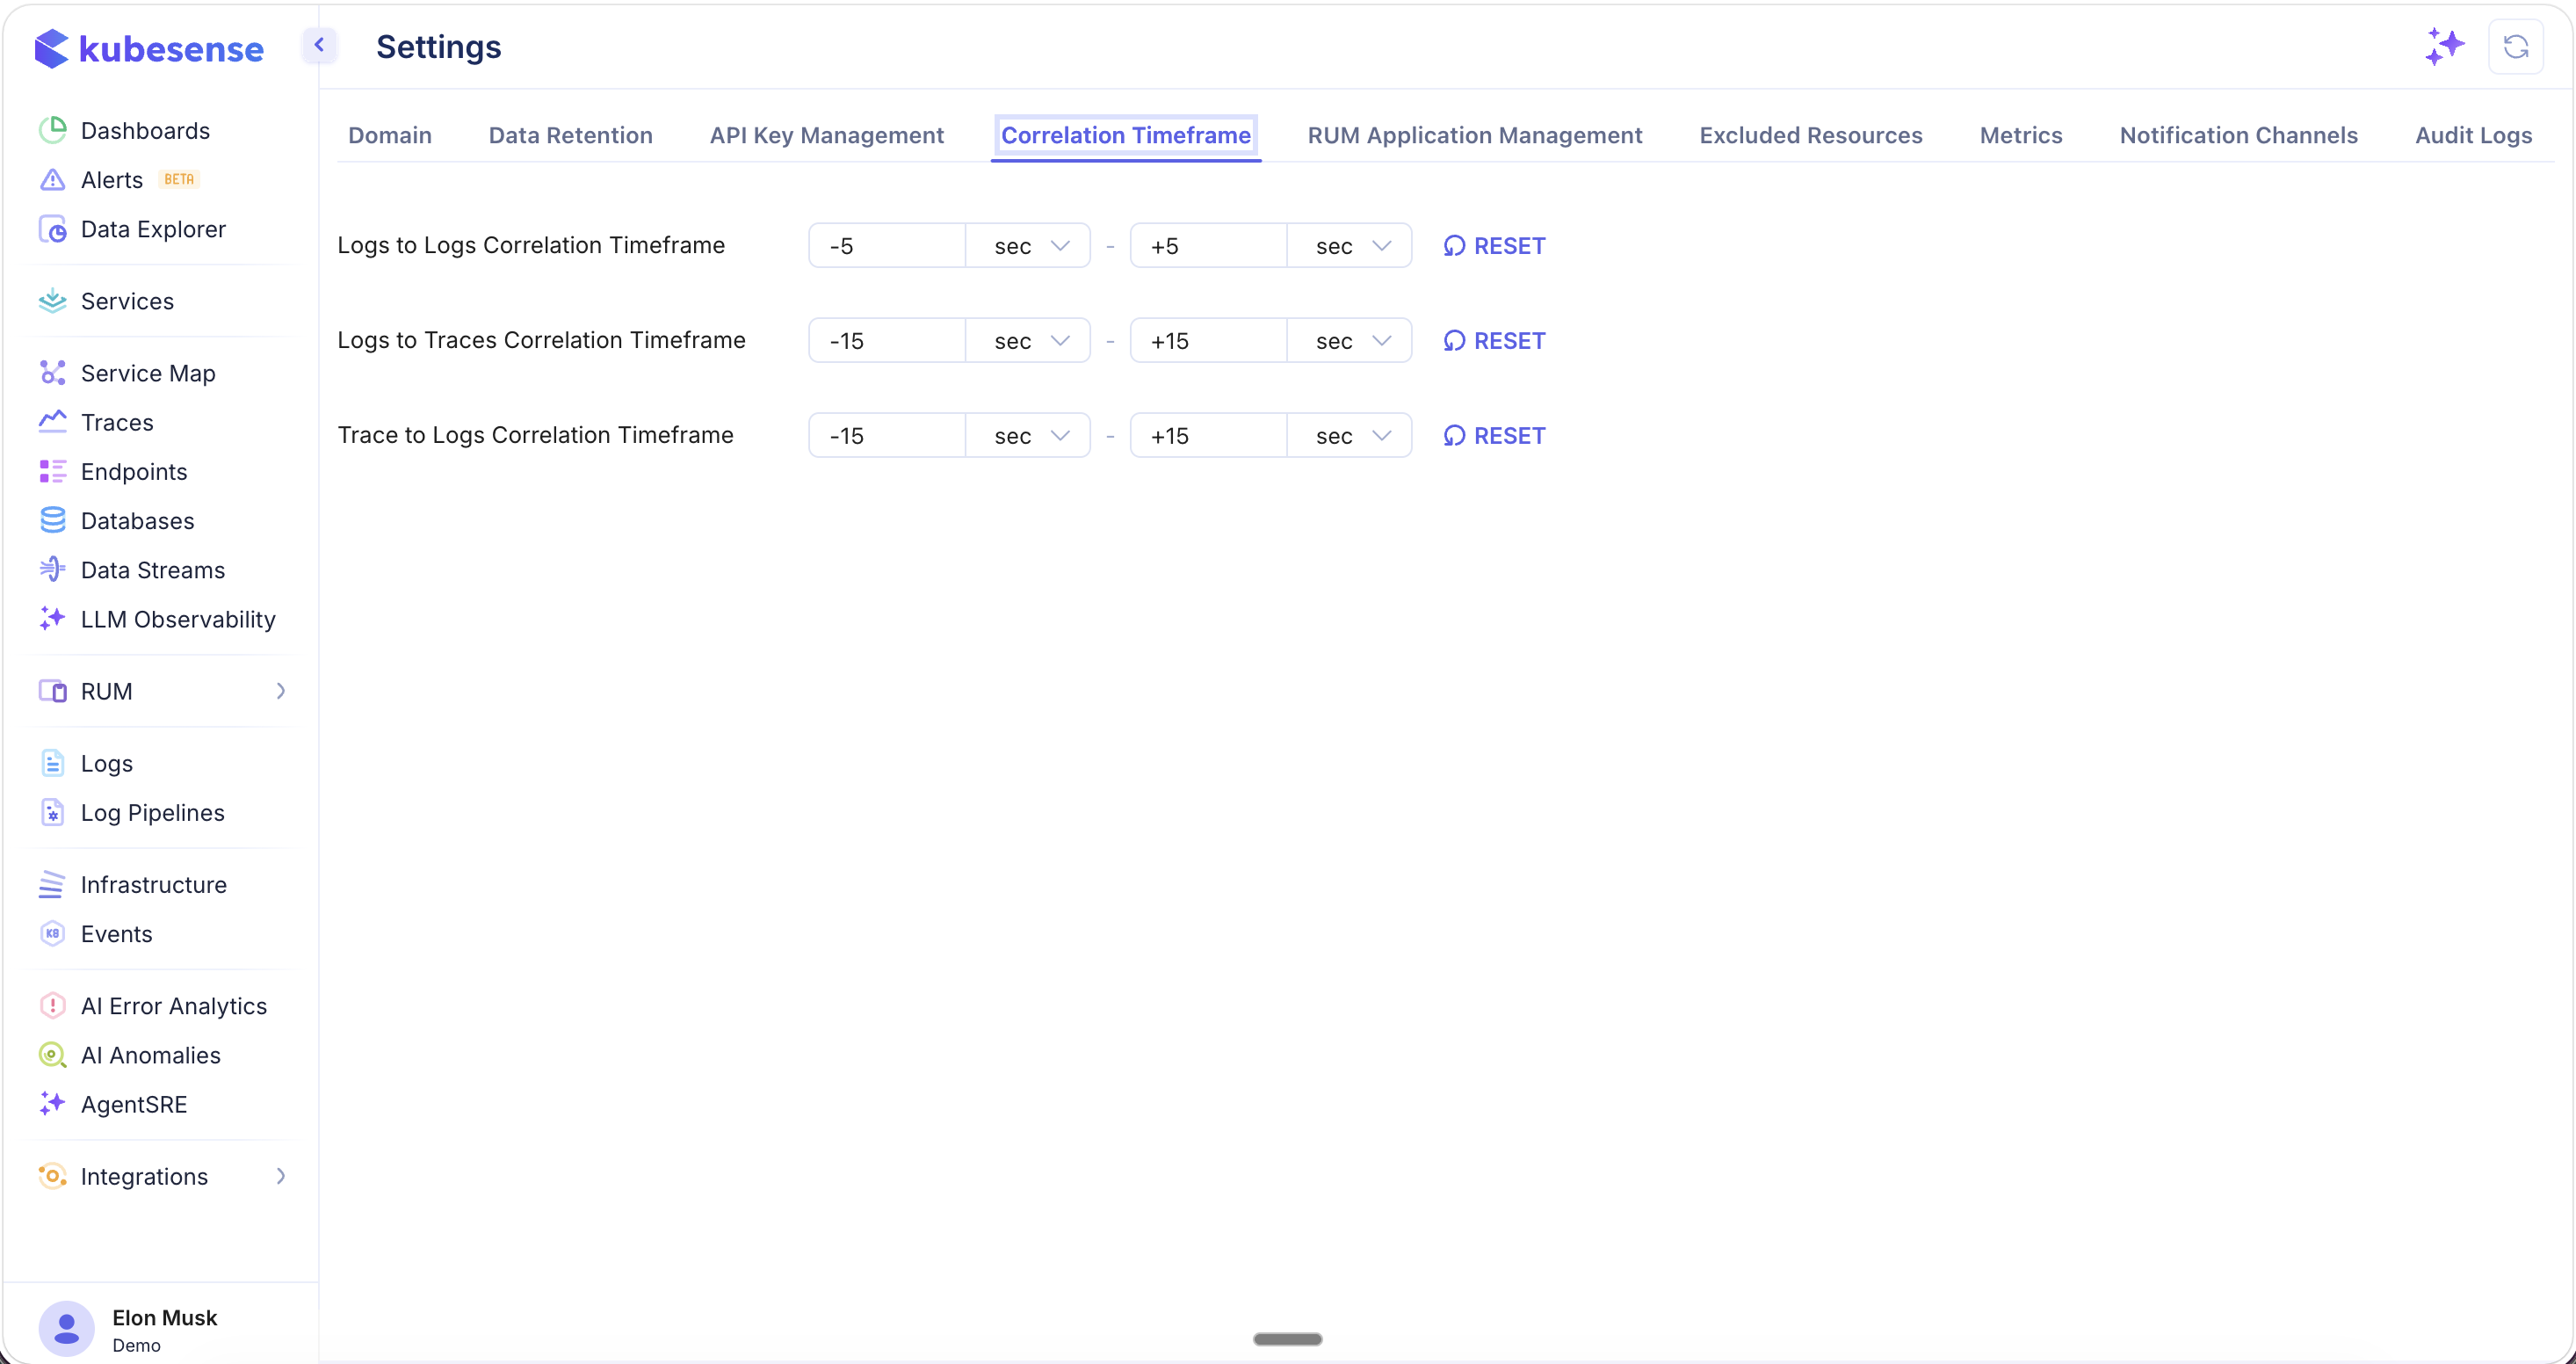
When you click from a trace to related logs, or from a log entry to associated metrics, KubeSense uses this configured window (e.g., 5 seconds, 10 seconds) to find correlated data around the event timestamp. A shorter window gives more precise correlations; a longer window catches events with slight timing offsets.
RUM Application Management
Manage the Real User Monitoring (RUM) applications connected to KubeSense.
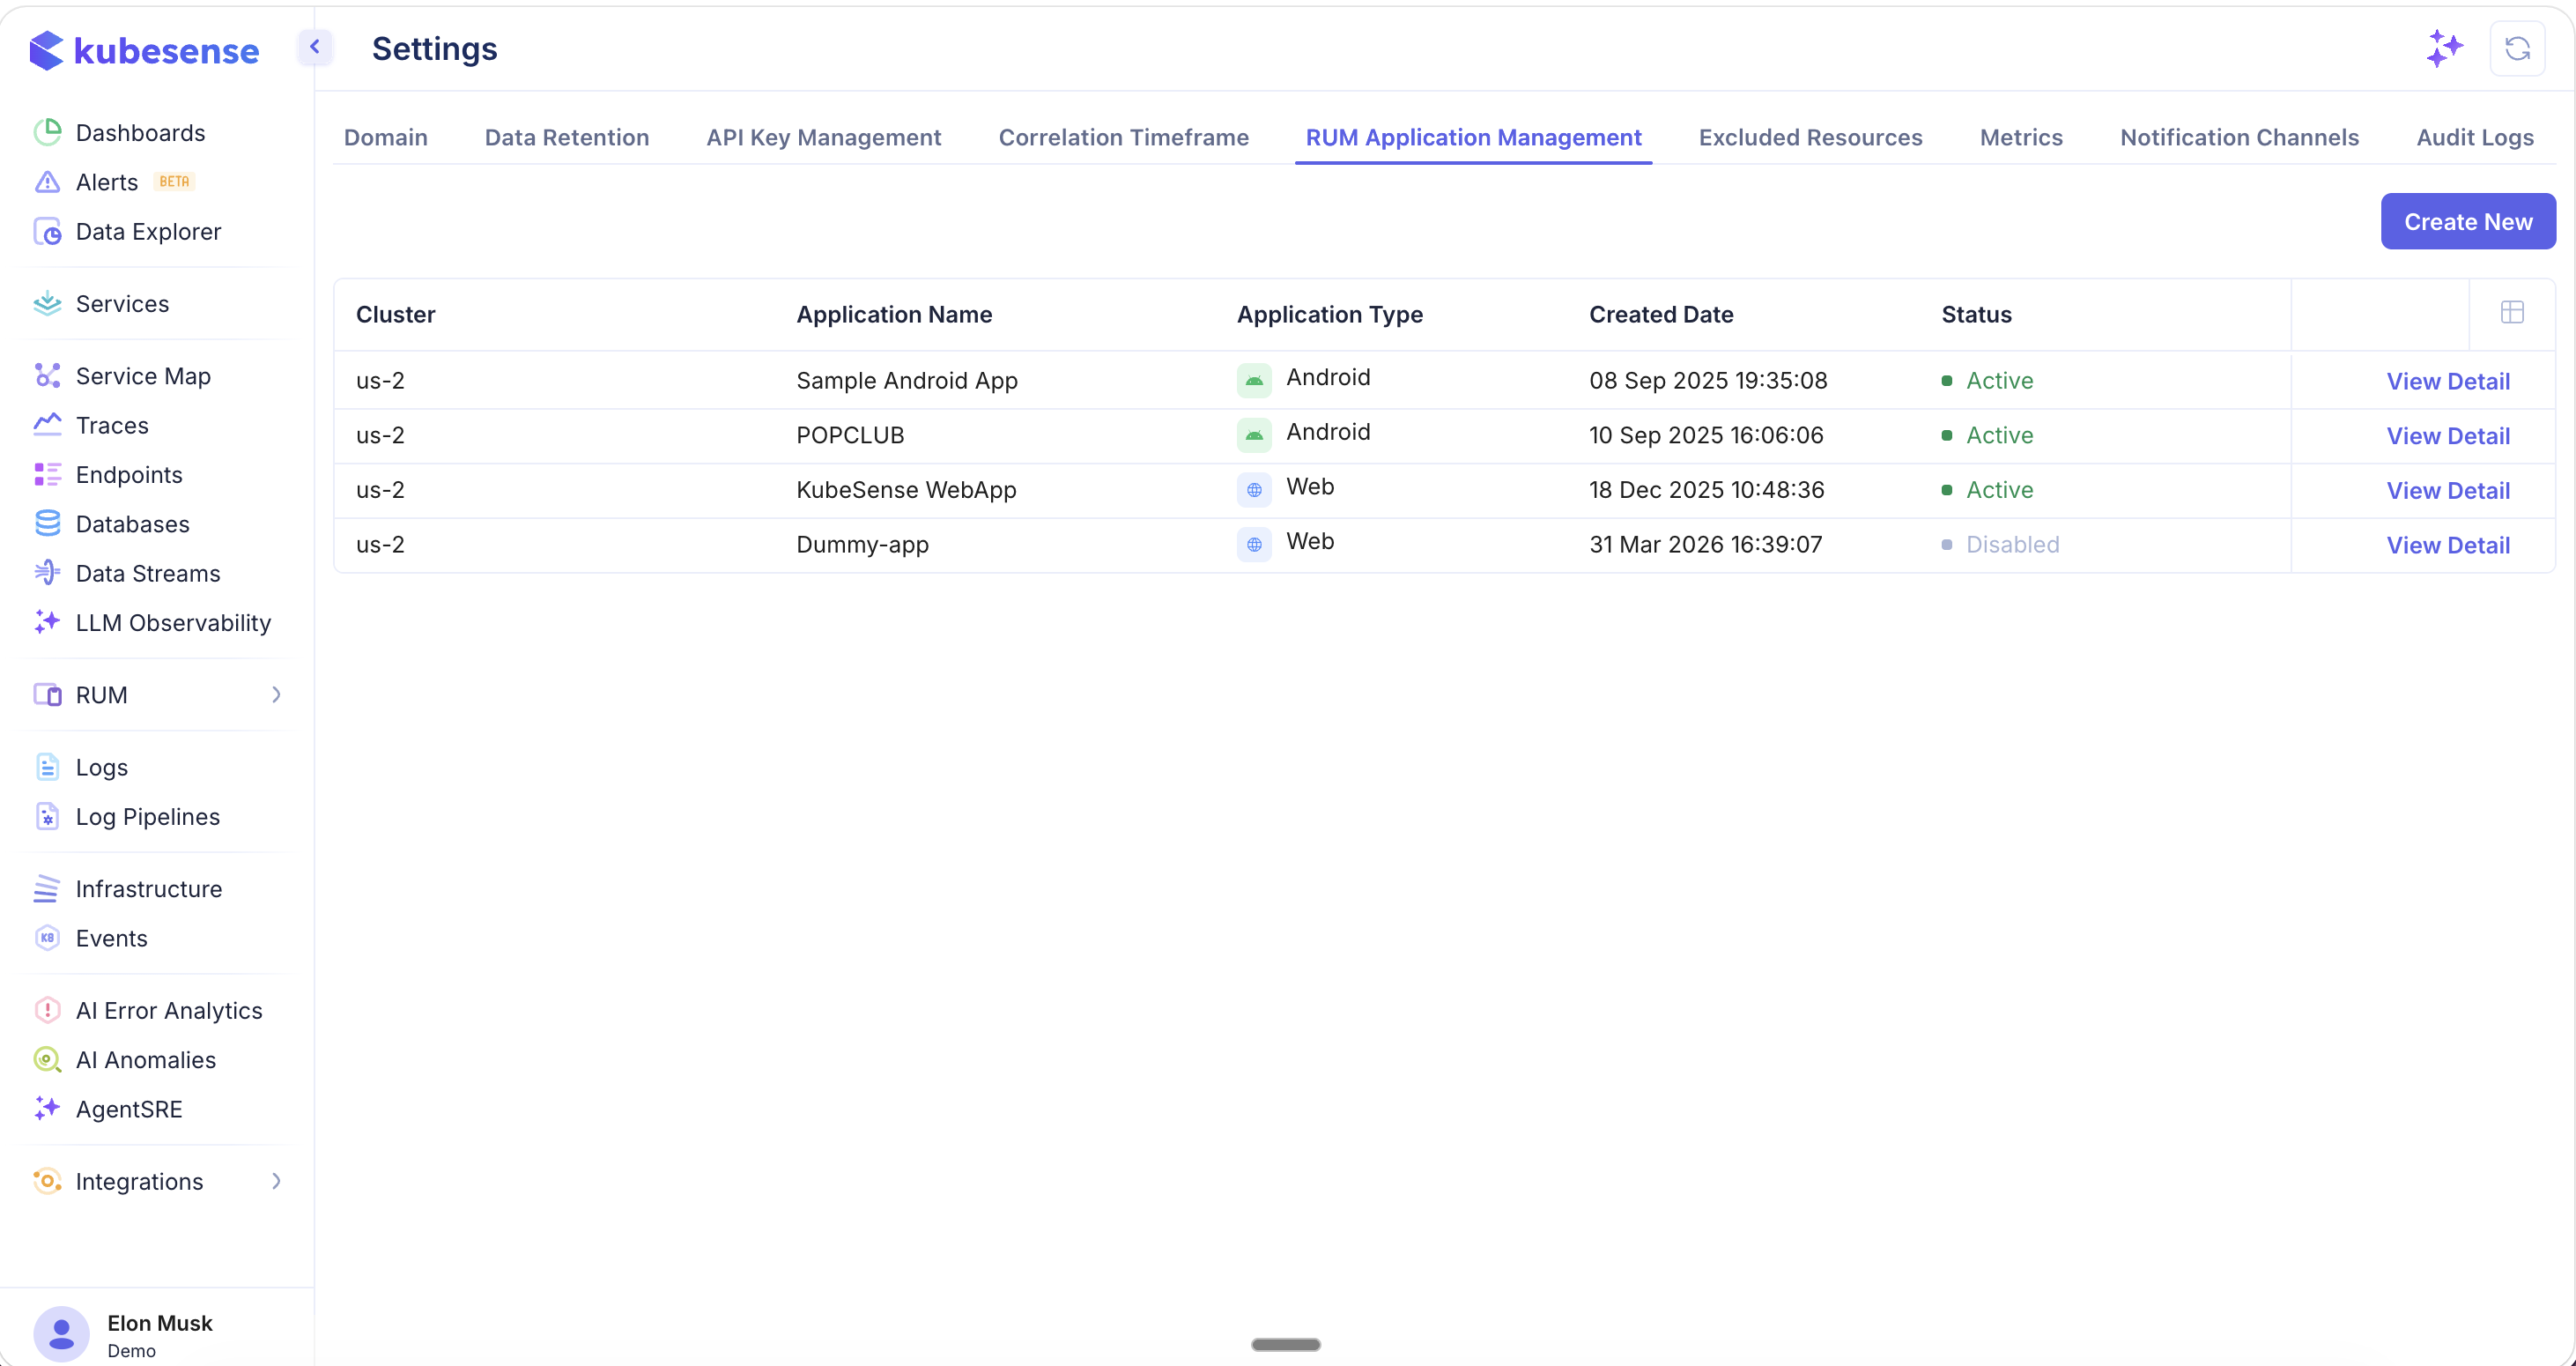
The management table lists all registered RUM applications with:
| Column | Description |
|---|---|
| Application Name | The name assigned to the RUM application |
| Application Type | The platform — Android, iOS, or Web |
| Created Date | When the application was registered |
| Active | Toggle to enable or disable monitoring for the application |
Adding a New RUM Application
Click Add New Application to register a new app for RUM monitoring.
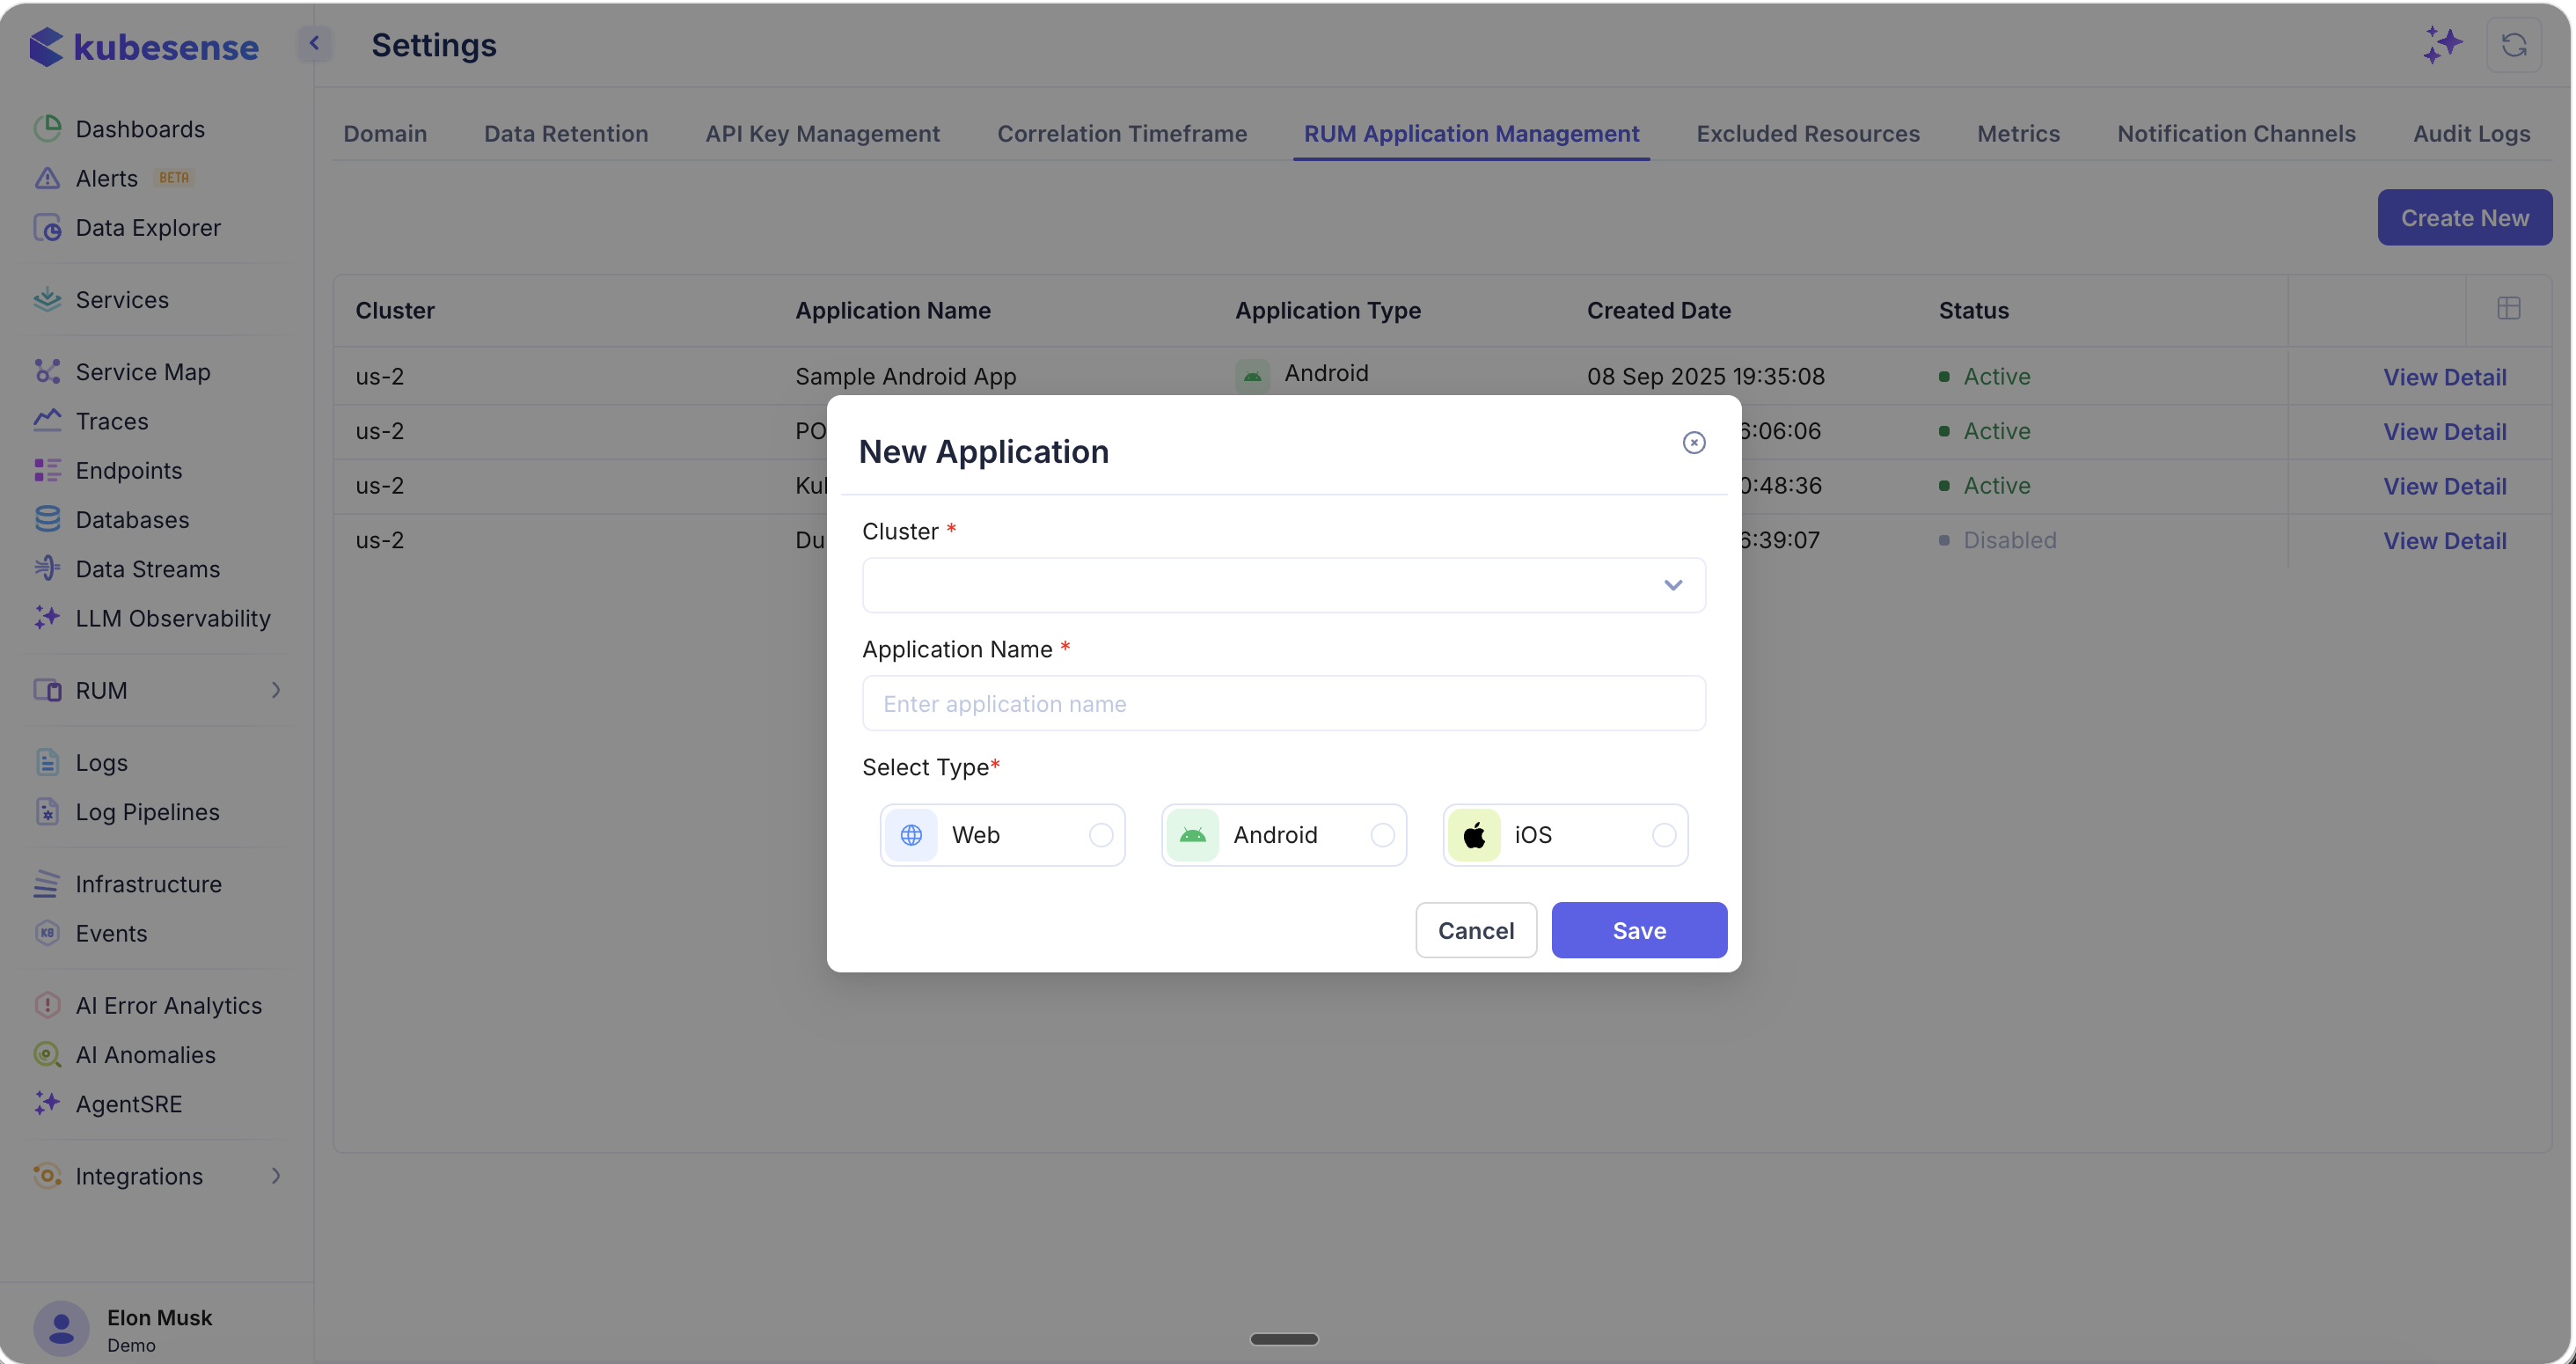
Provide the application name and select the platform type. Once created, KubeSense generates the instrumentation configuration needed to start collecting real user data from the application.
Excluded Resources
Exclude noisy or irrelevant endpoints from monitoring — such as health checks, internal system calls, or any endpoints you do not need to track. Excluded resources will not appear on the Endpoints page or contribute to your metrics.
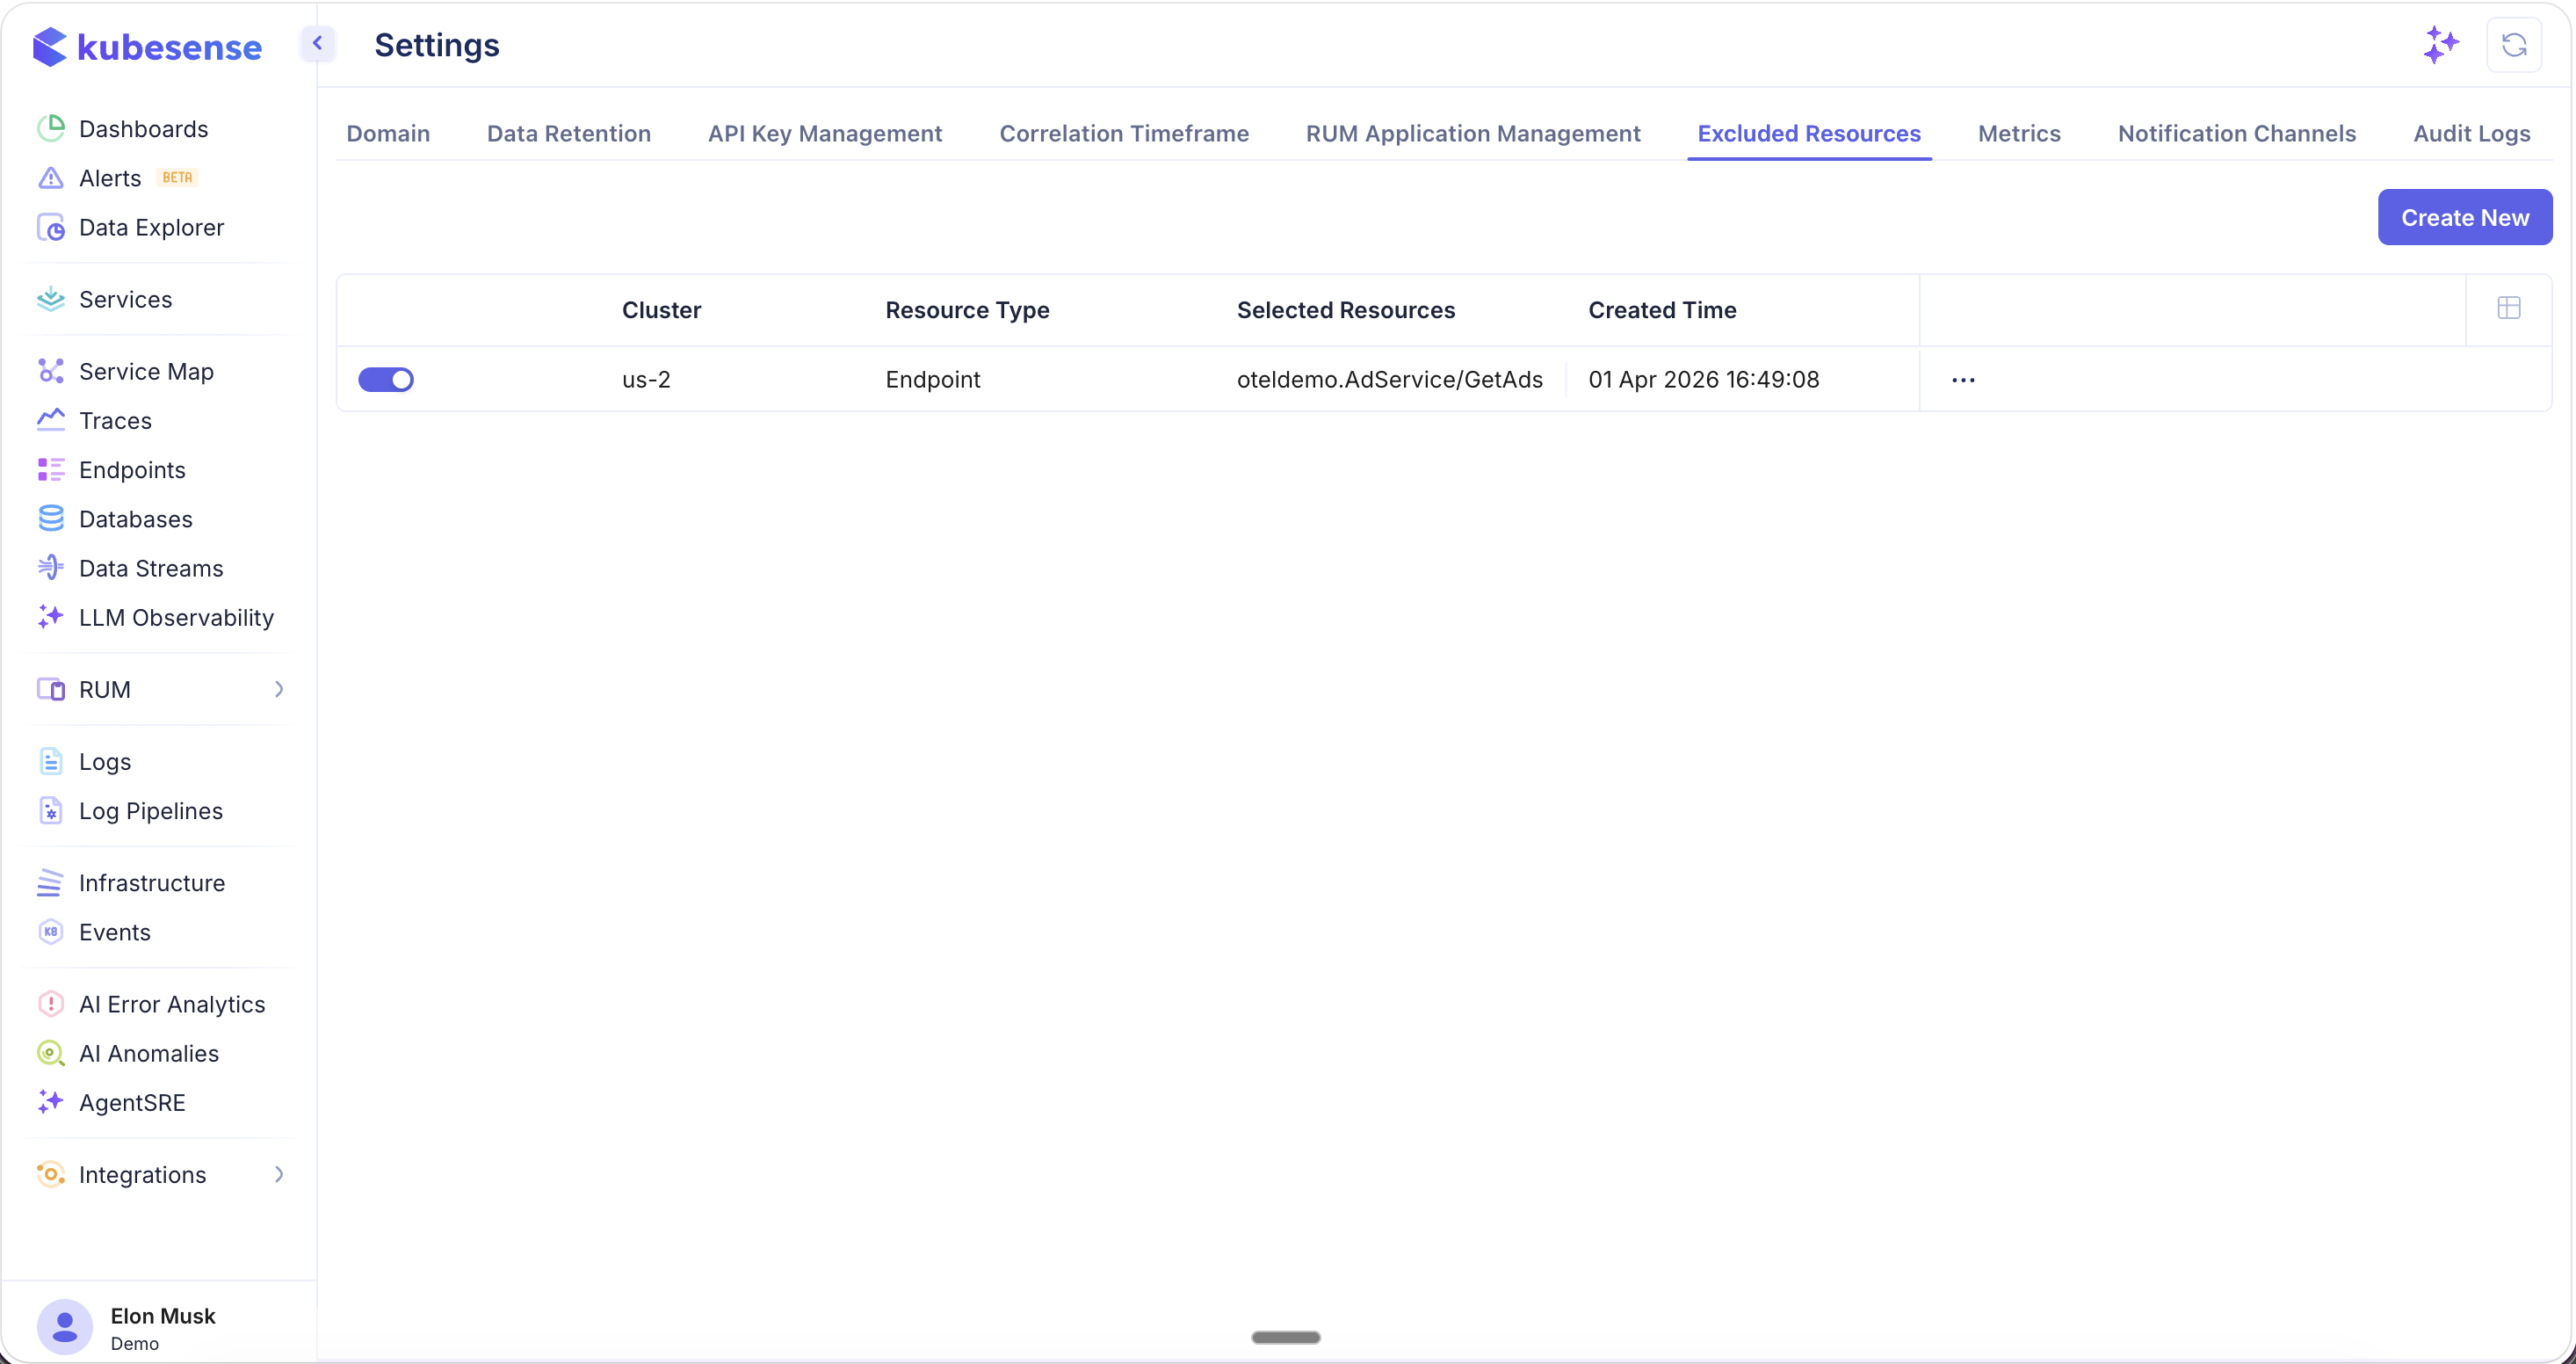
The exclusion list shows all currently excluded resources with:
| Column | Description |
|---|---|
| Cluster | The cluster where the exclusion applies |
| Resource Type | The type of resource excluded (e.g., Endpoint) |
| Selected Resources | The specific endpoints or paths being excluded |
| Created Time | When the exclusion rule was created |
Each exclusion has a toggle to enable or disable it without deleting the rule.
Creating an Exclusion from Settings
Click Create New to add a new exclusion rule.
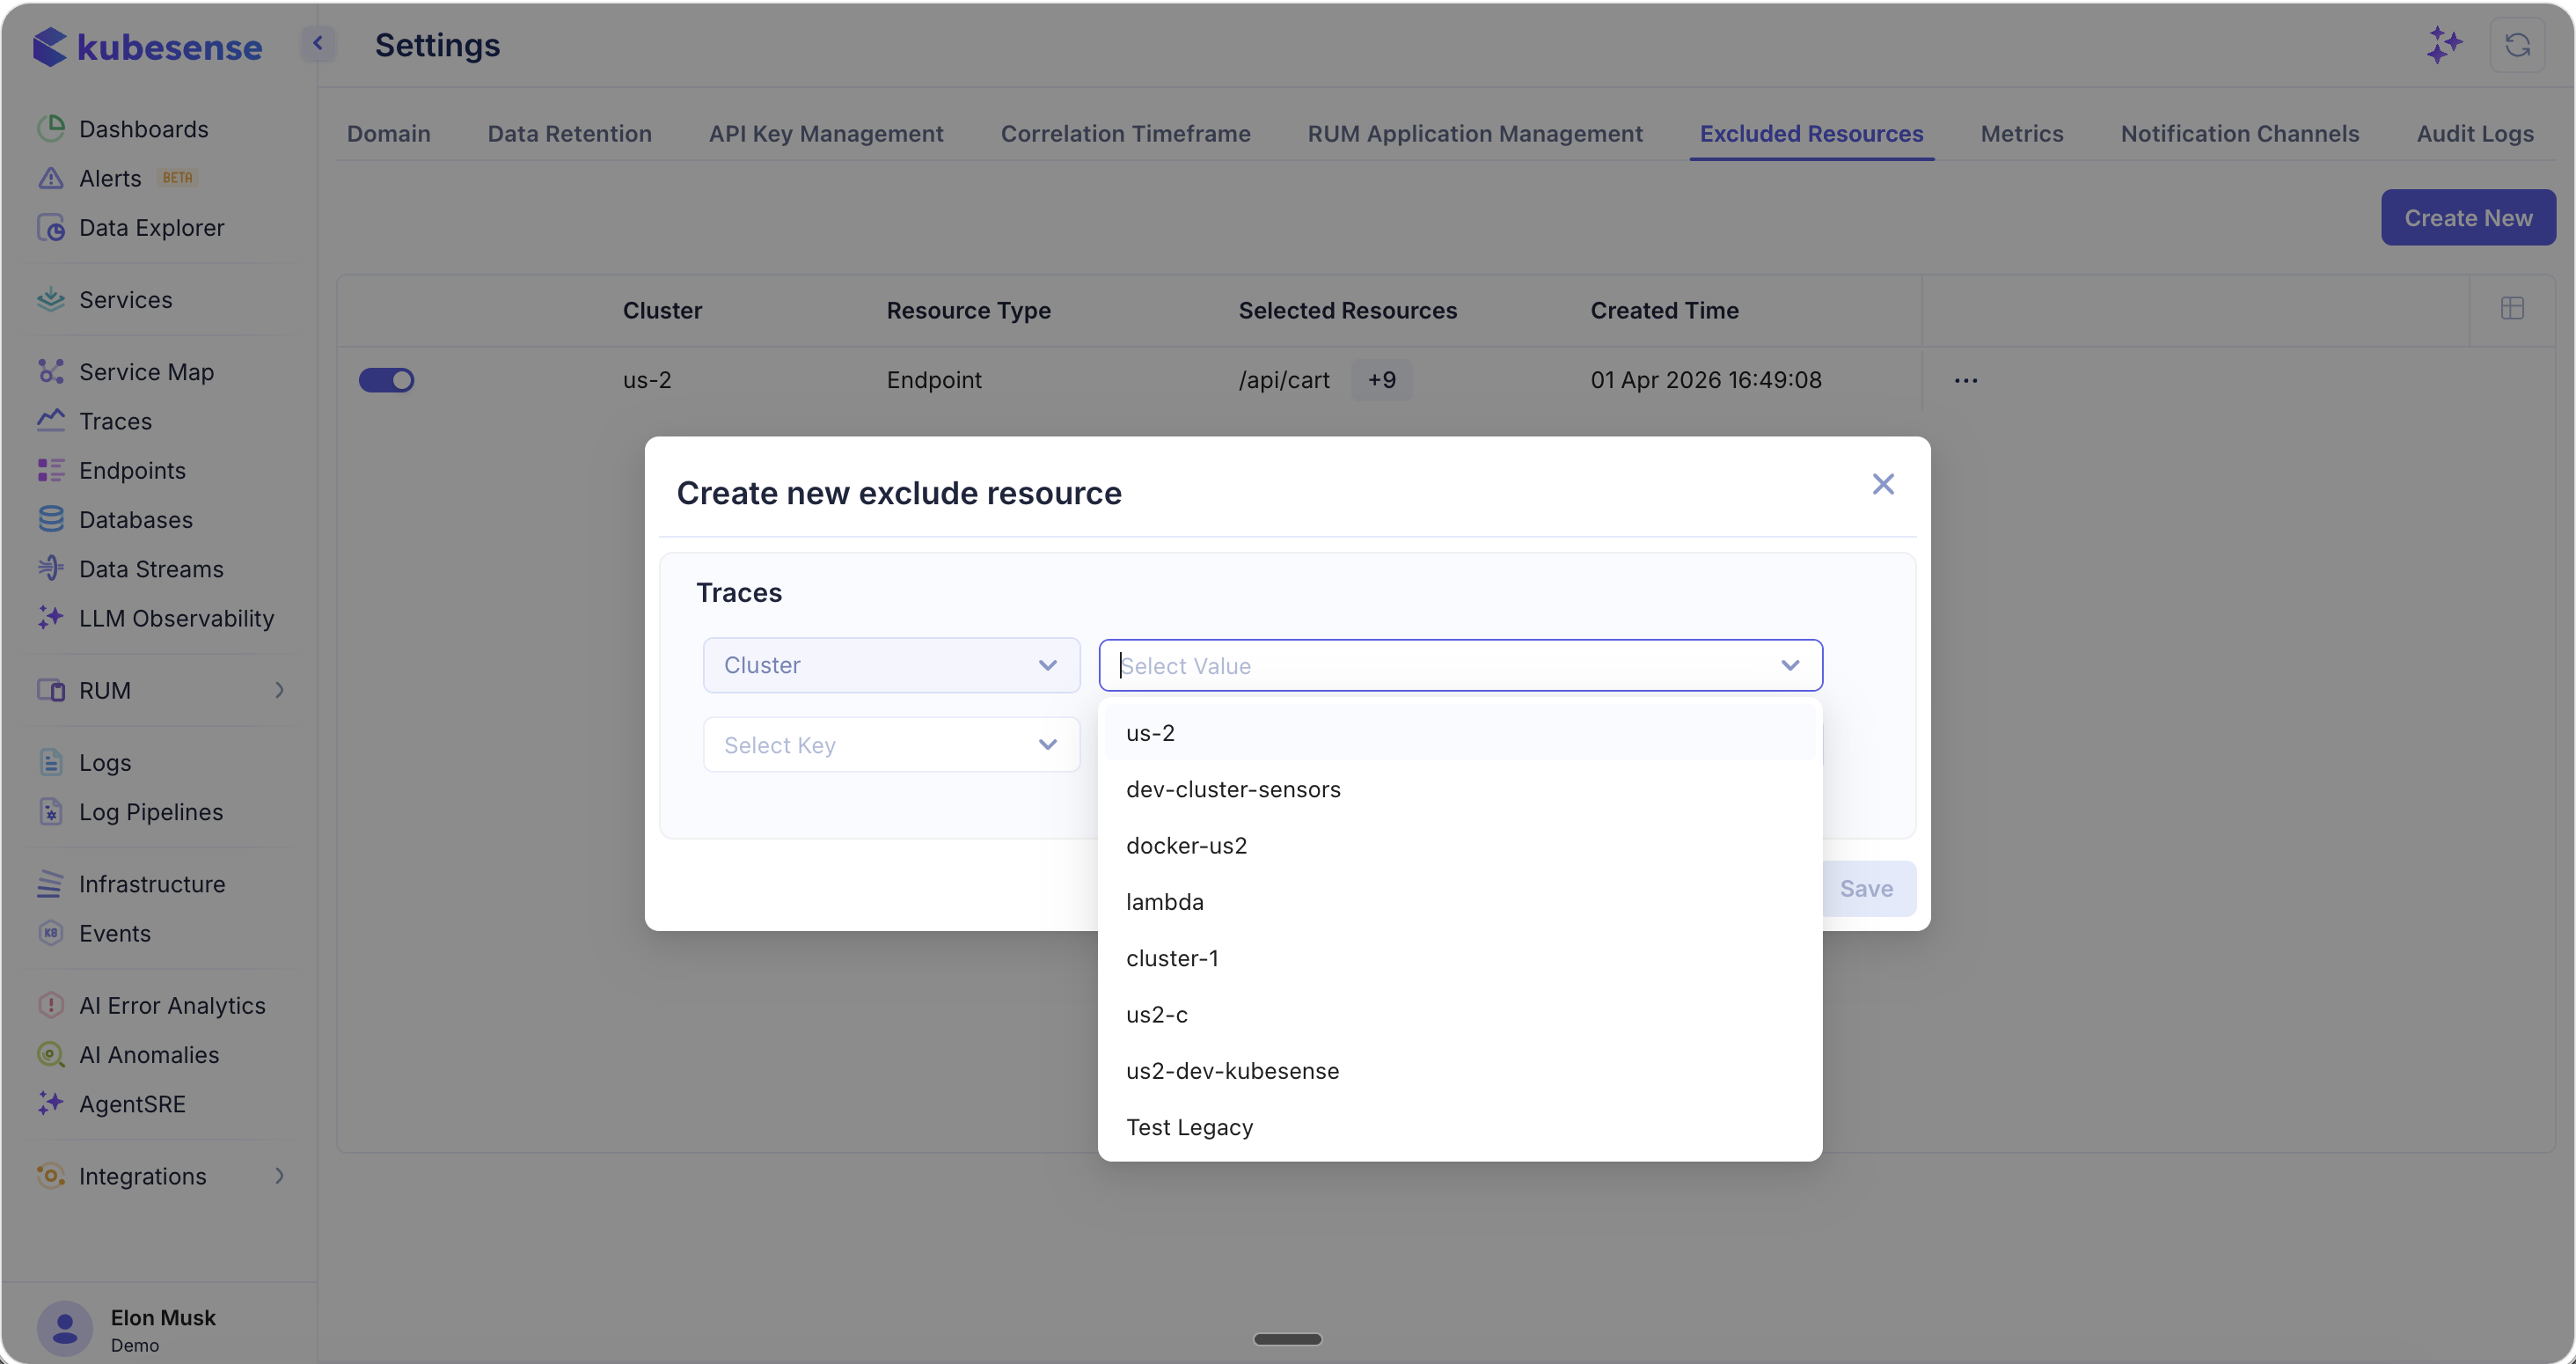
The dialog lets you:
- Select the Cluster from the dropdown (e.g., us-2, dev-cluster-sensors, docker-us2, lambda)
- Choose the Resource Type (e.g., Endpoint)
- Select the specific resources to exclude (e.g., specific API paths or service endpoints)
- Click Save to apply the exclusion
Excluding Directly from the Endpoints Page
You can also exclude endpoints directly from the Endpoints page without navigating to Settings. Each endpoint row has an Exclude button that lets you add it to the exclusion list in one click.
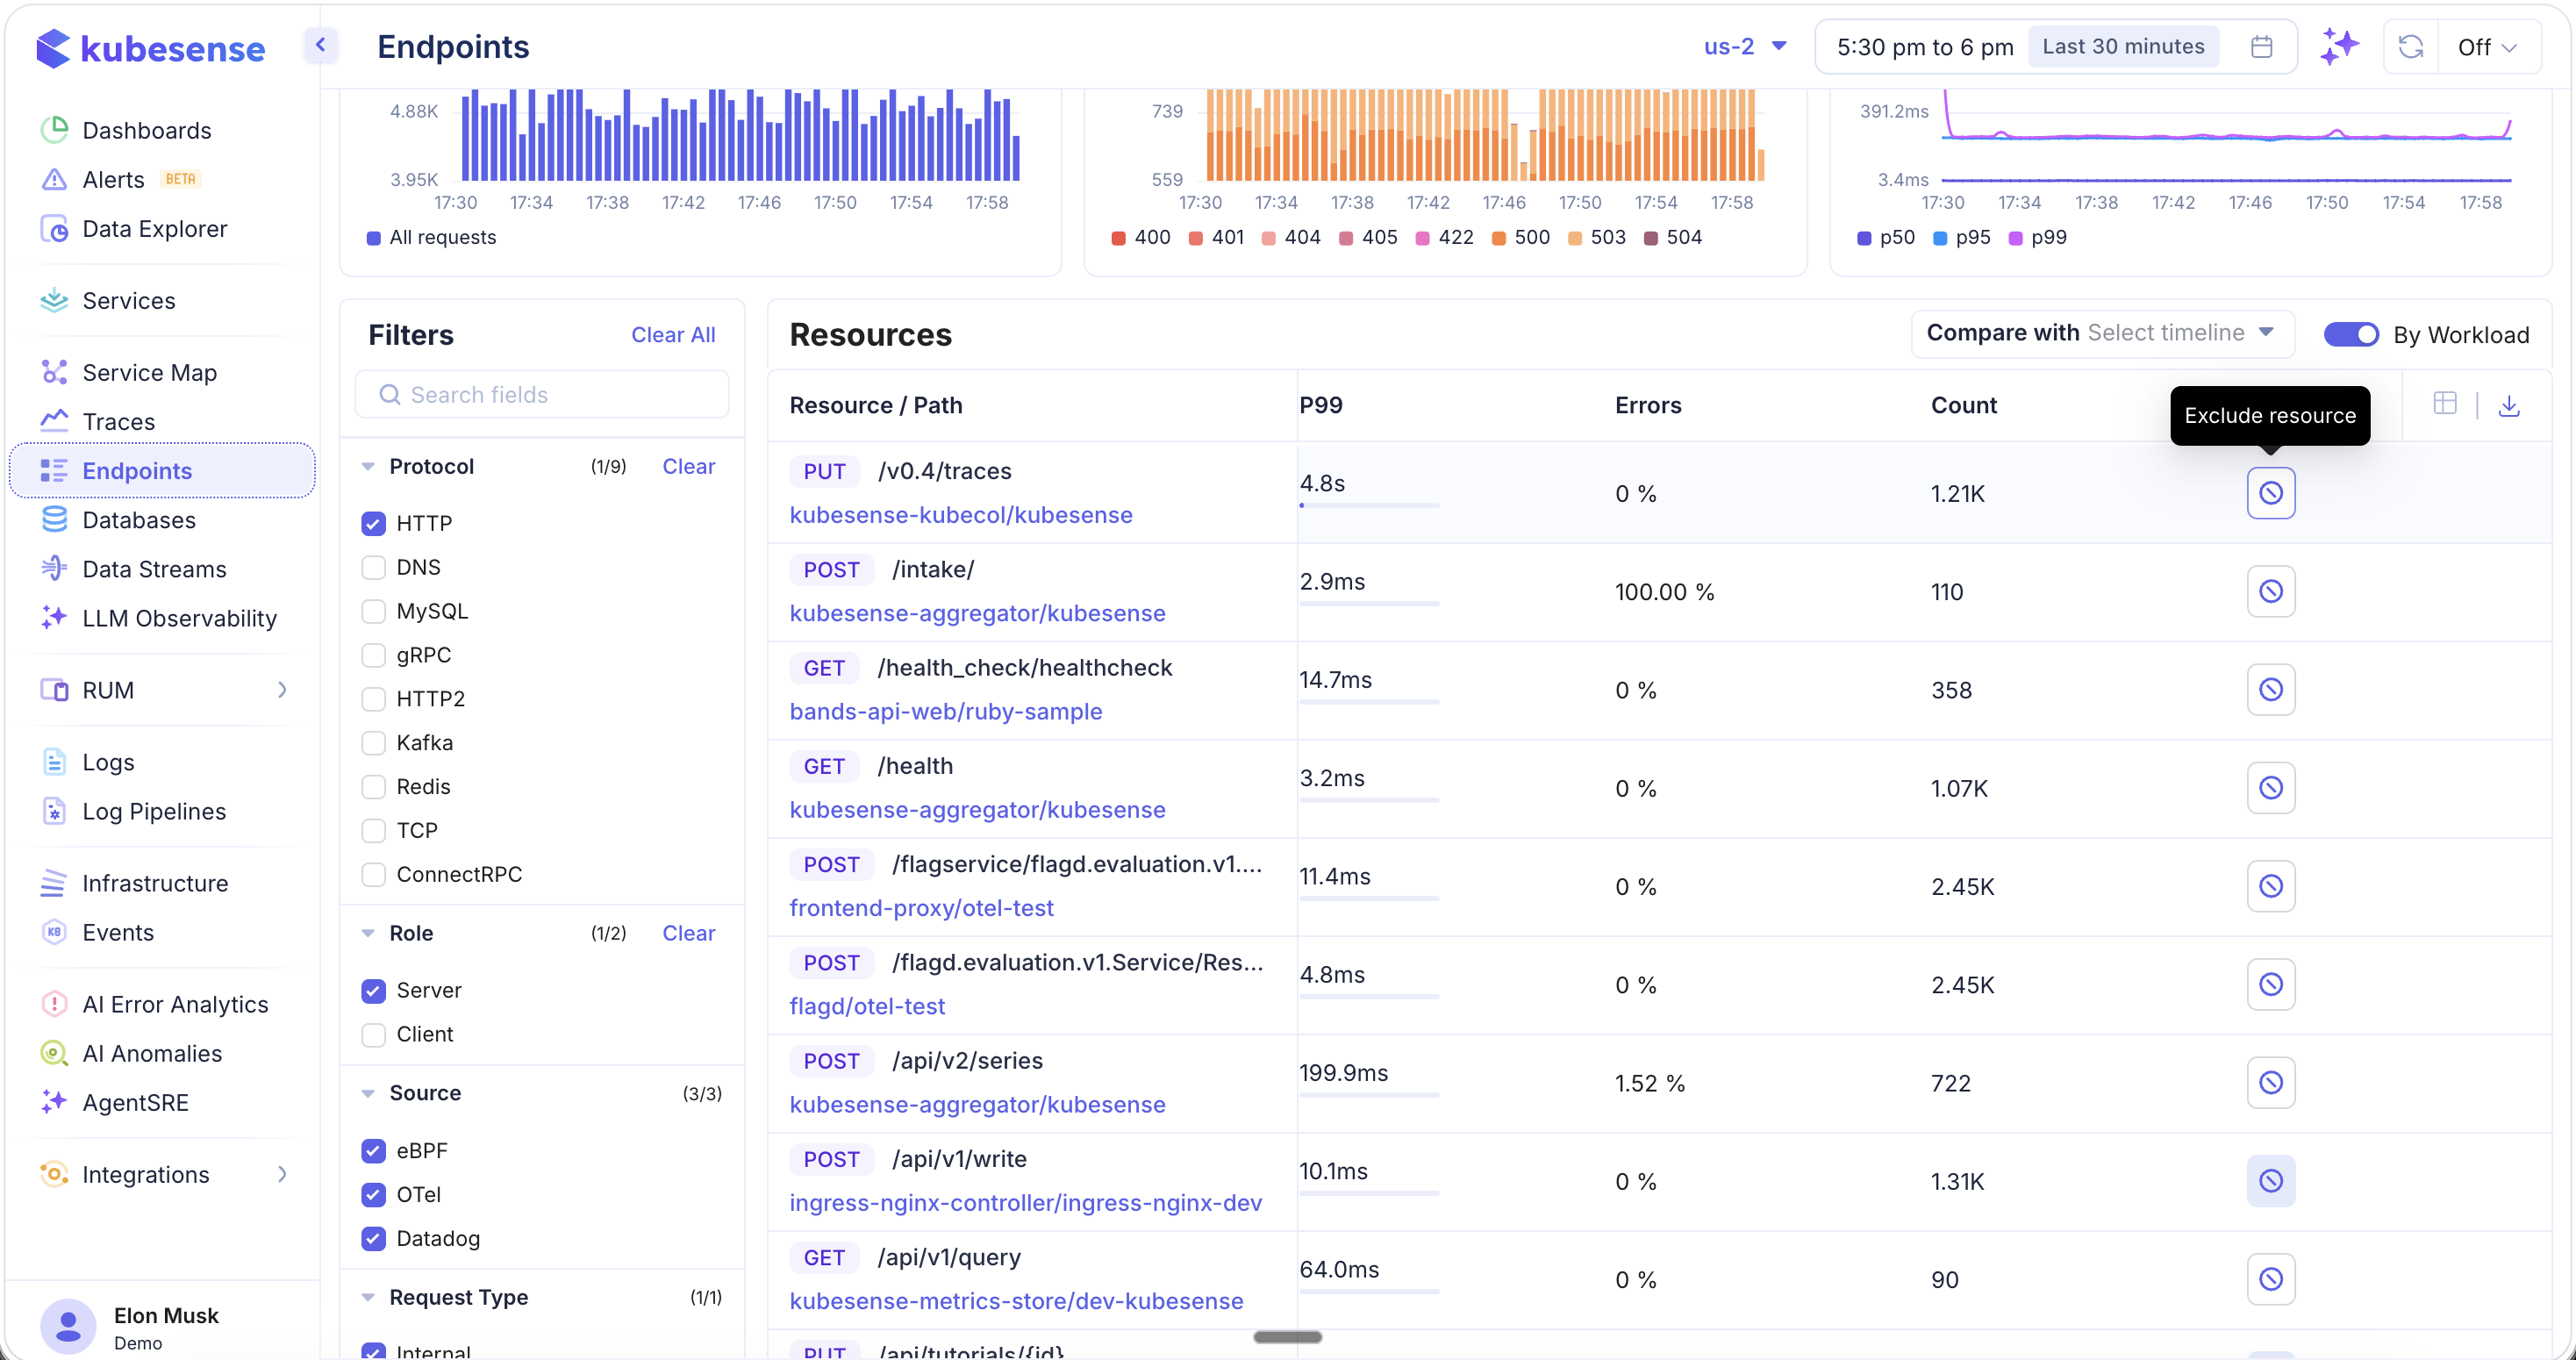
Clicking the exclude button opens the same exclusion dialog, pre-populated with the selected endpoint's details. You can add multiple endpoints to a single exclusion rule.
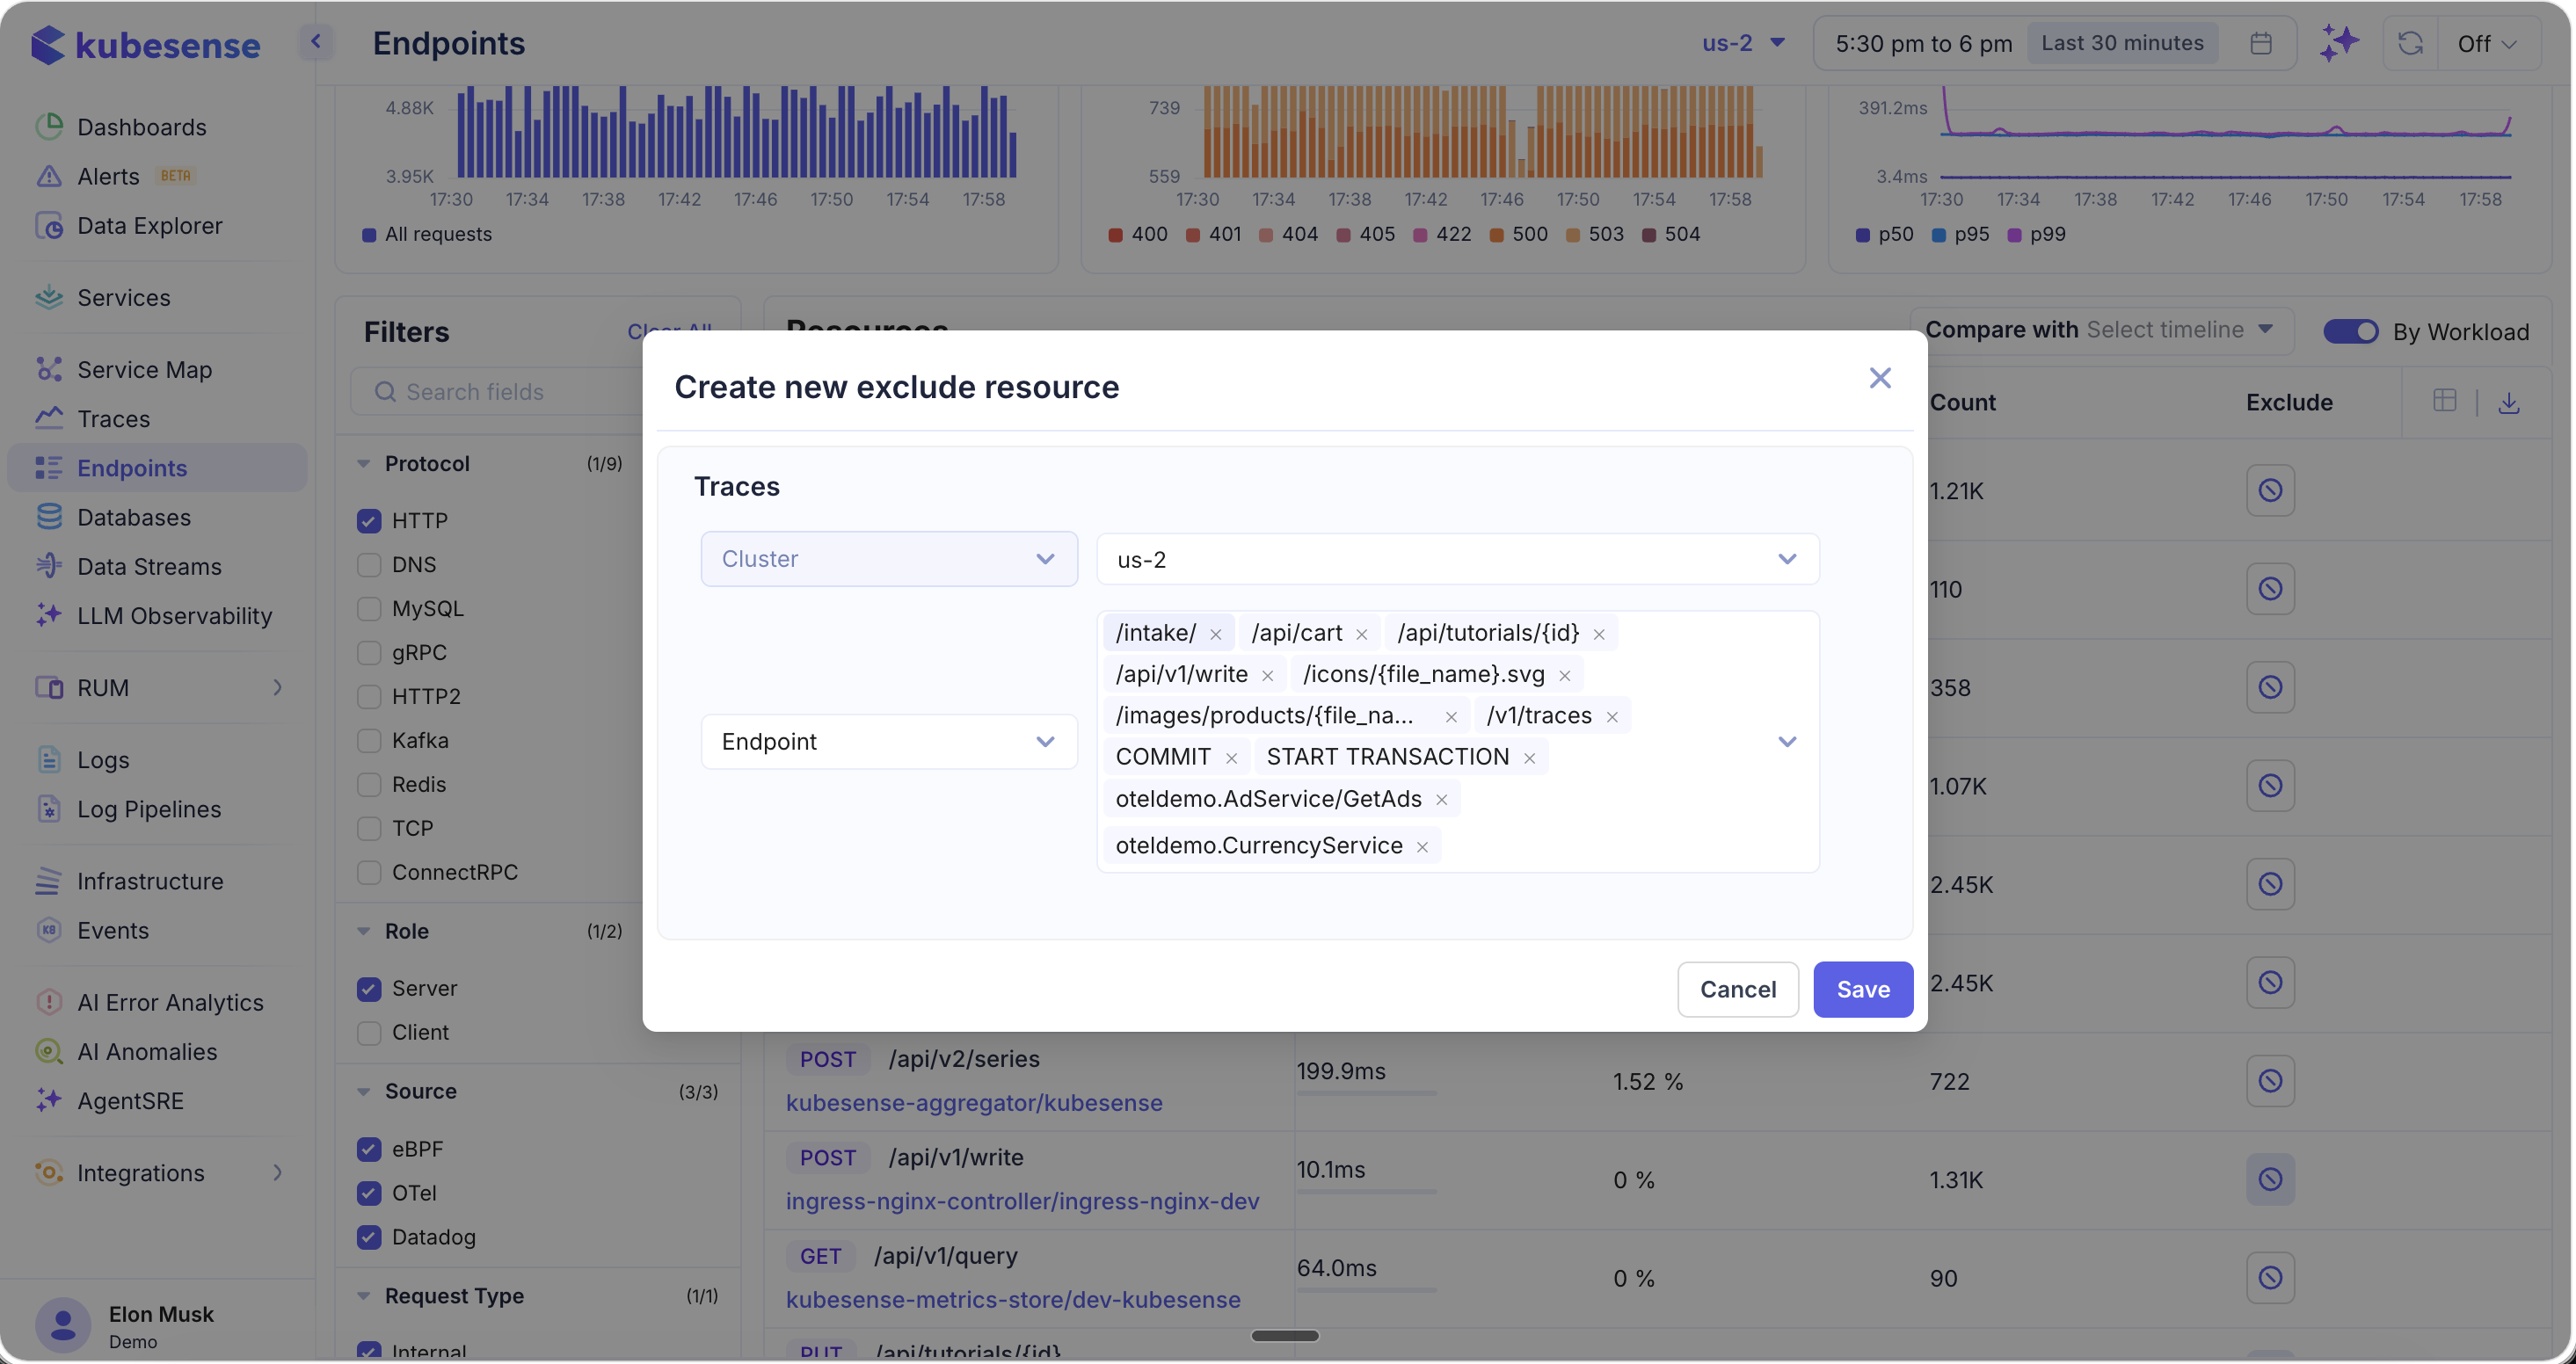
Select the cluster, choose the resource type (Endpoint), add the paths you want to exclude, and click Save. The excluded endpoints will immediately stop appearing in your monitoring views.
Metrics
The Metrics tab provides visibility into your metrics storage usage, ingestion rates, and cardinality.
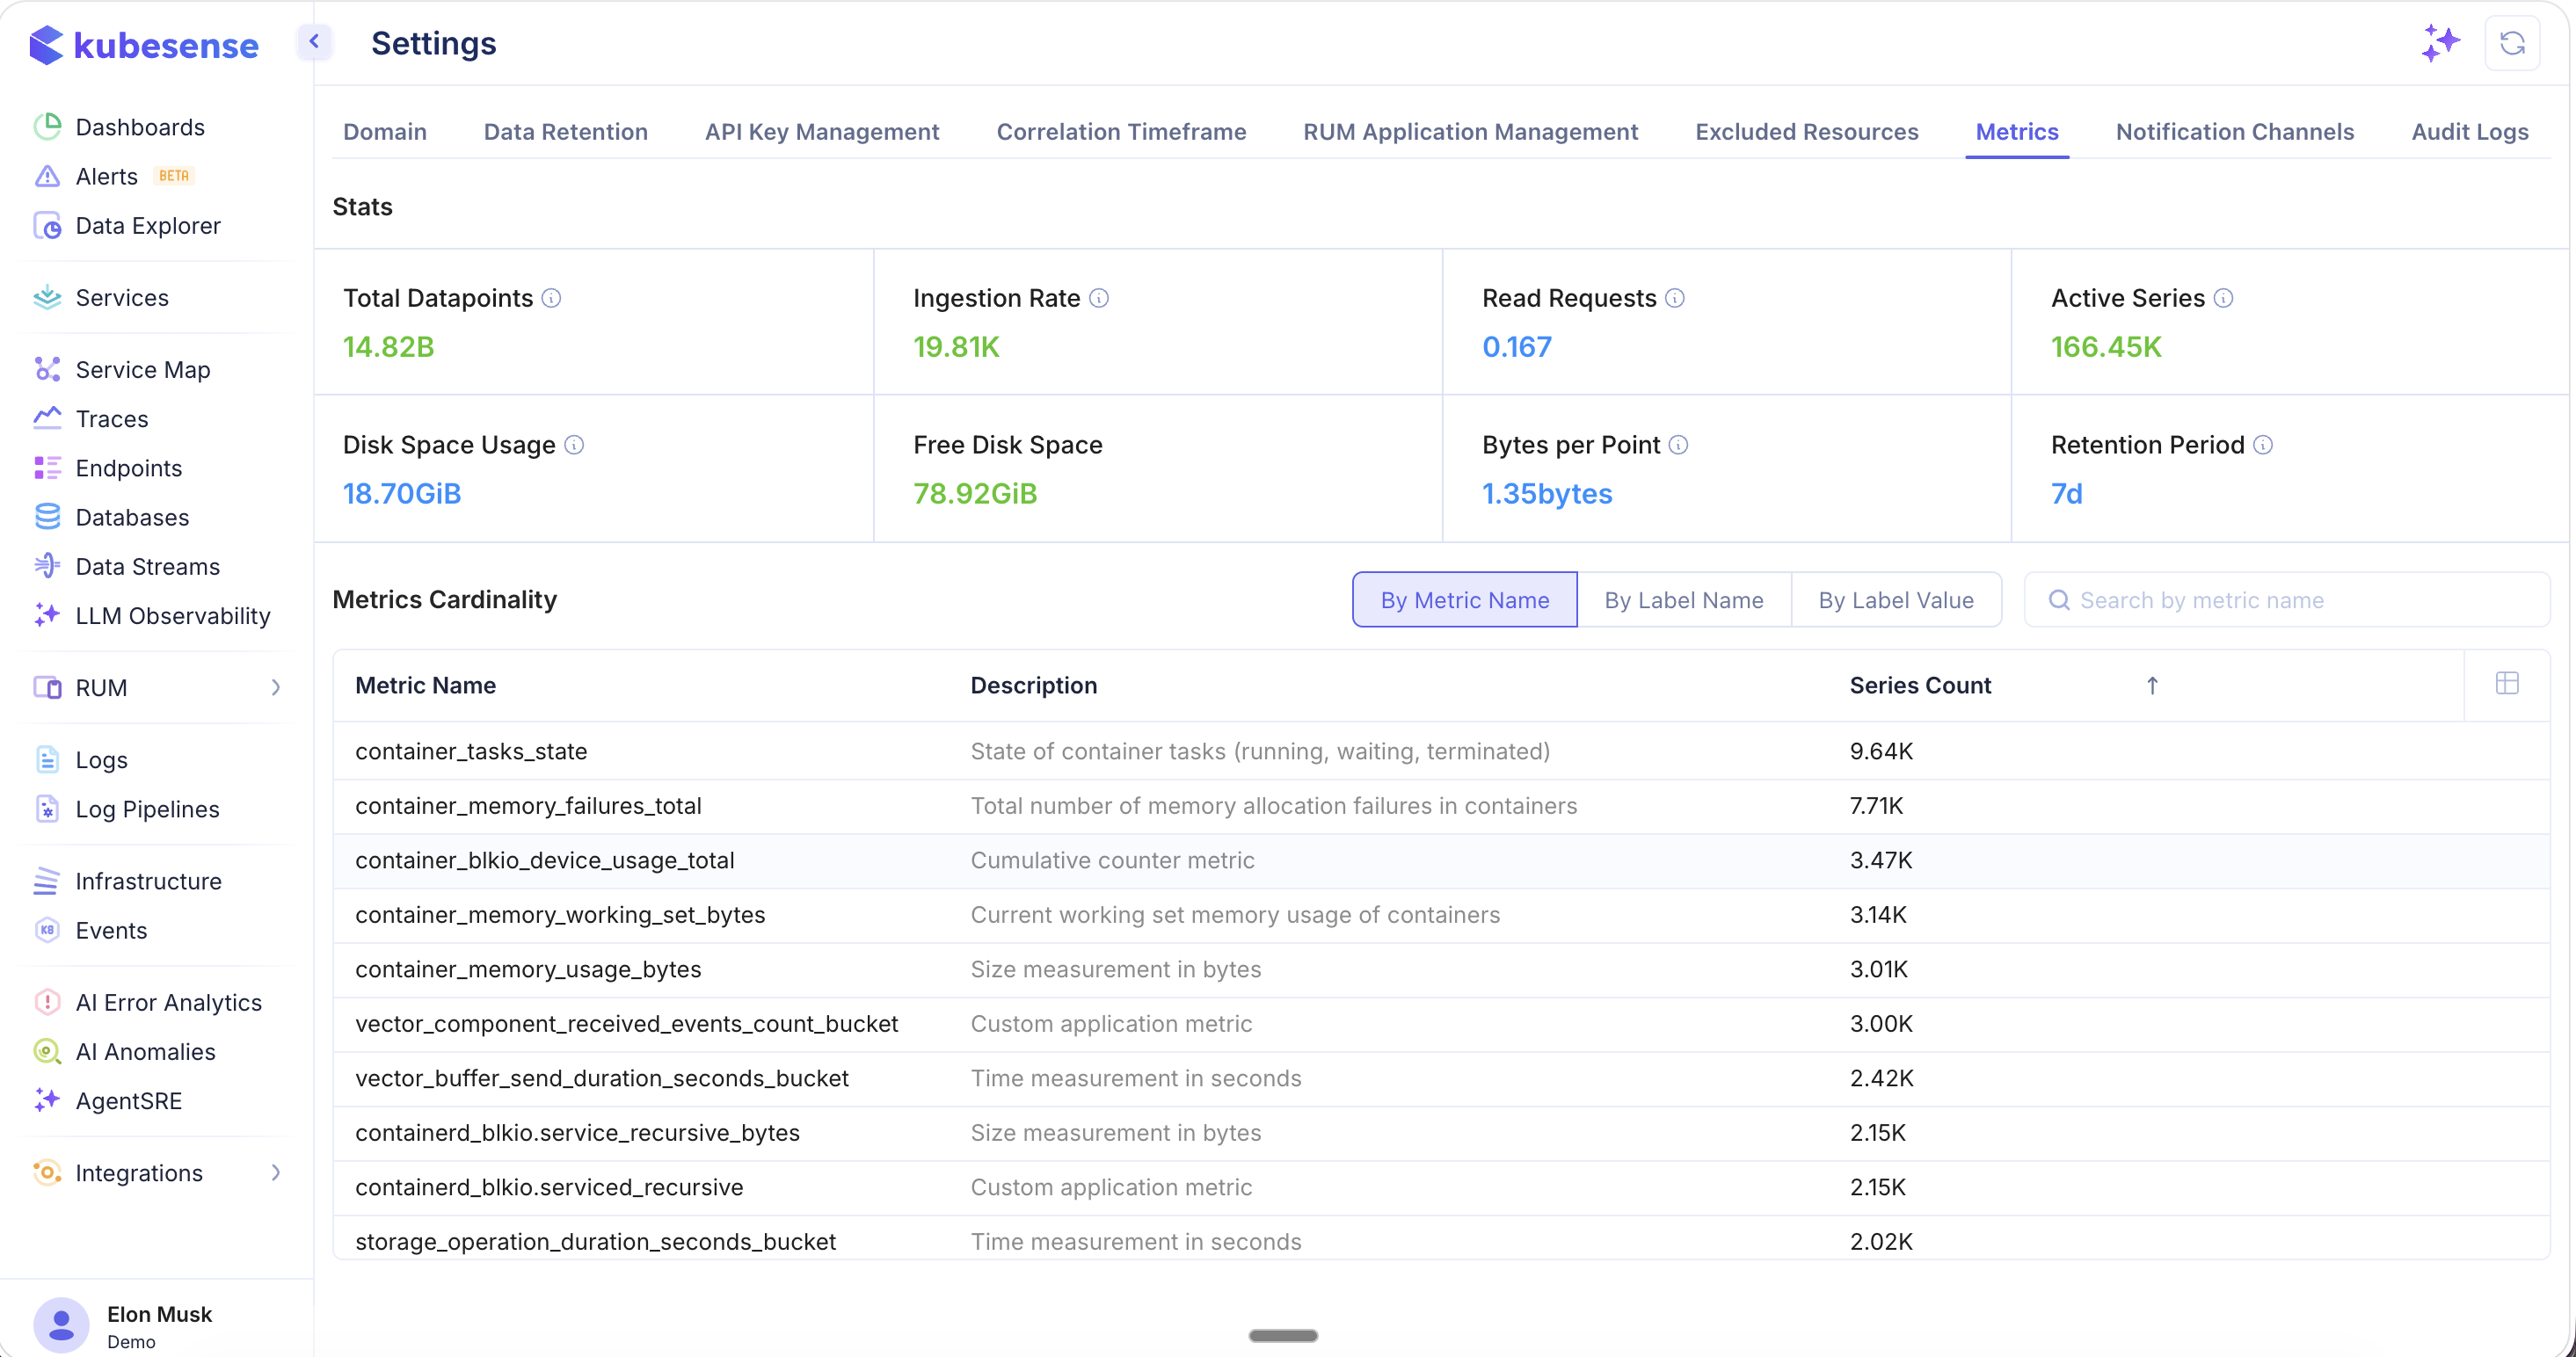
Stats
The top section shows key metrics storage statistics:
| Stat | Description |
|---|---|
| Total Datapoints | The total number of metric data points stored (e.g., 14.82B) |
| Ingestion Rate | Current rate of metric data points being ingested (e.g., 19.81K per second) |
| Read Requests | Current rate of metric read queries (e.g., 0.167 per second) |
| Active Series | The number of currently active time series (e.g., 166.45K) |
| Disk Space Usage | Total disk space consumed by metrics (e.g., 18.70 GiB) |
| Free Disk Space | Available disk space remaining (e.g., 78.92 GiB) |
| Bytes per Point | Average storage cost per data point (e.g., 1.35 bytes) |
| Retention Period | How long metrics are retained (e.g., 7d) |
Metrics Cardinality
The cardinality table helps you understand which metrics, labels, or label values are contributing the most to your active series count. This is critical for managing metrics costs and performance.
Browse cardinality by:
- By Metric Name — See each metric with its description and series count, sorted by highest cardinality
- By Label Name — Identify labels that create the most series (e.g., high-cardinality labels like
pod_nameorcontainer_id) - By Label Value — Find specific label values driving cardinality
Use the search bar to filter by metric name and the column picker to customize the view.
Notification Channels
Configure where alert notifications are delivered. KubeSense supports multiple channel types including Slack, Microsoft Teams, and Webhooks.
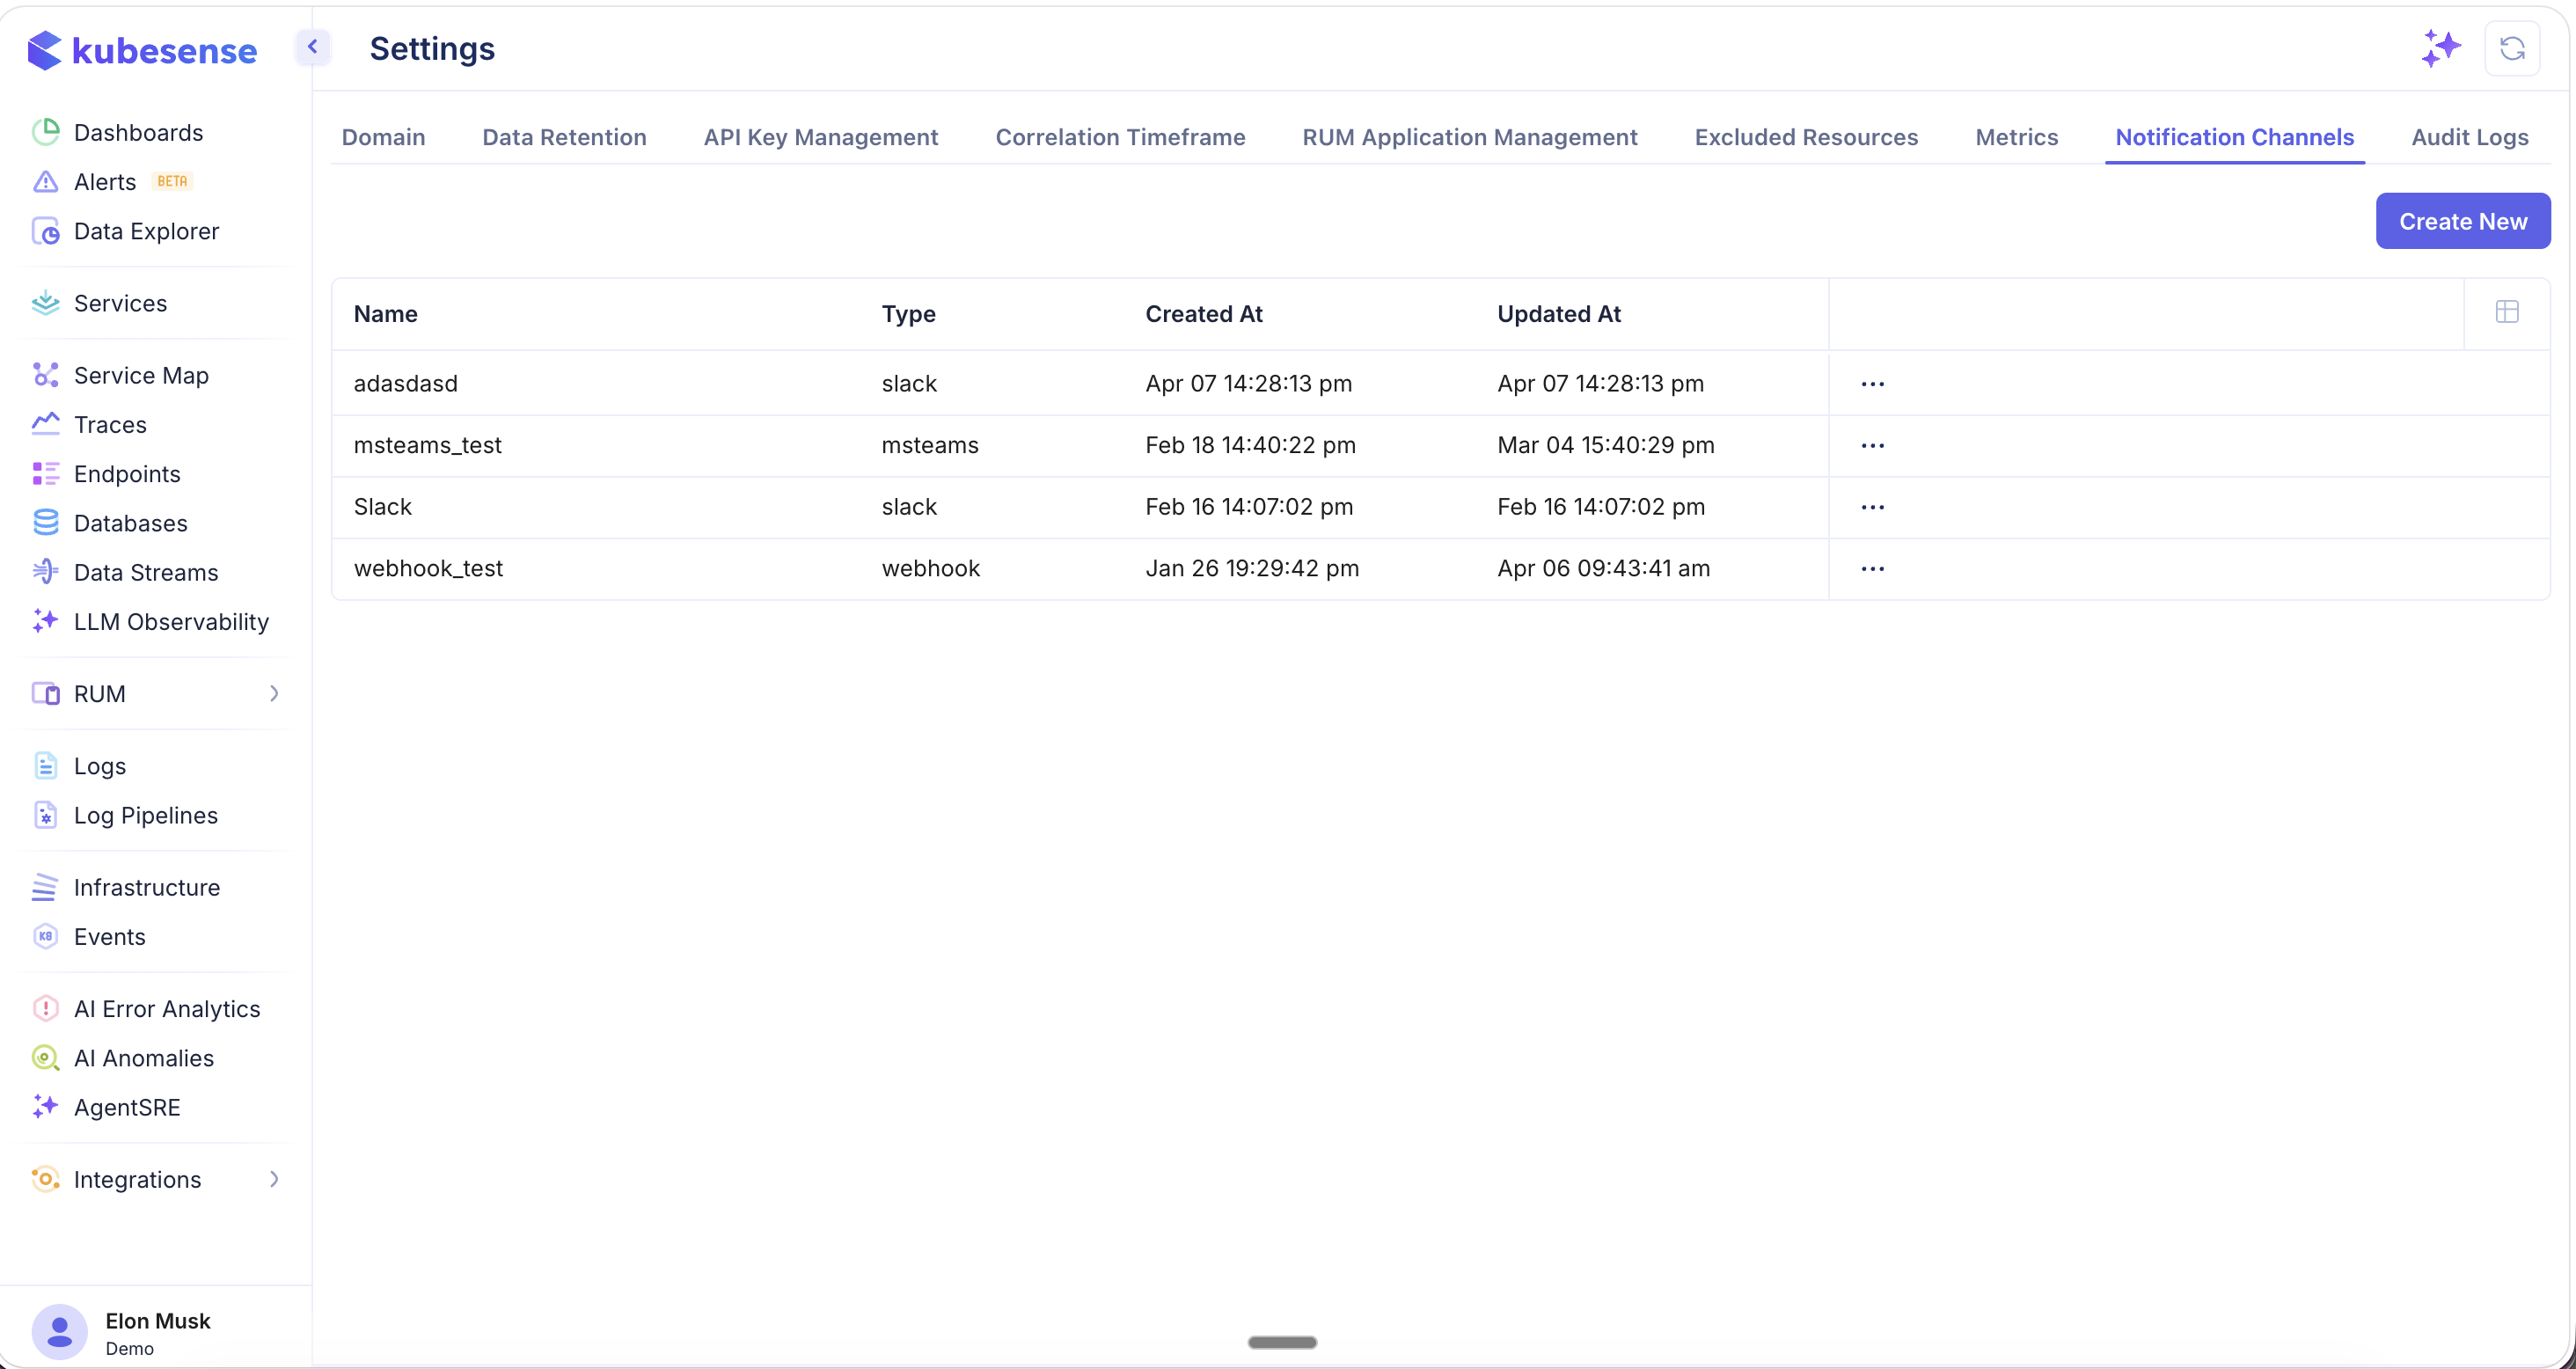
The notification channels list shows all configured channels with:
| Column | Description |
|---|---|
| Name | The channel name |
| Type | The channel type — slack, msteams, or webhook |
| Created At | When the channel was created |
| Updated At | When the channel was last modified |
Use the ... menu on each channel to edit or delete it.
Creating a New Notification Channel
Click Create New to add a notification channel.
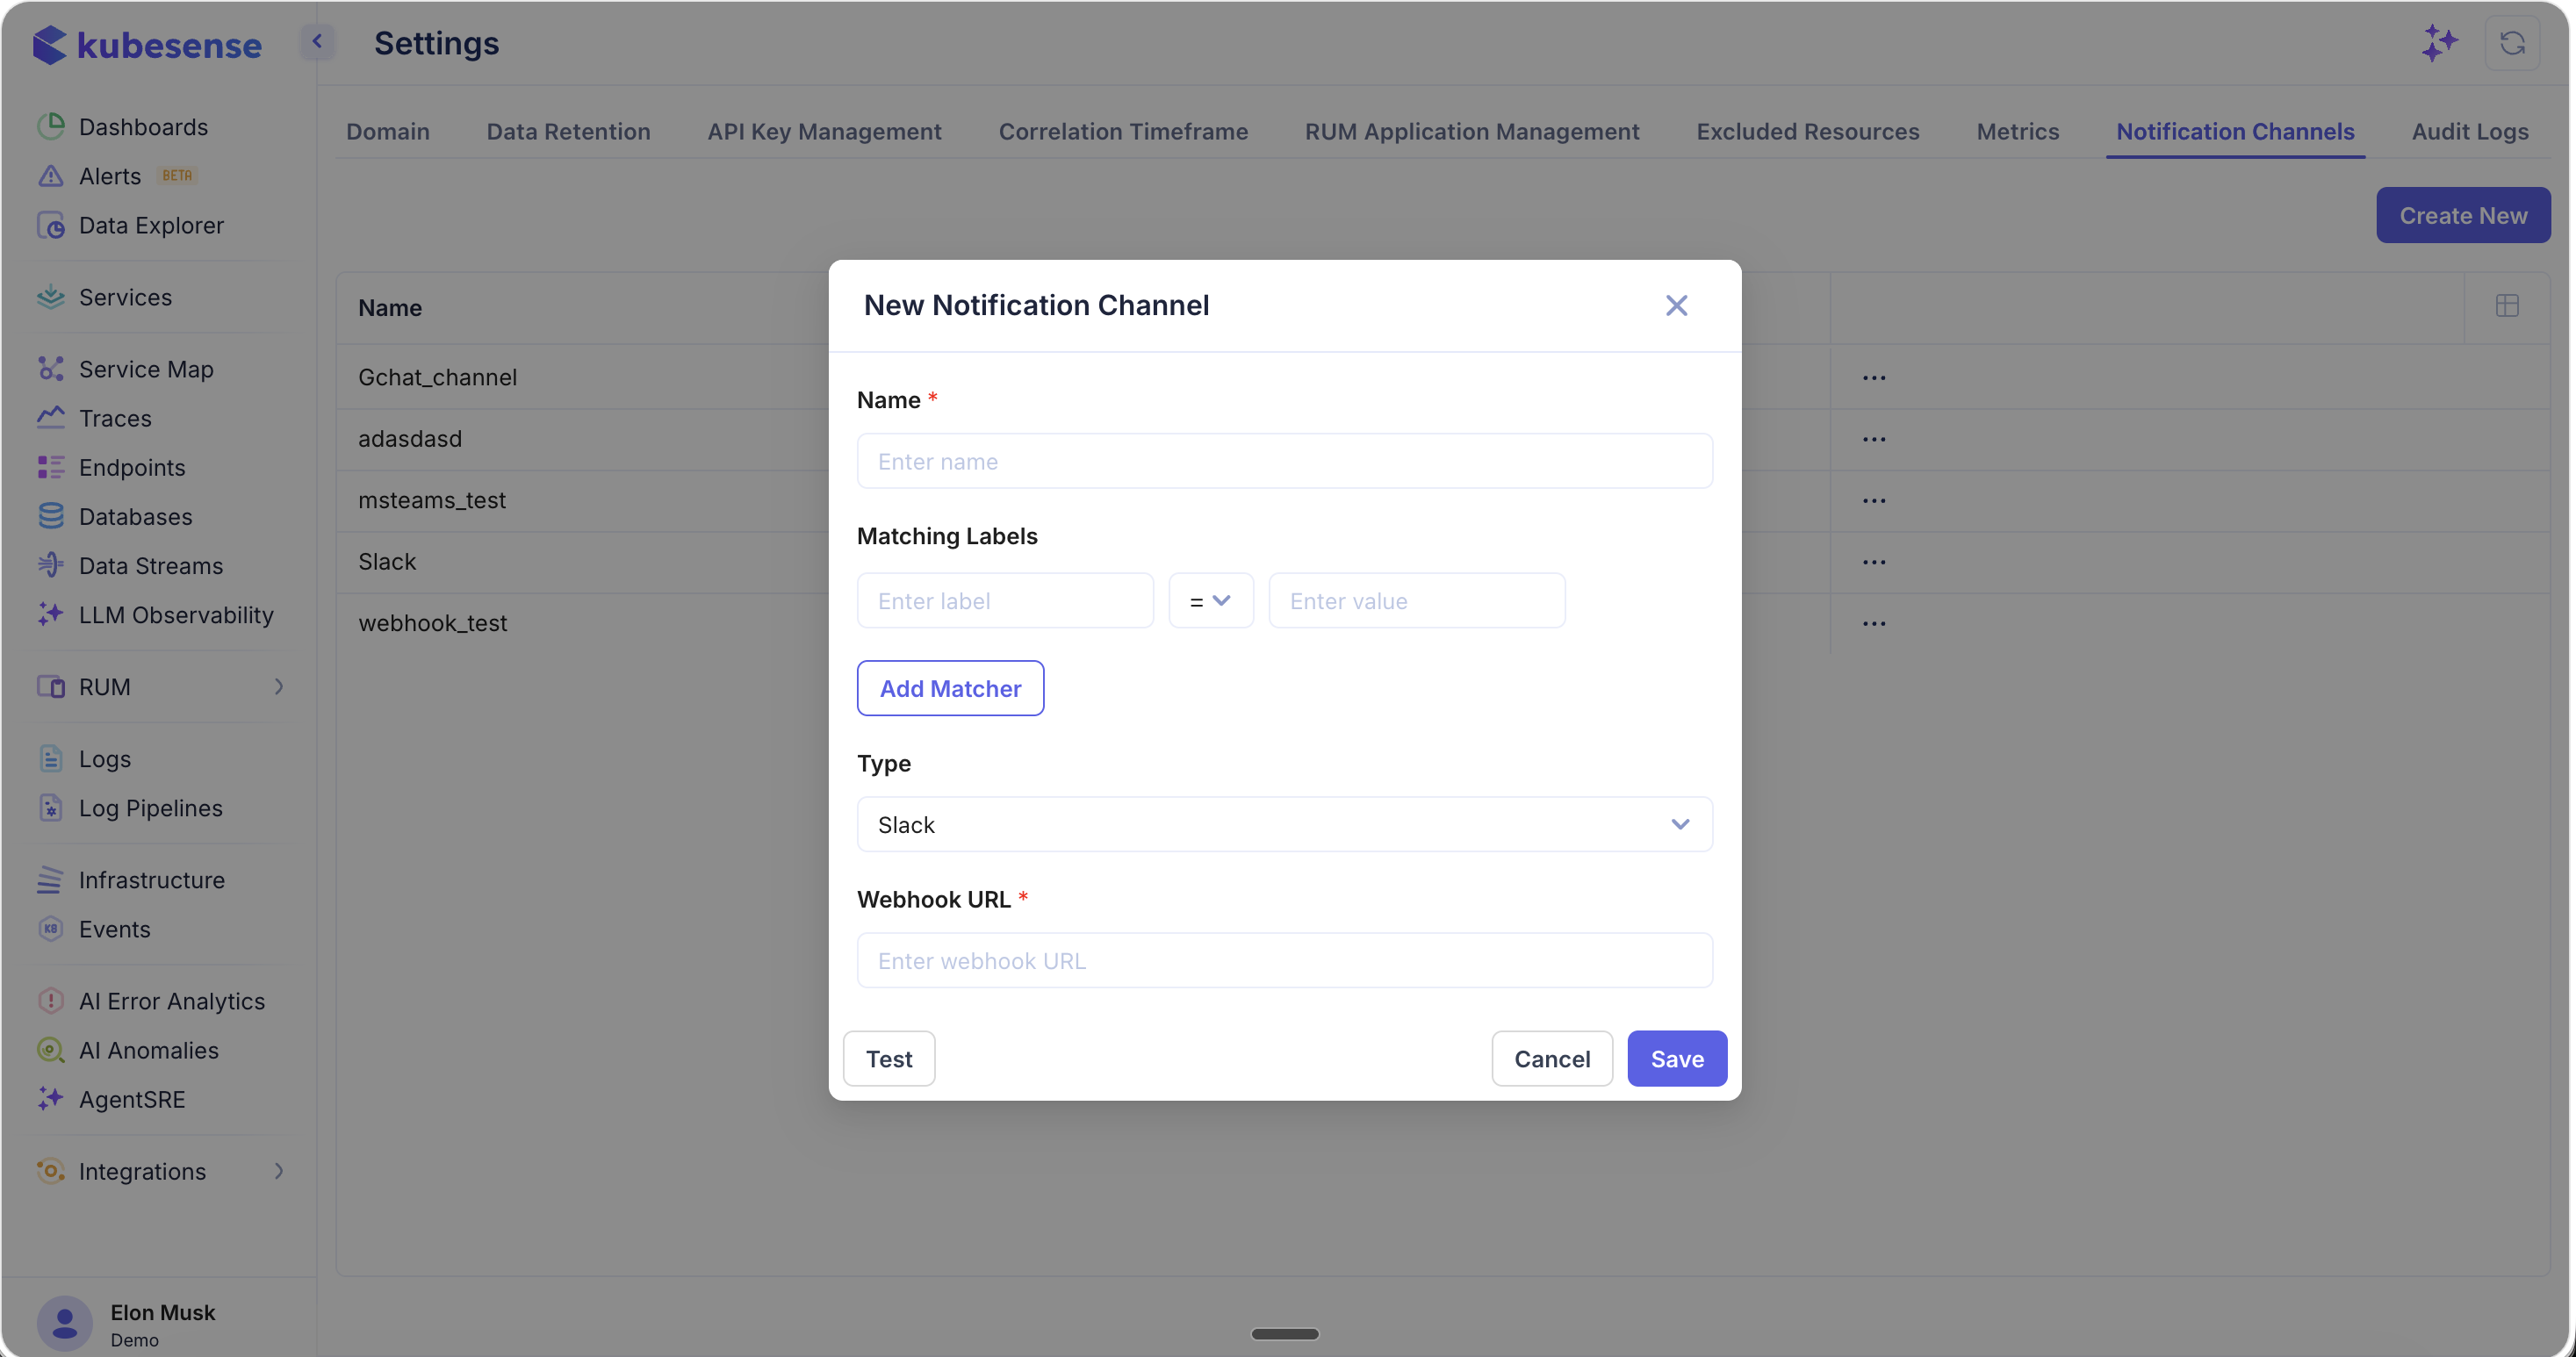
Configure the following:
- Name — A descriptive name for the channel (required)
- Matching Labels — Optional label matchers to route specific alerts to this channel. Add matchers with label, operator (
=), and value to filter which alerts are sent here. - Type — Select the channel type: Slack, Microsoft Teams, or Webhook
- Webhook URL — The incoming webhook URL for the selected channel type (required)
Use the Test button to send a test notification and verify the channel is configured correctly before saving. Click Save to create the channel.