AI Error Analytics
AI Error Analytics automatically groups, classifies, and tracks errors across your services, providing a centralized view of all recorded incidents.
Overview
Instead of manually sifting through logs and traces to find errors, AI Error Analytics automatically detects error patterns and groups them into distinct issues. Each issue shows the error type, affected services, and trend over time.
Incident Timeline
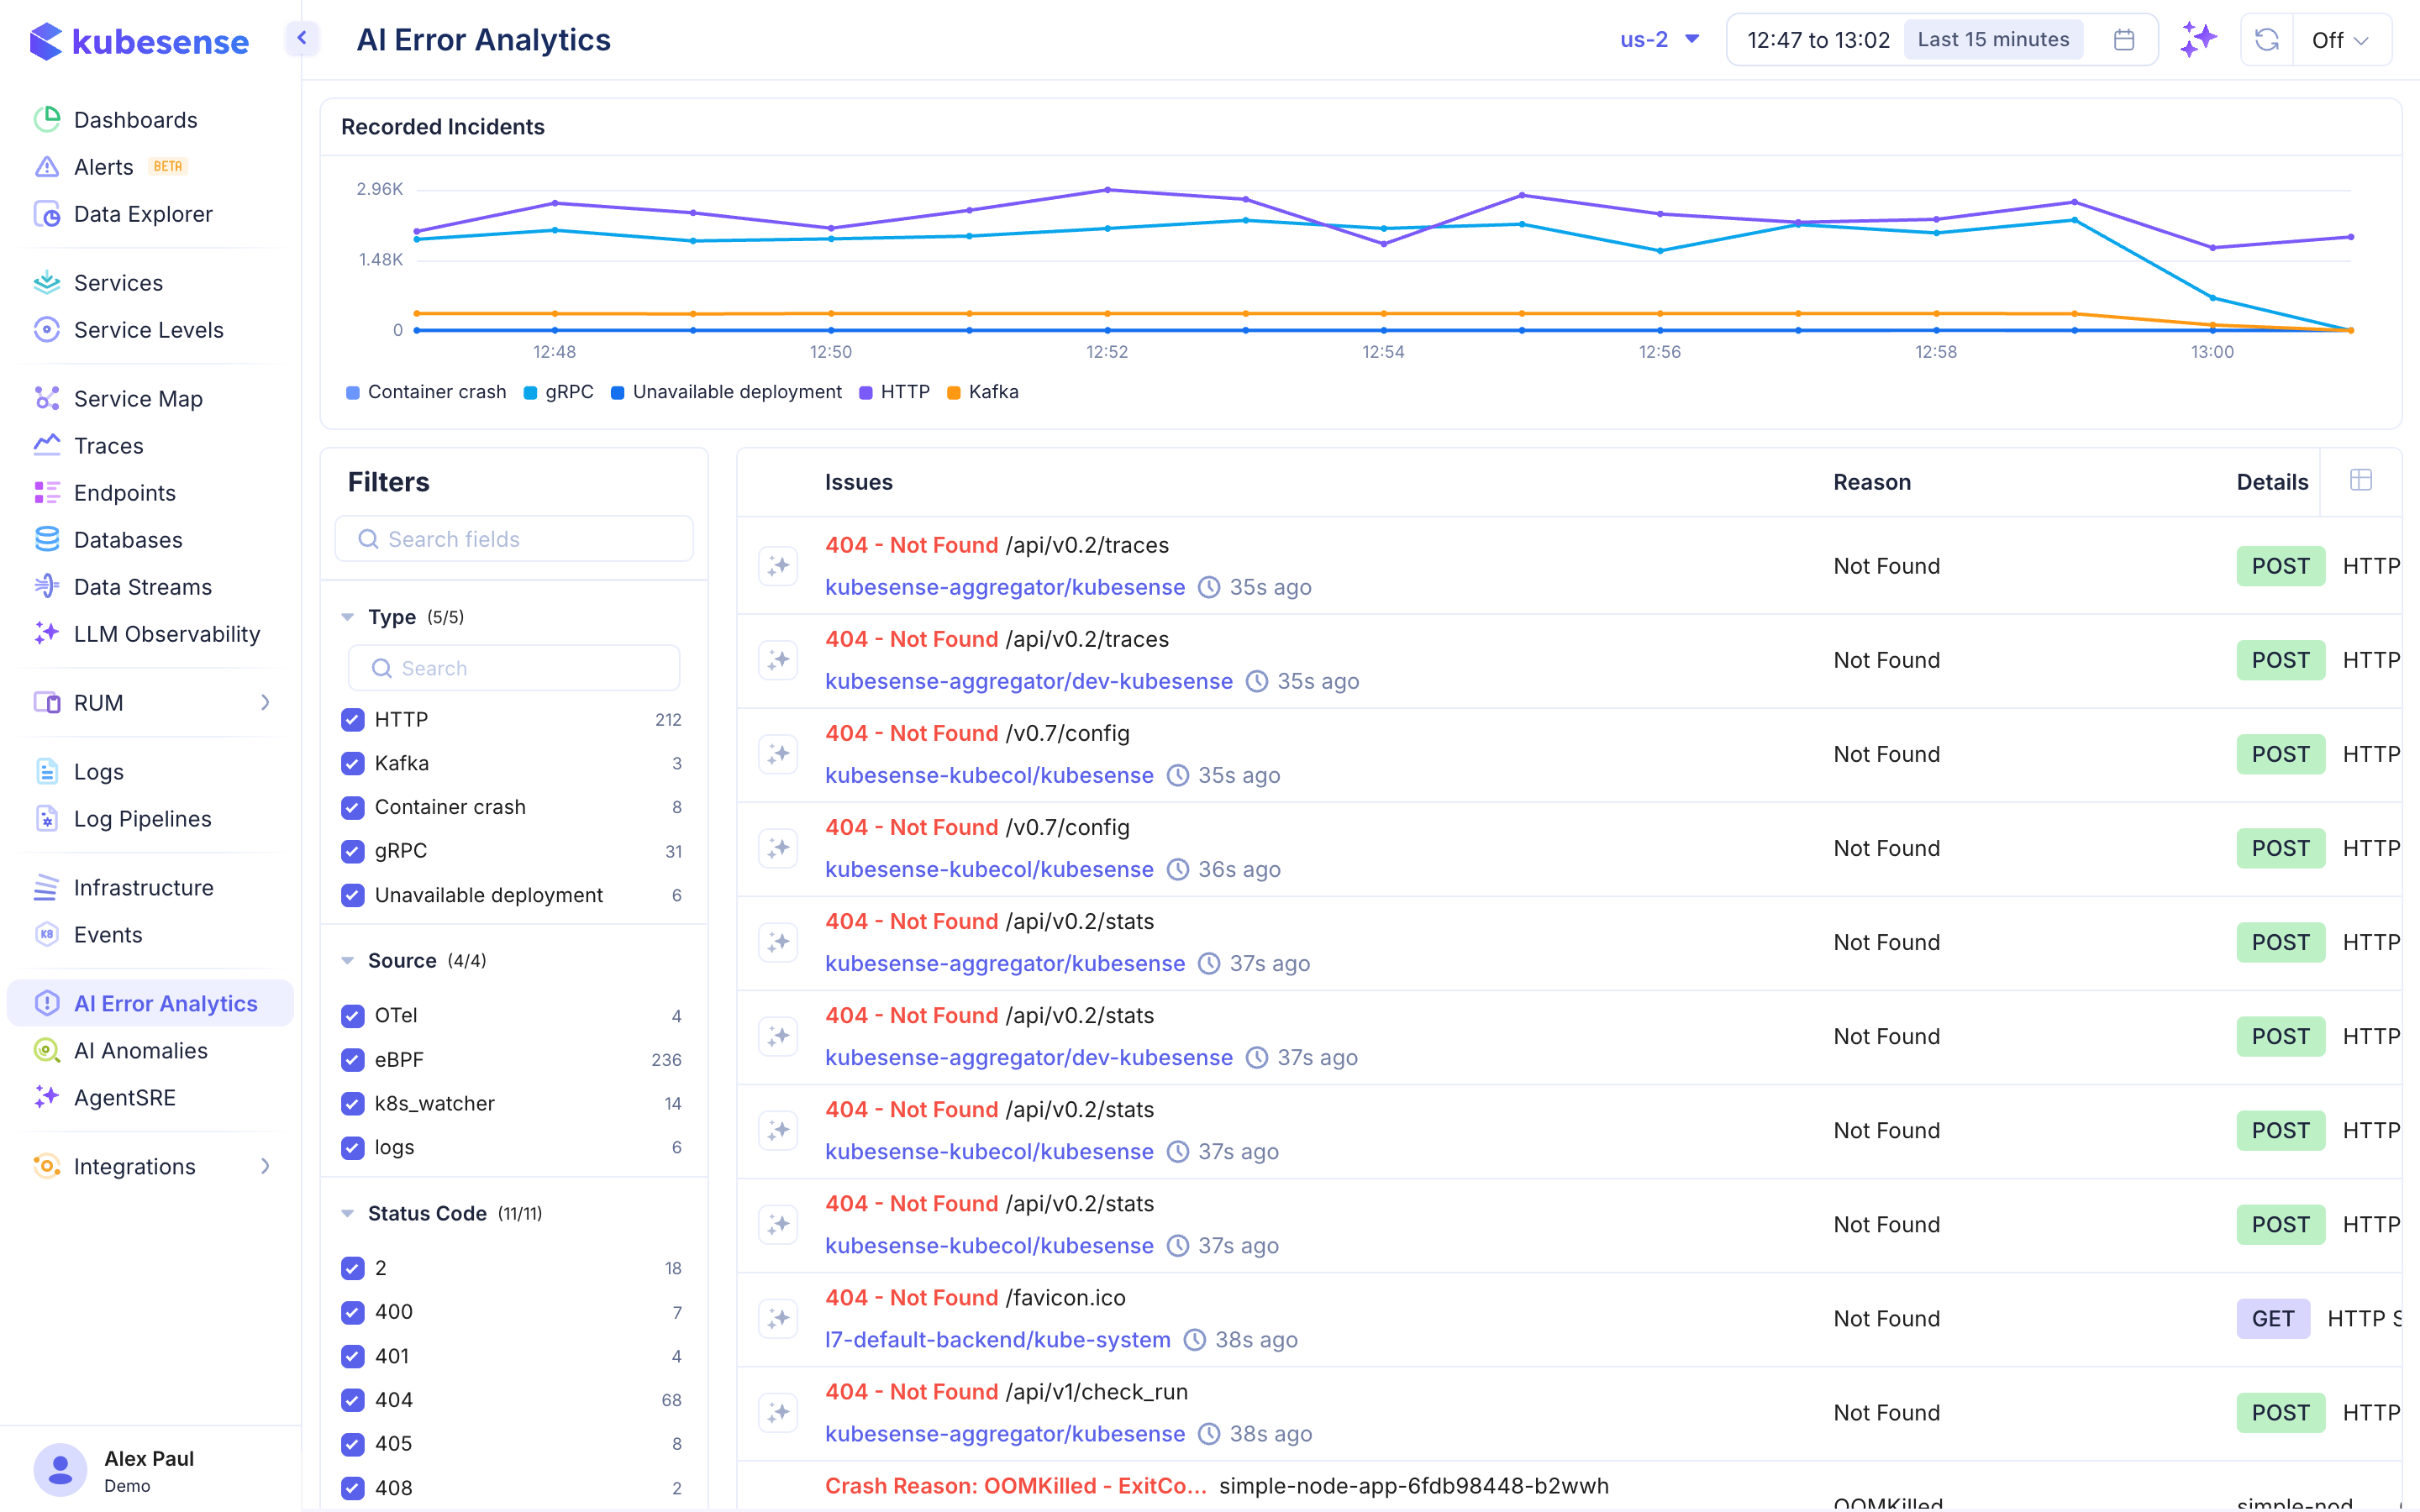
The top of the page shows a time-series chart of Recorded Incidents with color-coded categories:
- Container crash — Pod/container crash events
- gRPC — gRPC protocol errors
- Unreachable deployment — Services that cannot be reached
- HTTP — HTTP protocol errors
- Kafka — Kafka message processing errors
Issues Table
Each issue row displays:
| Column | Description |
|---|---|
| Issue | Error description (e.g., "404 - Not Found /api/v2/traces") |
| Service | The affected service/workload |
| Time | When the error was last seen (e.g., "35s ago") |
| Reason | Root cause classification (e.g., "Not Found") |
| Details | Protocol and HTTP method (e.g., "POST HTTP") |
Filters
The left panel provides filtering by:
Type
- HTTP — HTTP protocol errors
- Kafka — Kafka processing errors
- Container crash — Container/pod crash events
- Unreachable deployment — Network reachability issues
Source
- OTel, eBPF, agent, k8s_watcher, logs
Status Code
- Filter by specific HTTP status codes (e.g., 400, 404, 405, 408, 500)
Error Details
Click any issue to see:
- Full error message and stack trace
- Affected services and endpoints
- Error frequency and trend
- Correlated traces and logs
- Crash reason for container crashes (e.g., "OOMKilled - ExitCode: ...")