AI Anomalies
AI Anomalies uses machine learning to automatically detect unusual patterns in your metrics and surface potential issues before they become incidents.
Overview
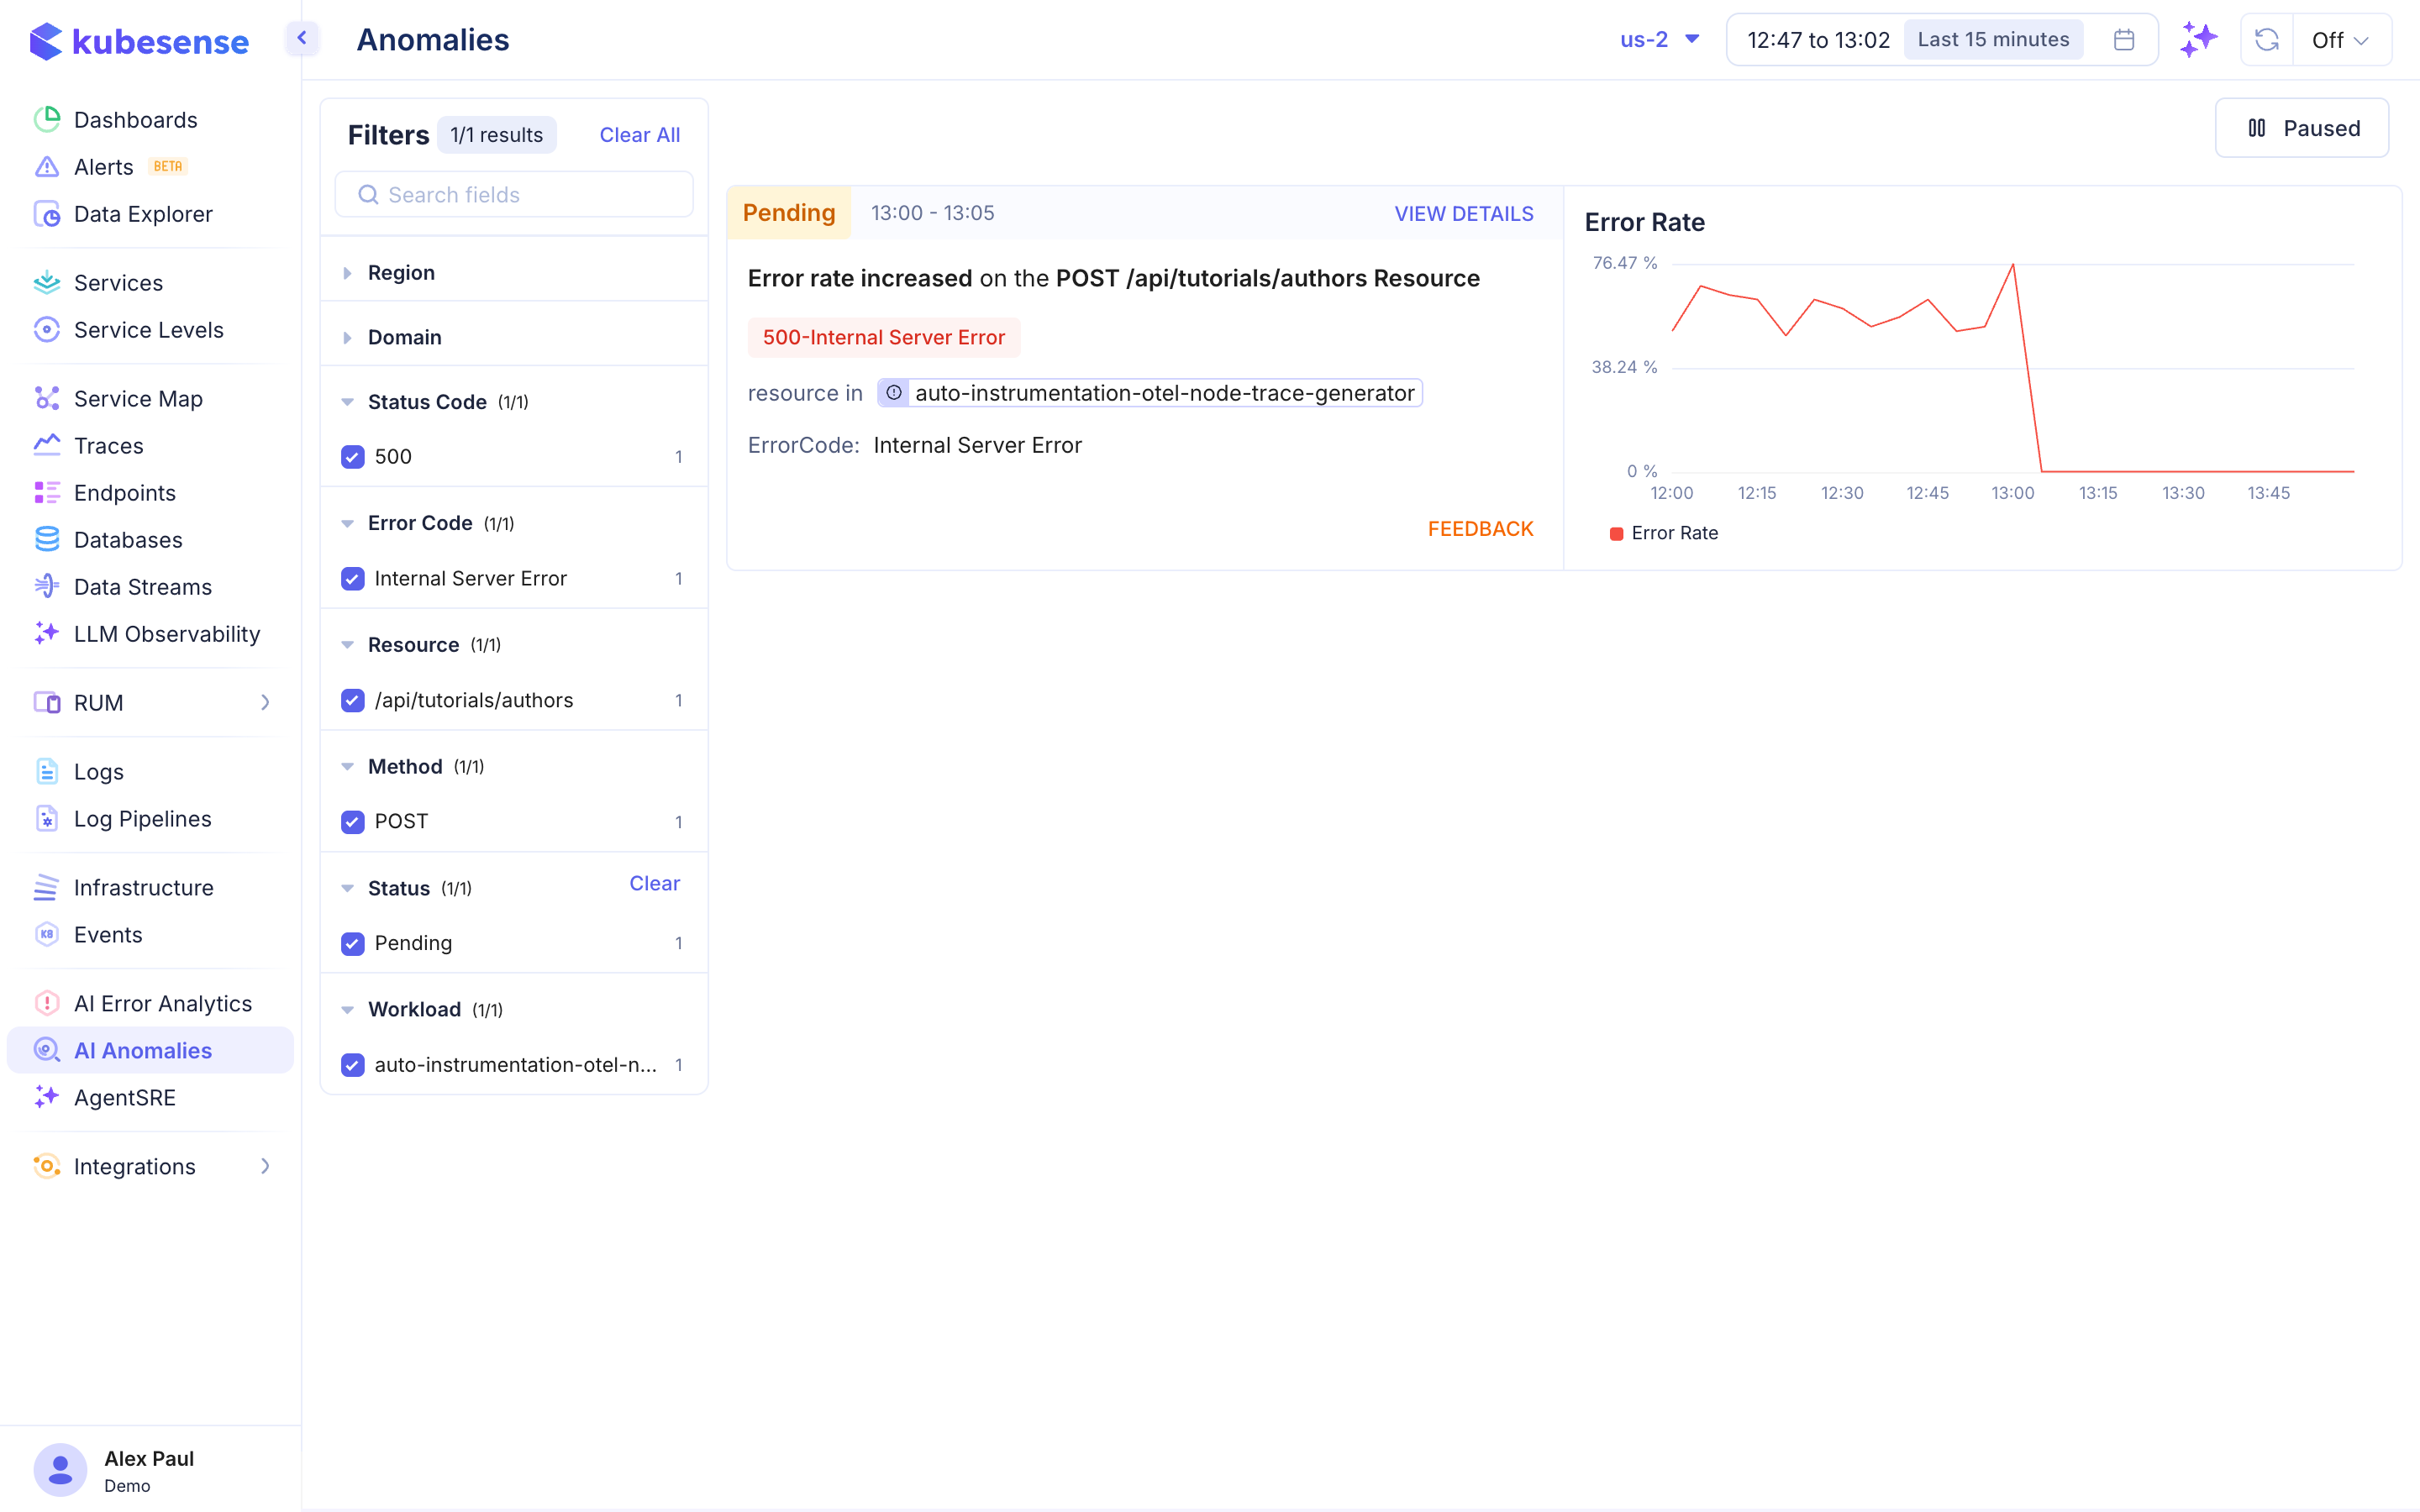
The Anomalies page shows all detected anomalies with their status, affected resource, and visualization of the anomalous behavior.
Anomaly Card
Each detected anomaly displays:
| Field | Description |
|---|---|
| Status | Current status — Pending, Active, or Resolved |
| Time Range | When the anomaly was detected (e.g., "13:00 - 13:05") |
| Description | What was detected (e.g., "Error rate increased on the POST /api/tutorials/authors Resource") |
| Error Code | The specific error (e.g., "500-Internal Server Error") |
| Resource | The affected resource/workload |
| Error Rate Chart | Time-series visualization showing the anomalous spike |
Filters
The left panel provides filtering by:
- Region — Geographic region
- Domain — Service domain
- Status Code — HTTP status code (e.g., 500)
- Error Code — Specific error classification (e.g., Internal Server Error)
- Resource — API resource/path (e.g.,
/api/tutorials/authors) - Method — HTTP method (GET, POST, PUT, DELETE)
- Status — Anomaly status (Pending, Active, Resolved)
- Workload — Kubernetes workload name
Anomaly Detection
KubeSense's anomaly detection works by:
- Baseline learning — ML models learn normal behavior patterns for each service and endpoint
- Continuous monitoring — Incoming metrics are compared against the learned baseline
- Deviation detection — Significant deviations trigger anomaly alerts
- Auto-classification — Anomalies are automatically classified by type and severity
Actions
- View Details — See full anomaly context including correlated metrics and traces
- Feedback — Provide feedback on whether the detection was accurate to improve the model
- Pause/Resume — Toggle anomaly detection on or off using the Paused/Active button in the top right