MCP Server
The KubeSense MCP (Model Context Protocol) Server enables AI assistants like Claude, ChatGPT, and other MCP-compatible clients to query and analyze your Kubernetes telemetry and infrastructure — logs, traces, metrics, workloads, issues, and alerts — using natural language.
Overview
The MCP server exposes a set of read-only tools over the MCP protocol that let AI assistants discover available fields, search raw data, run aggregated analyses, inspect the cluster inventory, and review issues and alerts across your entire observability stack. It is available over HTTP at /mcp on your KubeSense host.
Key capabilities:
- Search and filter logs and traces with a SQL-style WHERE clause
- Run aggregated analyses with grouping, percentiles, and time-series breakdowns
- Execute PromQL queries against your metrics
- Combine multiple datasources (logs, traces, metrics) in a single query with formula support
- Browse the live system inventory — clusters, nodes, pods, and workloads with health and golden-signal summaries
- Review platform-detected application issues, recent deploys/scaling changes, and infrastructure failures
- Inspect firing alerts, alert rules, and alert history
- Discover available fields, metrics, and labels dynamically
Authentication
Connect to the MCP server with a KubeSense API key, passed in the x-api-key header:
x-api-key: <your-kubesense-api-key>Each request is scoped to the permissions of the API key. A tool will return a permission error if the key does not have access to the corresponding data (logs, traces, infrastructure, workloads, or alerts).
Generating an API Key
To connect an AI client to the MCP server, you need a KubeSense API key. Navigate to Settings > API Key Management and click Generate API Key.
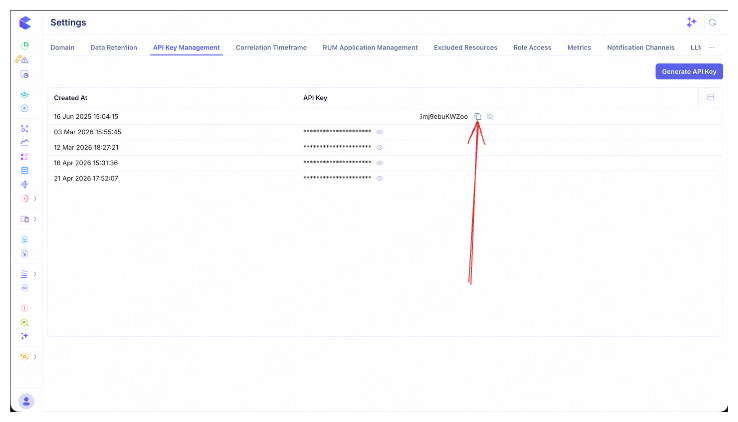
Copy the generated key and use it as the x-api-key header value when configuring your AI client.
Available Tools
Tools are grouped by intent. All tools are read-only.
Discovery Tools
Call these first to understand what data is available before querying.
get-trace-or-log-fields
Discovers valid fields for filtering logs or traces in a time window — including dynamic attributes — along with each field's type, allowed operators, and a copy-pasteable example filter. Always call this before writing a WHERE clause, using the same time window you plan to query. Field names in your filters must be the catalog labels this tool returns (raw storage column names are rejected).
Parameters:
| Parameter | Type | Description |
|---|---|---|
signal | "logs" | "traces" | Required. The telemetry surface to describe |
from_time | string | Required. Window start (RFC3339, e.g. 2026-05-01T00:00:00Z) |
to_time | string | Required. Window end (RFC3339) |
clusters | array (optional) | Restrict attribute discovery to specific clusters |
search | string (optional) | Case-insensitive substring filter on field names (e.g. http) |
limit | int (optional) | Cap the number of returned fields (0 = no cap) |
get-available-metrics
Searches for available metric names for PromQL queries. Keywords are AND-matched as case-insensitive substrings.
Parameters:
| Parameter | Type | Description |
|---|---|---|
search_keywords | array (optional) | Substring keywords to AND-filter metric names |
from_time | string (optional) | Window start (RFC3339). Defaults to now-1h |
to_time | string (optional) | Window end (RFC3339). Defaults to now |
limit | int (optional) | Cap the returned metric count (0 = no cap) |
get-metric-labels
Fetches available label names for a specific metric, useful for building PromQL queries.
Parameters:
| Parameter | Type | Description |
|---|---|---|
name | string | Required. The metric to get labels for |
from_time | string (optional) | Window start (RFC3339). Defaults to now-1h |
to_time | string (optional) | Window end (RFC3339). Defaults to now |
Search Tools
Search tools return raw records (a small page of rows) and accept a SQL-style WHERE clause filter.
search-logs
Browse raw log records with filtering and field selection. Queries stored logs only.
search-traces
Browse raw trace/span records with filtering and field selection. Queries stored traces only.
Parameters (both tools):
| Parameter | Type | Description |
|---|---|---|
from_time | string | Start time (RFC3339) |
to_time | string | End time (RFC3339) |
where | string (optional) | SQL-style WHERE clause. Empty = match everything in the window |
clusters | array (optional) | Restrict to specific clusters |
required_fields | array (optional) | Fields to include in results |
page_size | int (optional) | Number of rows to return |
Analysis Tools
Analysis tools run aggregated queries and return summarized results. They support both range (time-series) and instant (single point-in-time) query types.
analyze-logs
Run aggregated analysis over logs — count, avg, sum, min, max, percentiles — with optional group-by.
analyze-traces
Run aggregated analysis over traces, useful for latency statistics (p95/p99), error rates, and status-code breakdowns.
Parameters (both tools):
| Parameter | Type | Description |
|---|---|---|
from_time | string | Start time (RFC3339) |
to_time | string | End time (RFC3339) |
query_type | "range" | "instant" | Type of query |
where | string (optional) | SQL-style WHERE clause |
value_operation | string | Aggregation function (e.g. row_count, avg, sum, min, max, p95, p99) |
fields | array (optional) | Fields to aggregate over, e.g. [{field: "duration"}] |
group_by_fields | array (optional) | Fields to group results by, e.g. [{field: "service"}] |
sort_direction | "ASC" | "DESC" (optional) | Sort direction (defaults to ASC) |
limit | int (optional) | Top-N series cap for range queries (server default 20) |
analyze-metrics
Execute a PromQL query against your metrics with summary statistics.
Parameters:
| Parameter | Type | Description |
|---|---|---|
from_time | string | Start time (RFC3339) |
to_time | string | End time (RFC3339) |
query_type | "range" | "instant" | Type of query |
promql | string | PromQL expression |
analyze-telemetry
The most powerful analysis tool — combines multiple datasources (logs, traces, metrics) in a single request with formula composition.
Parameters:
| Parameter | Type | Description |
|---|---|---|
from_time | string | Start time (RFC3339) |
to_time | string | End time (RFC3339) |
query_type | "range" | "instant" | Type of query |
queries | object | Map of query labels (A, B, C...) to datasource queries |
Each query in the queries map is a logs, traces, metrics, or formula query. Formulas reference other queries by label, e.g., (A/B)*100.
System Inventory Tools
Browse the live cluster inventory — what exists, its health, and its resource pressure.
| Tool | Purpose | Key parameters |
|---|---|---|
list-clusters | List the Kubernetes clusters this deployment monitors | (none) |
list-nodes | List nodes with health and resource pressure | clusters, sort_by, sort_direction, page, page_size, time window |
get-node-detail | Full detail for one node — addresses, conditions, taints, capacity/usage, versions | name (required), clusters |
list-pods | List pods with phase, restart counts, and usage — the primary tool for crash-loop / OOM / pending-pod triage | clusters, namespace, status, sort_by, page, page_size, time window |
get-pod-detail | Full detail for one pod — container statuses, restart reason, exit code, conditions, QoS, IPs, requests/limits | name, namespace, cluster (all required) |
list-workloads | List workloads (Deployments, StatefulSets, DaemonSets, …) with health and golden-signal summaries | clusters, namespace, kind, sort_by (rps, p95, errors, error_rate, restarts), time window |
get-workload-detail | Detail for one workload — replicas, restarts, 4xx/5xx counts, RPS, protocols | workload, namespace (required), cluster, time window |
Issues & Changes Tools
Surface problems and recent changes for incident triage.
| Tool | Purpose | Key parameters |
|---|---|---|
list-issues | Problems KubeSense has already detected — errors, latency, connectivity issues between workloads | clusters, page, page_size, limit, time window |
get-recent-changes | Recent deploys and scaling affecting a workload — image updates and replica changes (from Kubernetes events) | namespace, workload, cluster, kind (image_update | scaling), time window, limit |
get-infra-issues | Infrastructure failures for a workload — crashes (with exit code), OOM kills, restart backoffs, probe failures, scheduling/mount failures, image-pull errors, node problems (from Kubernetes events) | namespace, workload, cluster, reason (e.g. OOMKilling, BackOff, ImagePullBackOff), time window, limit |
Alert Tools
Inspect firing alerts and alert rule definitions.
| Tool | Purpose | Key parameters |
|---|---|---|
list-alerts | Currently-firing alerts from your Prometheus Alertmanager integration (when enabled) | state, include_silences |
list-active-alerts | Currently-firing KubeSense alerts across all rules | fingerprint, acknowledged, assignee, include_resolved, time window, limit, offset |
list-alert-rules | Browse alert rule definitions (the parent rules) | enabled, state (firing | normal), severity, query_type, search, limit, offset |
get-alert-details | Full definition and current firing state of a rule | alert_rule_id (required), fingerprint |
get-alert-history | Recent firing/resolved event history of a rule | alert_rule_id (required), fingerprint, limit |
Filter Syntax
The log and trace tools (search-logs, search-traces, analyze-logs, analyze-traces) accept a SQL-style WHERE clause in their where argument:
namespace = default AND type = ERROR
protocol = HTTP OR status = error
instance IN ("service-a", "service-b")
body ILIKE "%timeout%"
Supported operators: =, !=, <, >, <=, >=, LIKE, ILIKE, SUBSTR_ILIKE, IN — combined with AND, OR, NOT and parentheses.
Field names: Use the catalog labels returned by get-trace-or-log-fields verbatim. Raw storage column names (e.g. level, pod_name, return_code, app_service) are rejected in favor of their catalog labels (e.g. type, instance, status_code, service). For trace app identity, prefer service (the cross-platform identifier) over workload (K8s-specific).
Values: Strings without special characters can be bare (type = ERROR); strings with spaces or punctuation use double quotes (body ILIKE "%timeout%"). Enum values are case-sensitive — check the example snippet returned by discovery for the exact casing.
Custom attributes: Prefix dynamic attribute keys with @ — @http.method = GET, @db.system = postgres. Trace attributes use the same syntax.
Connecting AI Clients
Claude Desktop
Add the following to your Claude Desktop MCP configuration:
{
  "mcpServers": {
    "kubesense": {
      "url": "https://<kubesense-host>/mcp",
      "headers": {
        "x-api-key": "<your-kubesense-api-key>"
      }
    }
  }
}
Claude Code
Add the MCP server to your Claude Code configuration:
claude mcp add --transport http kubesense-mcp "https://<kubesense-host>/mcp" --header "x-api-key: <your-kubesense-api-key>" --scope userSee MCP installation scopes for more on the --scope option.
Cursor
Add the MCP server in Cursor via Settings > Tools & Integrations > MCP Tools > Add new global MCP server, or add it directly to ~/.cursor/mcp.json:
{
  "mcpServers": {
    "kubesense-mcp": {
      "url": "https://<kubesense-host>/mcp",
      "headers": {
        "x-api-key": "<your-kubesense-api-key>"
      }
    }
  }
}
Other MCP Clients
Any MCP-compatible client can connect to the endpoint at /mcp using MCP's Streamable HTTP transport. Send your KubeSense API key in the x-api-key header.
Example Queries
Once connected, you can ask your AI assistant natural language questions like:
- "Show me all error logs from the payments namespace in the last hour"
- "What's the p99 latency for the checkout service over the past 24 hours?"
- "Which pods are crash-looping right now, and why?"
- "Compare error rates between the canary and stable deployments"
- "Find traces where duration is over 5 seconds and group by service"
- "Show me the ratio of 5xx errors to total requests as a percentage"
- "What changed for the orders workload before this alert started firing?"
- "List the alert rules that are currently firing and their history"
MCP Skills
KubeSense provides a set of pre-built MCP skills that extend your AI assistant with ready-to-use Kubernetes troubleshooting and analysis workflows. These skills act as prompt templates that guide the AI through common operational tasks using the MCP tools described above.
Explore the available skills and installation instructions in the kubesense-mcp-skills repository.