Alert Rules
The Alert Rules tab lets you create, manage, and monitor alert rules that evaluate conditions on your metrics, logs, and traces data.
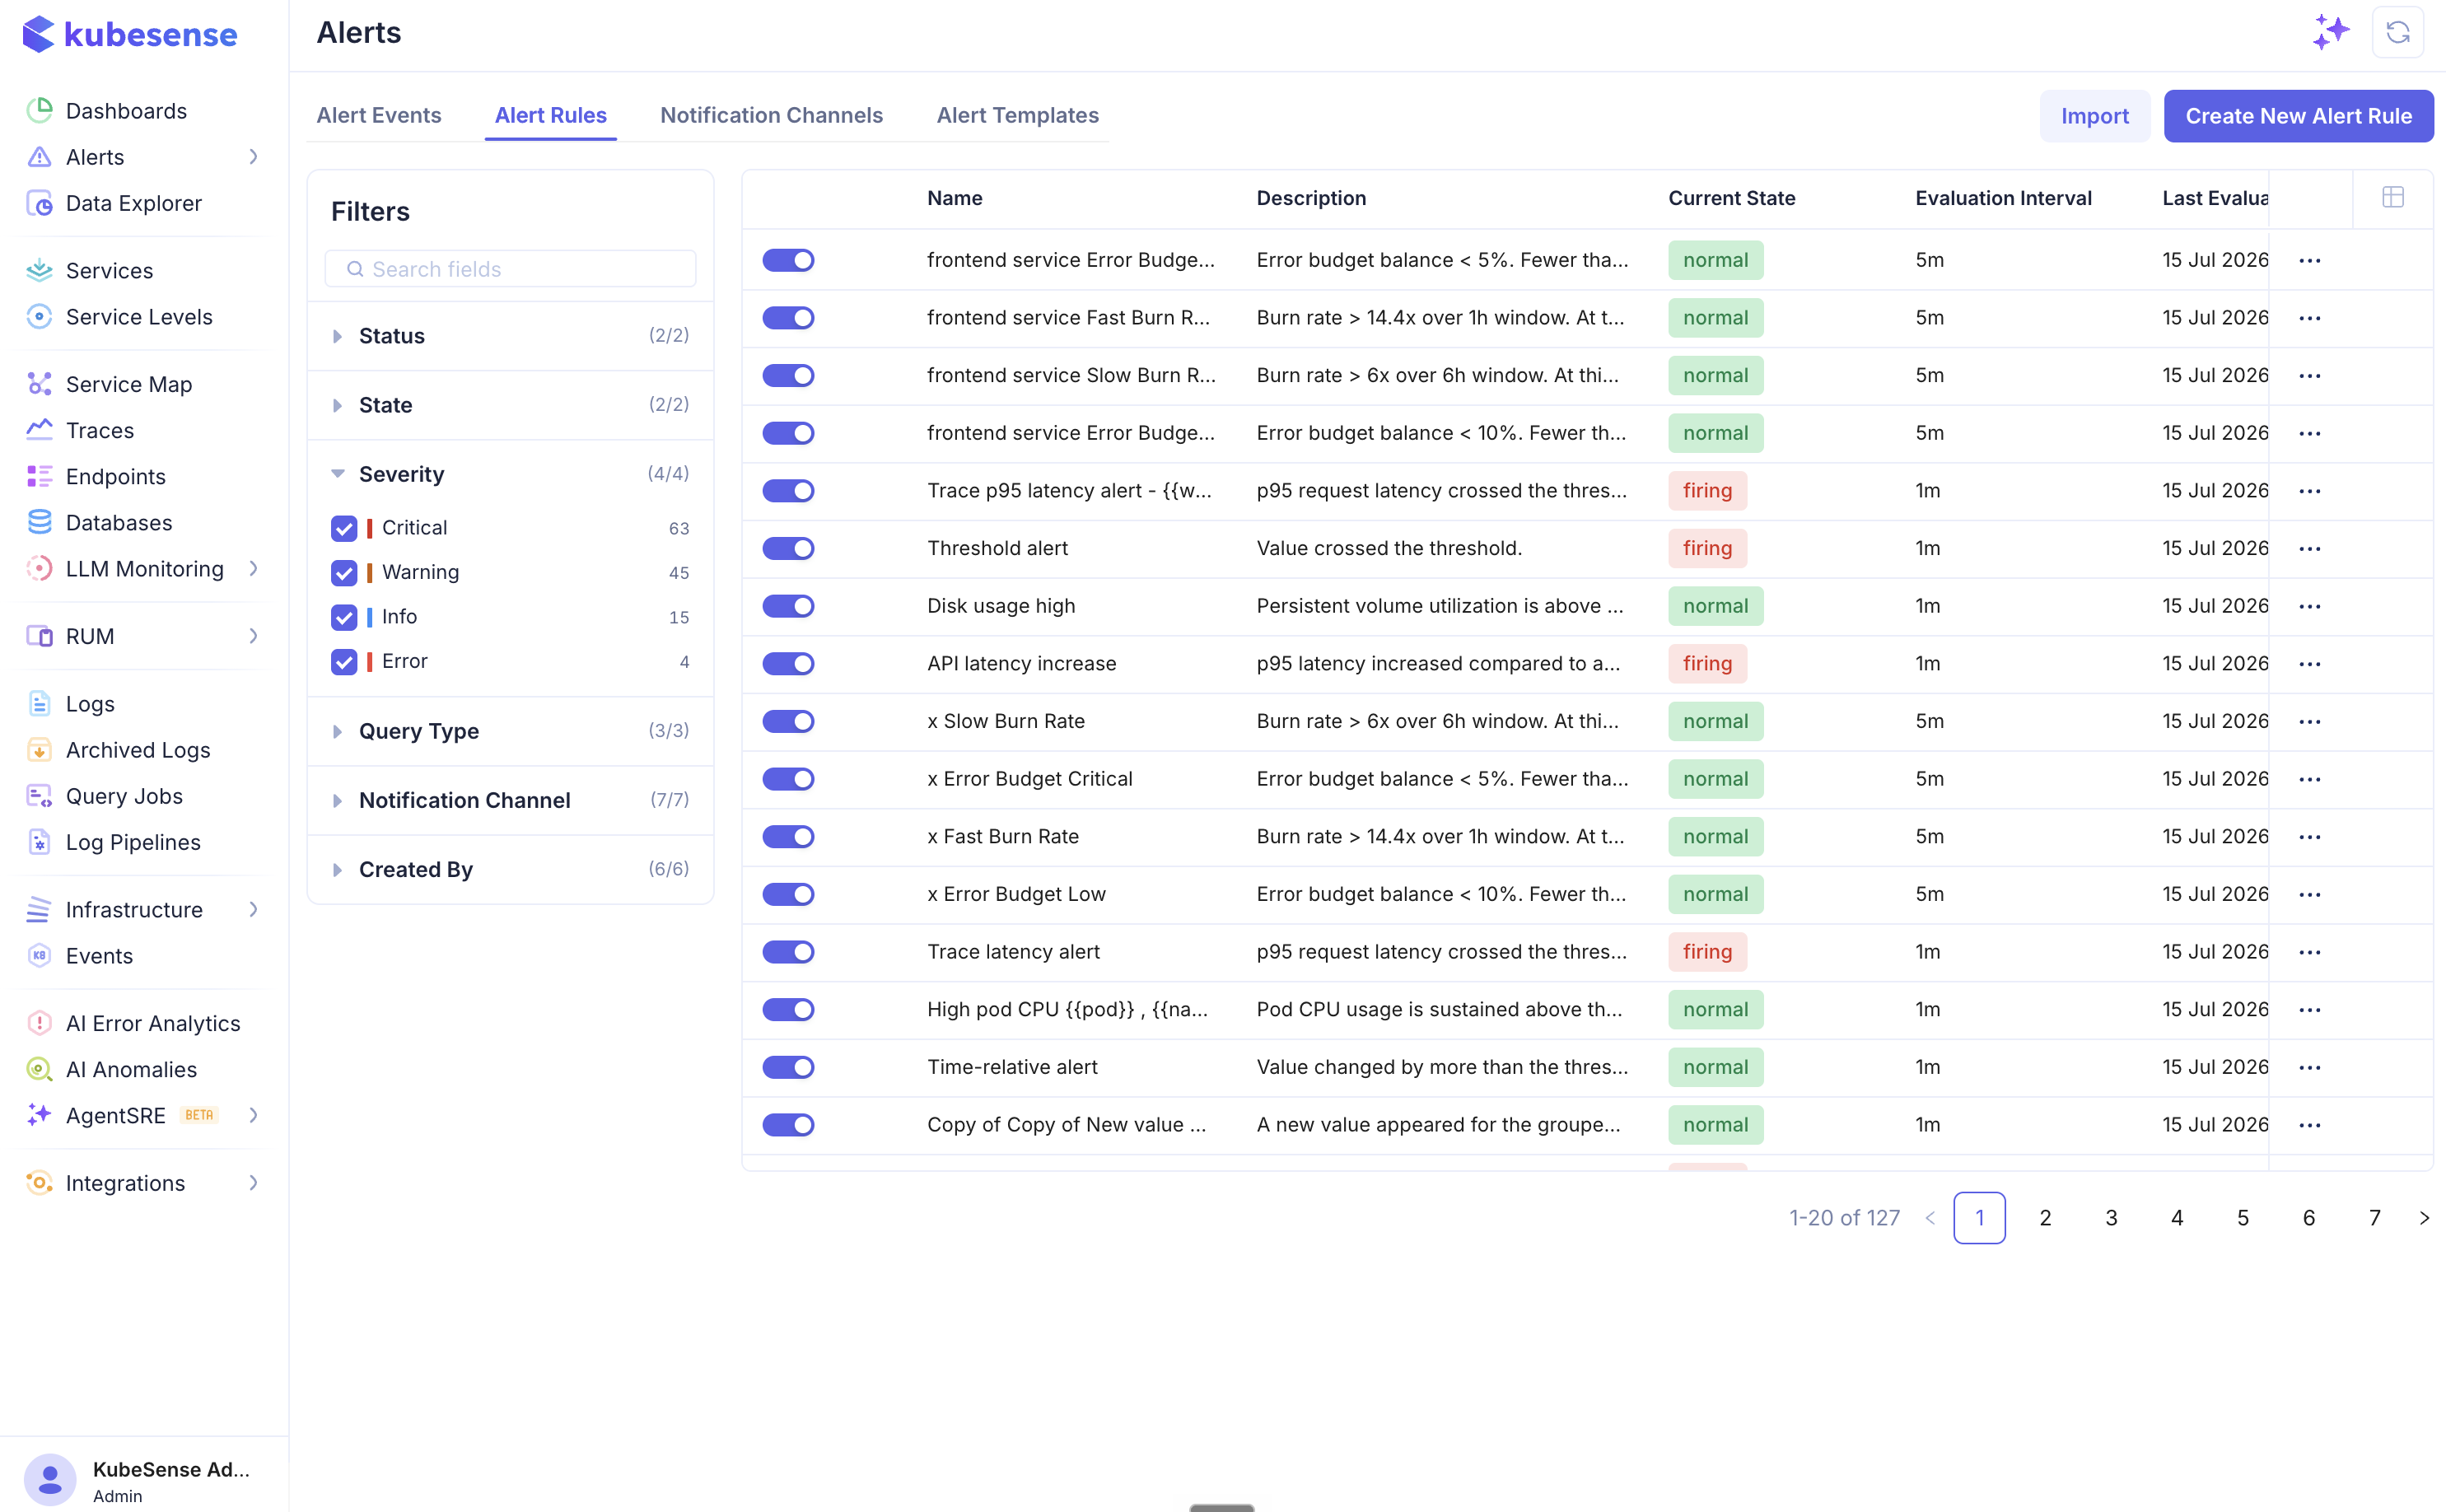
Alert Rules Table
All configured alerts are listed with their current status:
| Column | Description |
|---|---|
| Enable/Disable | Toggle to activate or deactivate a rule without deleting it |
| Name | Alert rule name |
| Description | What the alert monitors |
| Current State | normal (green) — condition not met, pending (amber) — condition met but the firing frequency not yet satisfied, or firing (red) — notifications active |
| Evaluation Interval | How often the rule is checked (e.g., 1m, 2m, 5m) |
| Last Evaluation Time | When the rule was last evaluated |
| Created By | User who created the rule |
The sidebar offers the same explorer-style faceted filters as the Alert Events page — narrow by enabled/disabled, state, severity, query type, notification channel, or creator. Clicking a rule opens its detail page with the live condition chart and incident history.
Creating an Alert Rule
Click Create New Alert Rule to open the template picker — pick a ready-made recipe, an alert-type starter, or start blank. The editor has four sections to configure. (You can also import rules as JSON.)
Step 1 — Define Alert Query
Build the data query that the alert evaluates. This uses the same query builder available in the Data Explorer.
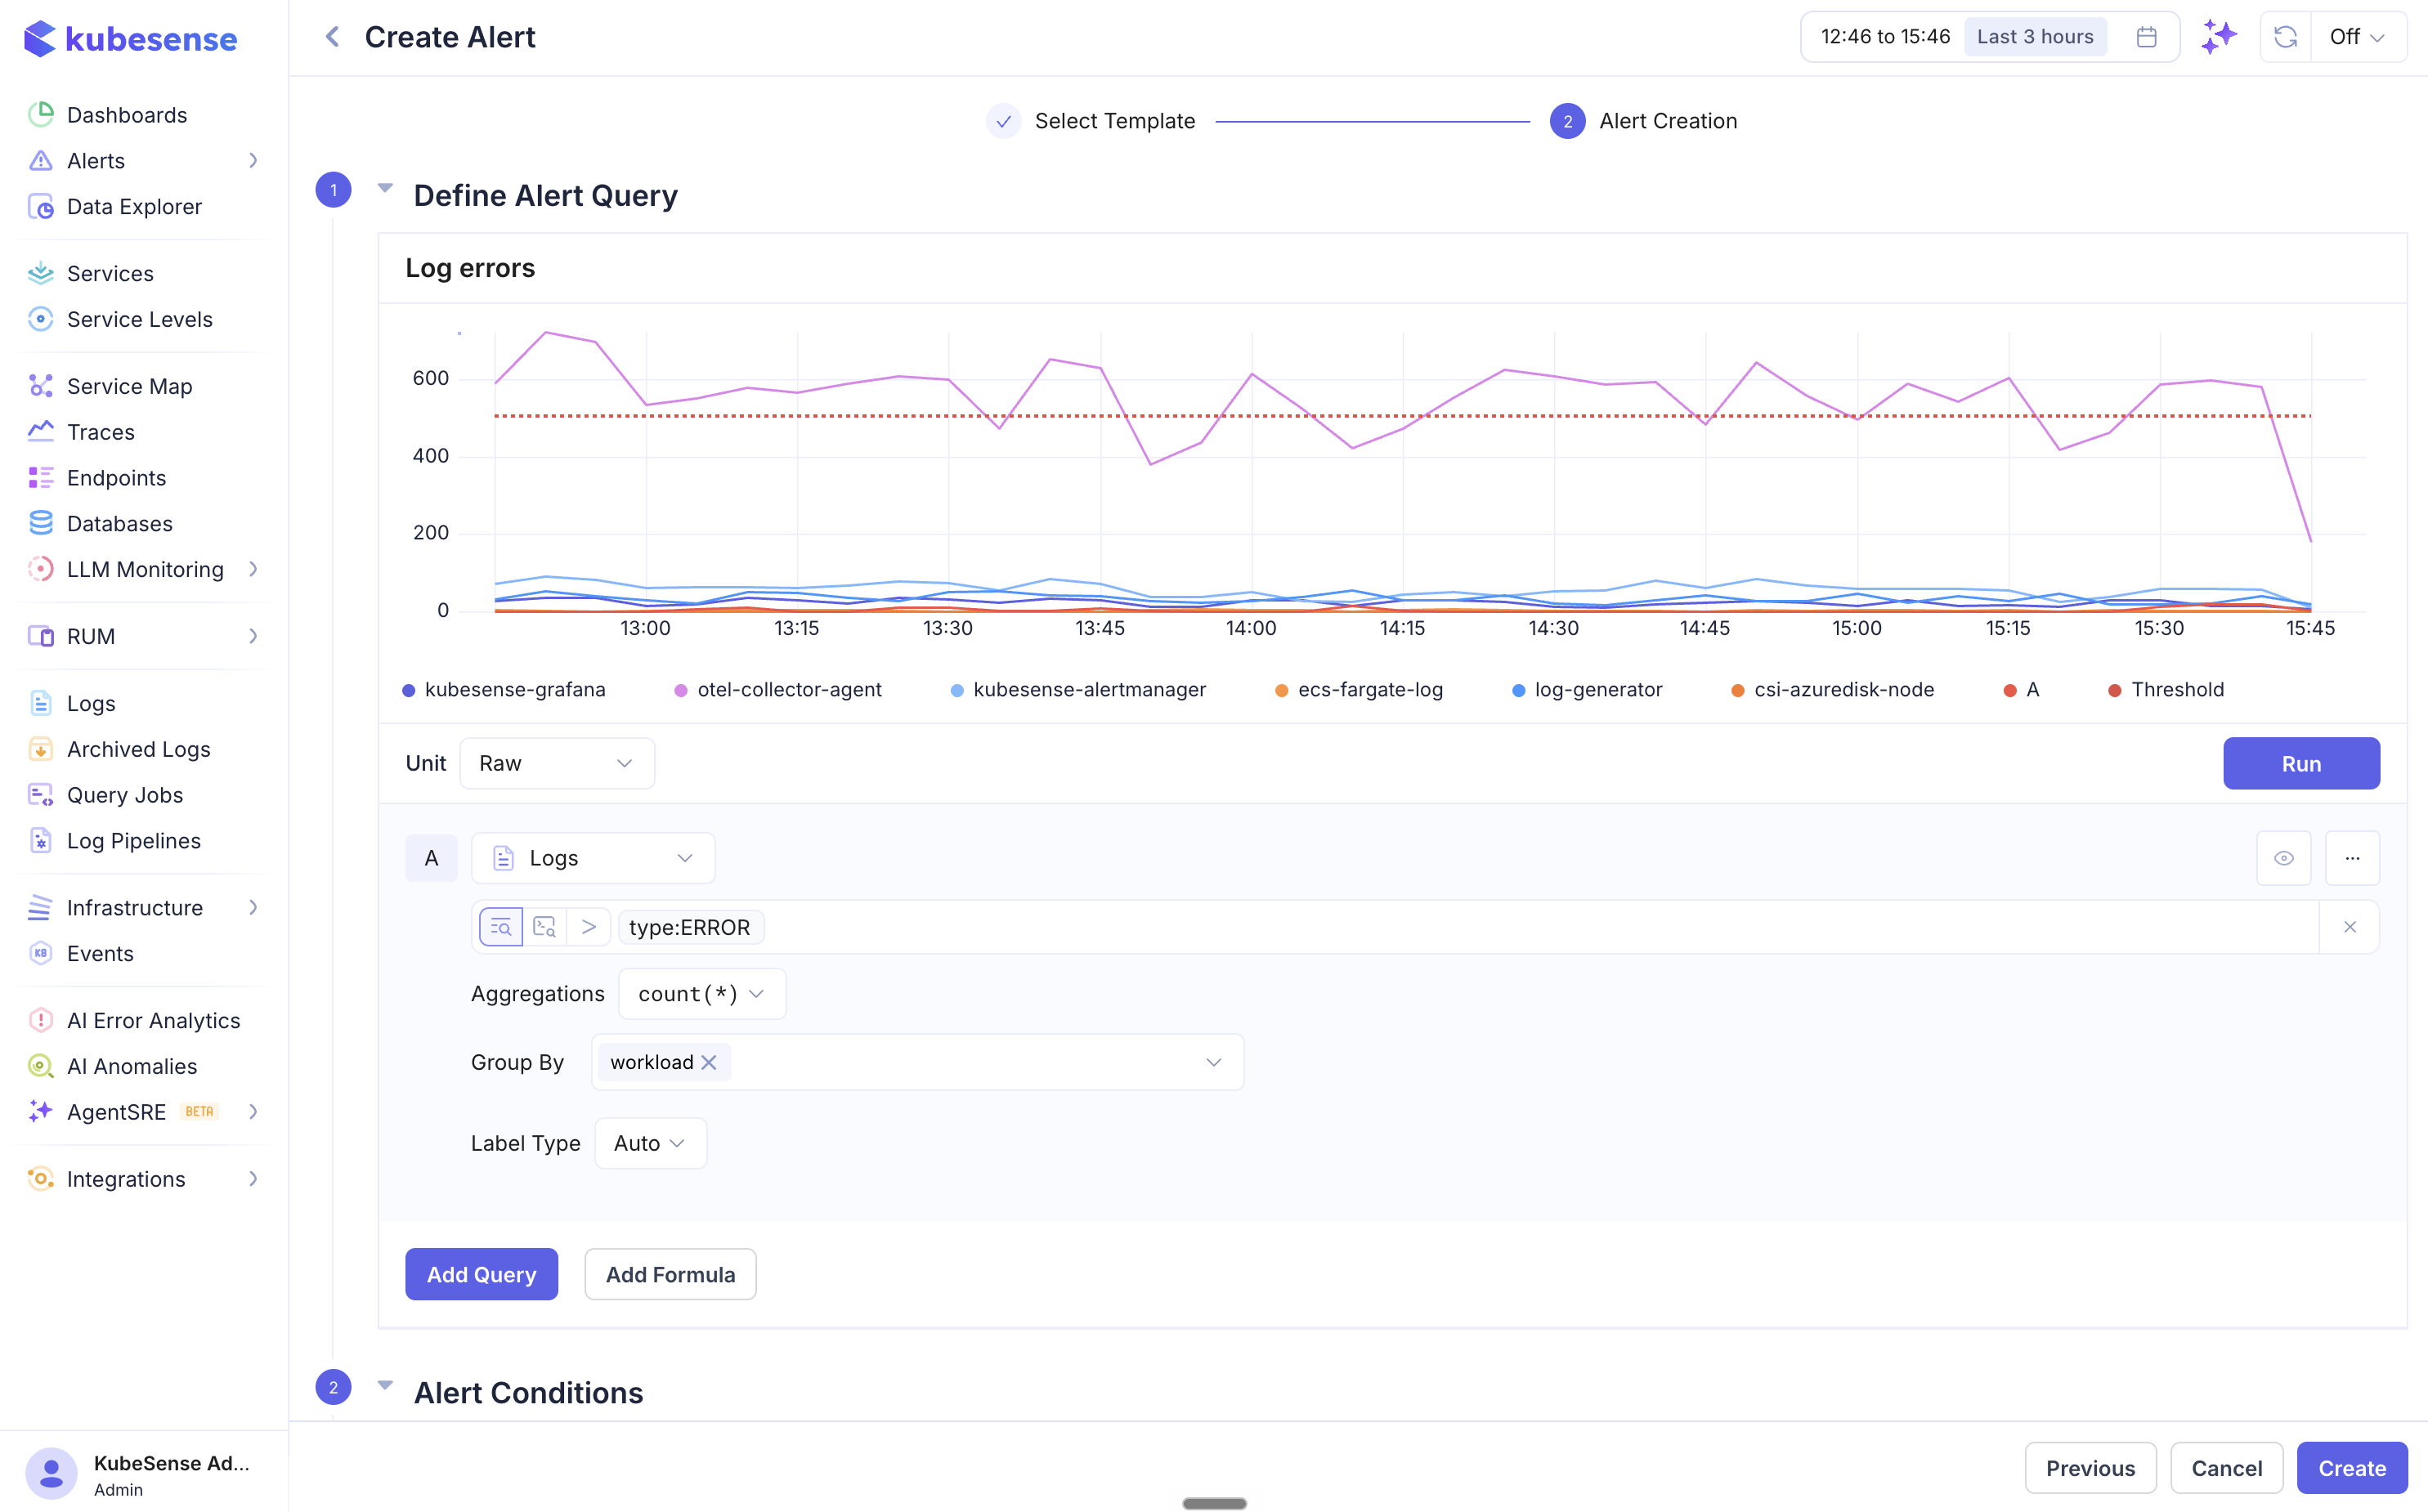
| Field | Description |
|---|---|
| Data Source | Choose Logs, Metrics, or Traces |
| Filters | Filter data using common filters or advanced filter expressions (e.g., type:ERROR, level IN (ERROR, WARN)) |
| Aggregation | Aggregation function to apply — count(*), avg(), sum(), max(), min(), p50(), p90(), p95(), p99() |
| Group By | Group results by a column (e.g., workload, namespace, level). Produces multi-series alerts that evaluate and fire independently per group. |
| Label Type | Controls how series labels are generated |
| Step | Bucket duration for time-series aggregation (Auto, 30s, 1m, etc.) |
Click Run to preview the query result as a time-series chart. The red dashed threshold line shows where your alert condition will trigger.
Multiple Queries and Formulas
You can add multiple queries using Add Query (each labeled A, B, C, etc.) and combine them with Add Formula to create computed conditions. For example:
- Query A = total request count (logs)
- Query B = error request count (logs)
- Formula C =
B / A * 100(error rate percentage)
The alert condition can then evaluate the formula result.
Step 2 — Alert Conditions
Choose the condition type and configure when the alert should fire.
Threshold Alert
Fires when the query value crosses a fixed threshold.
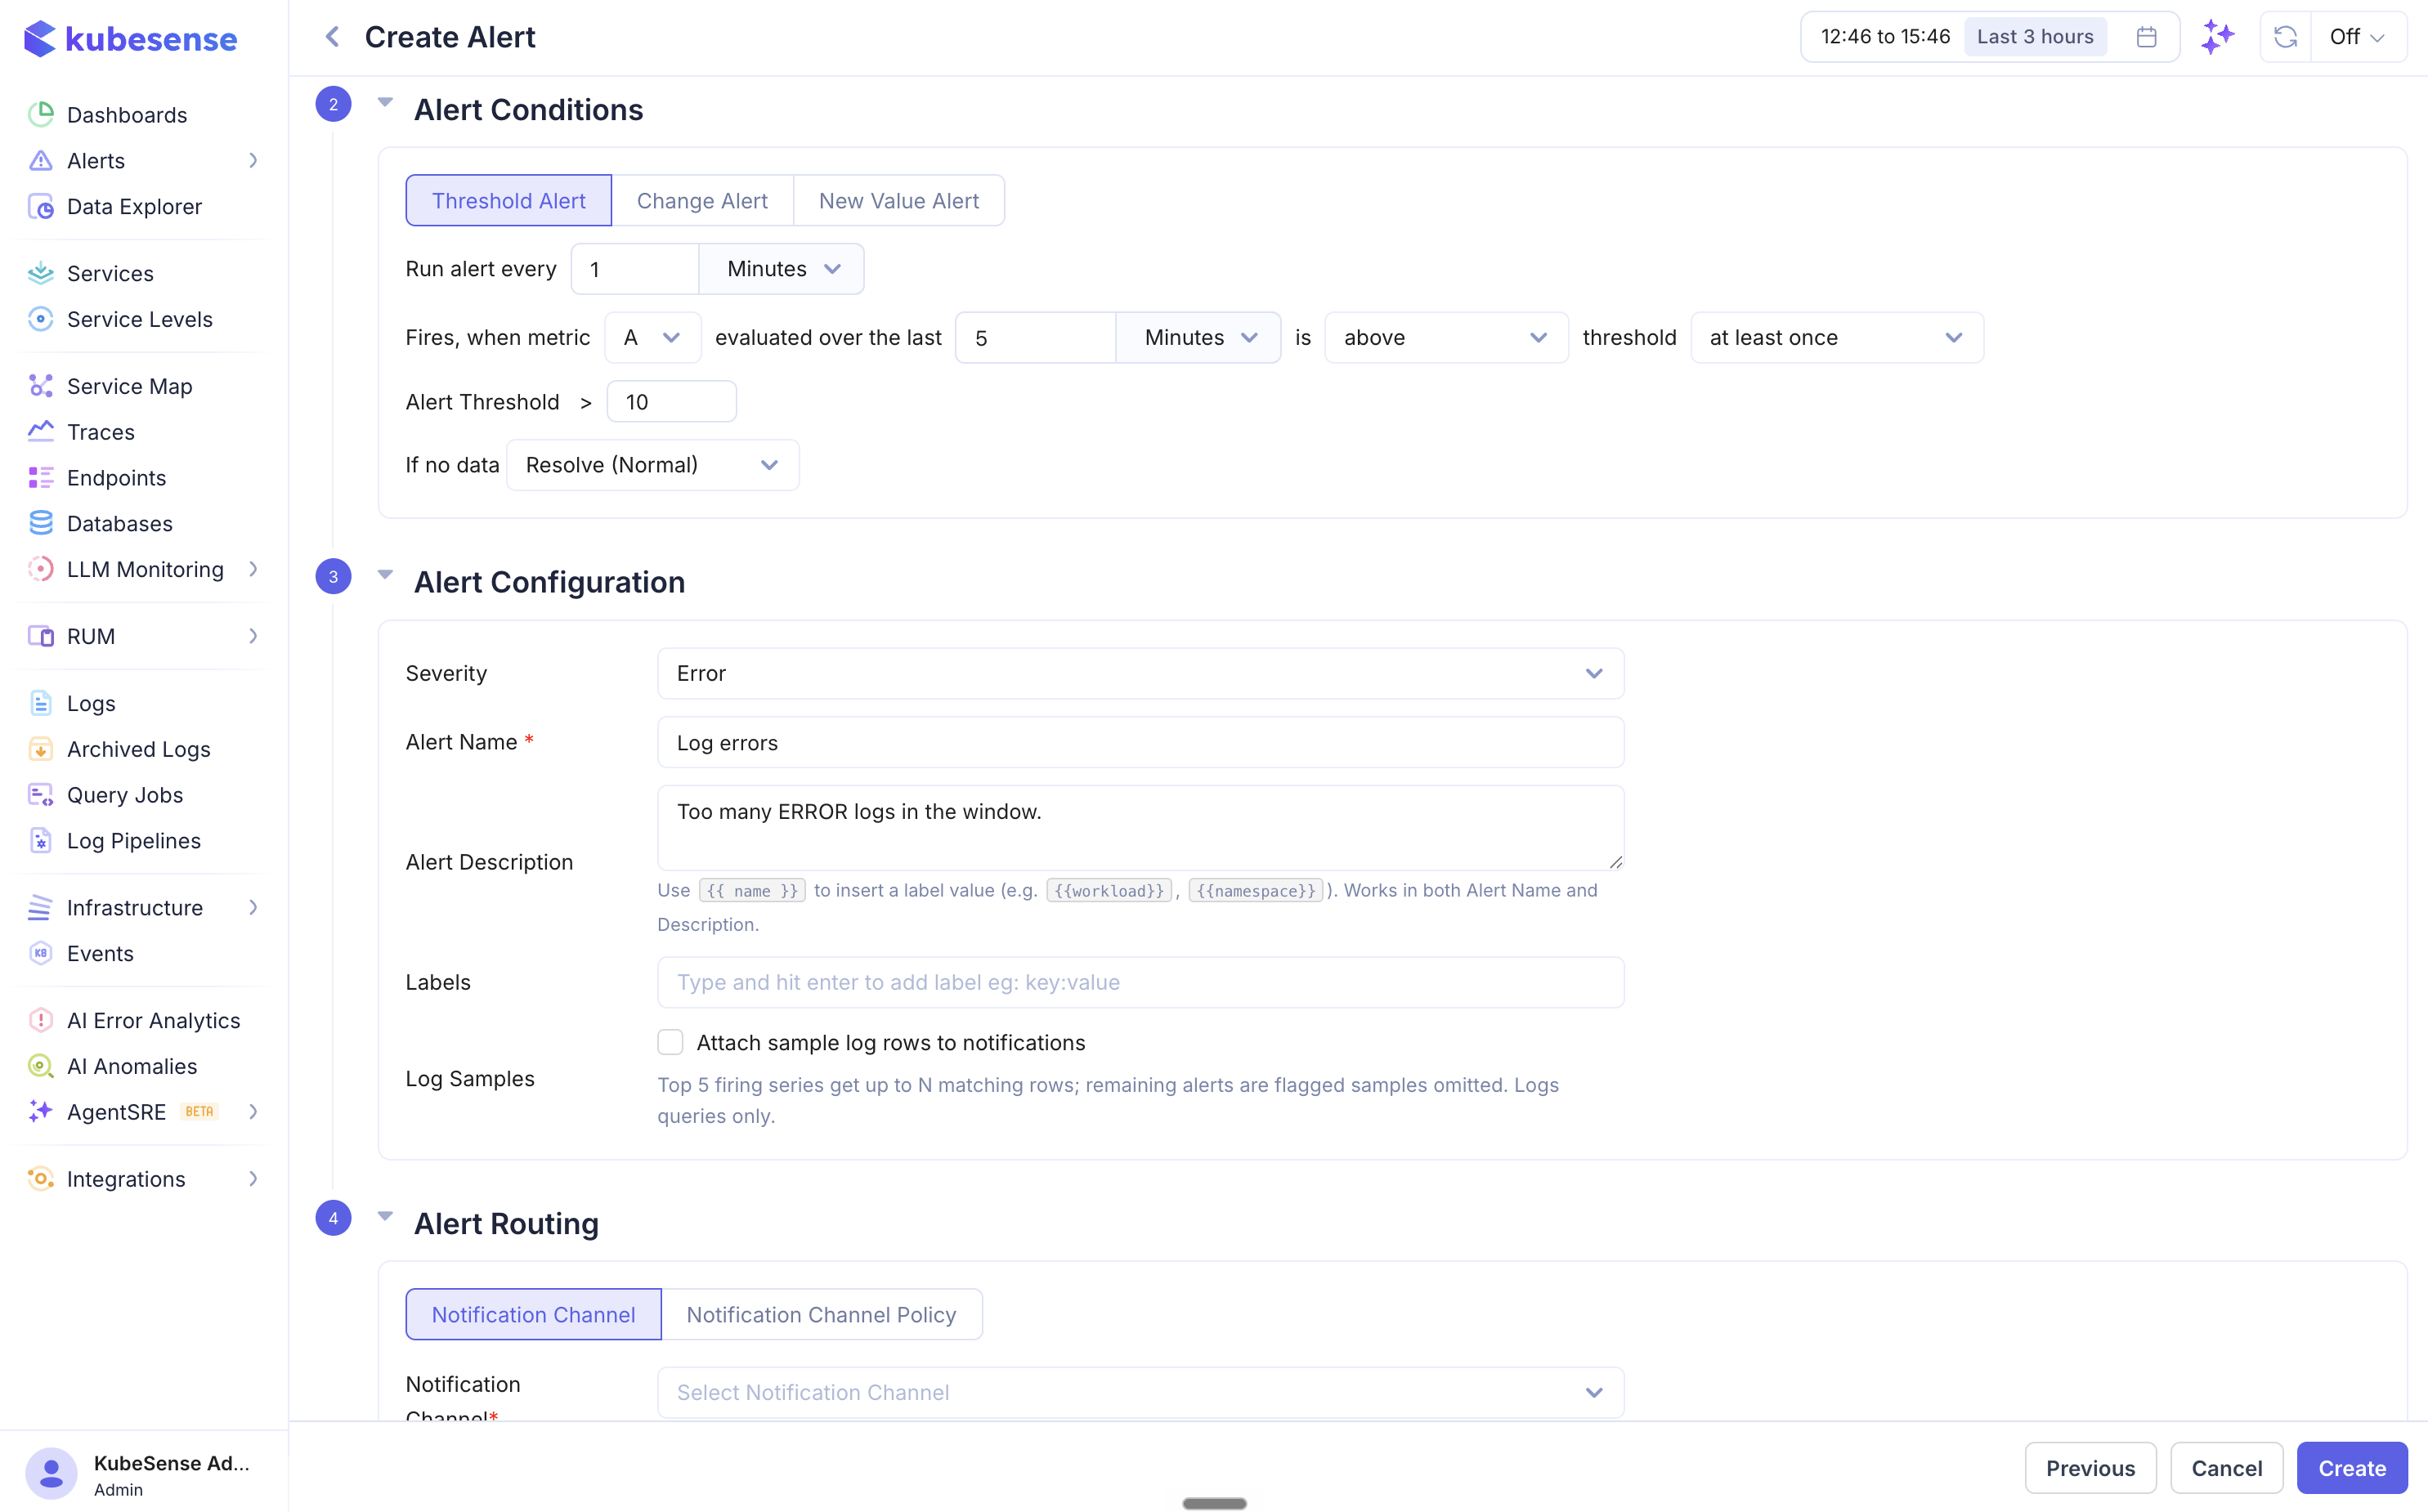
| Field | Description |
|---|---|
| Run alert every | Evaluation interval (e.g., every 2 Minutes) |
| Fires, when metric | Which query or formula to evaluate (A, B, C, etc.) |
| Evaluated over the last | Time window for the data query lookback |
| Operator | equal to, above, above or equal to, below, below or equal to |
| Alert Threshold | The threshold value to compare against |
Firing frequency controls how many breaches are required before the alert fires:
| Frequency | Behavior |
|---|---|
| At least once | Fire immediately when the condition is met |
| More than once | Fire only after the condition is breached more than N times within a specified window |
| Always | Fire only when the condition is met on every evaluation within the window |
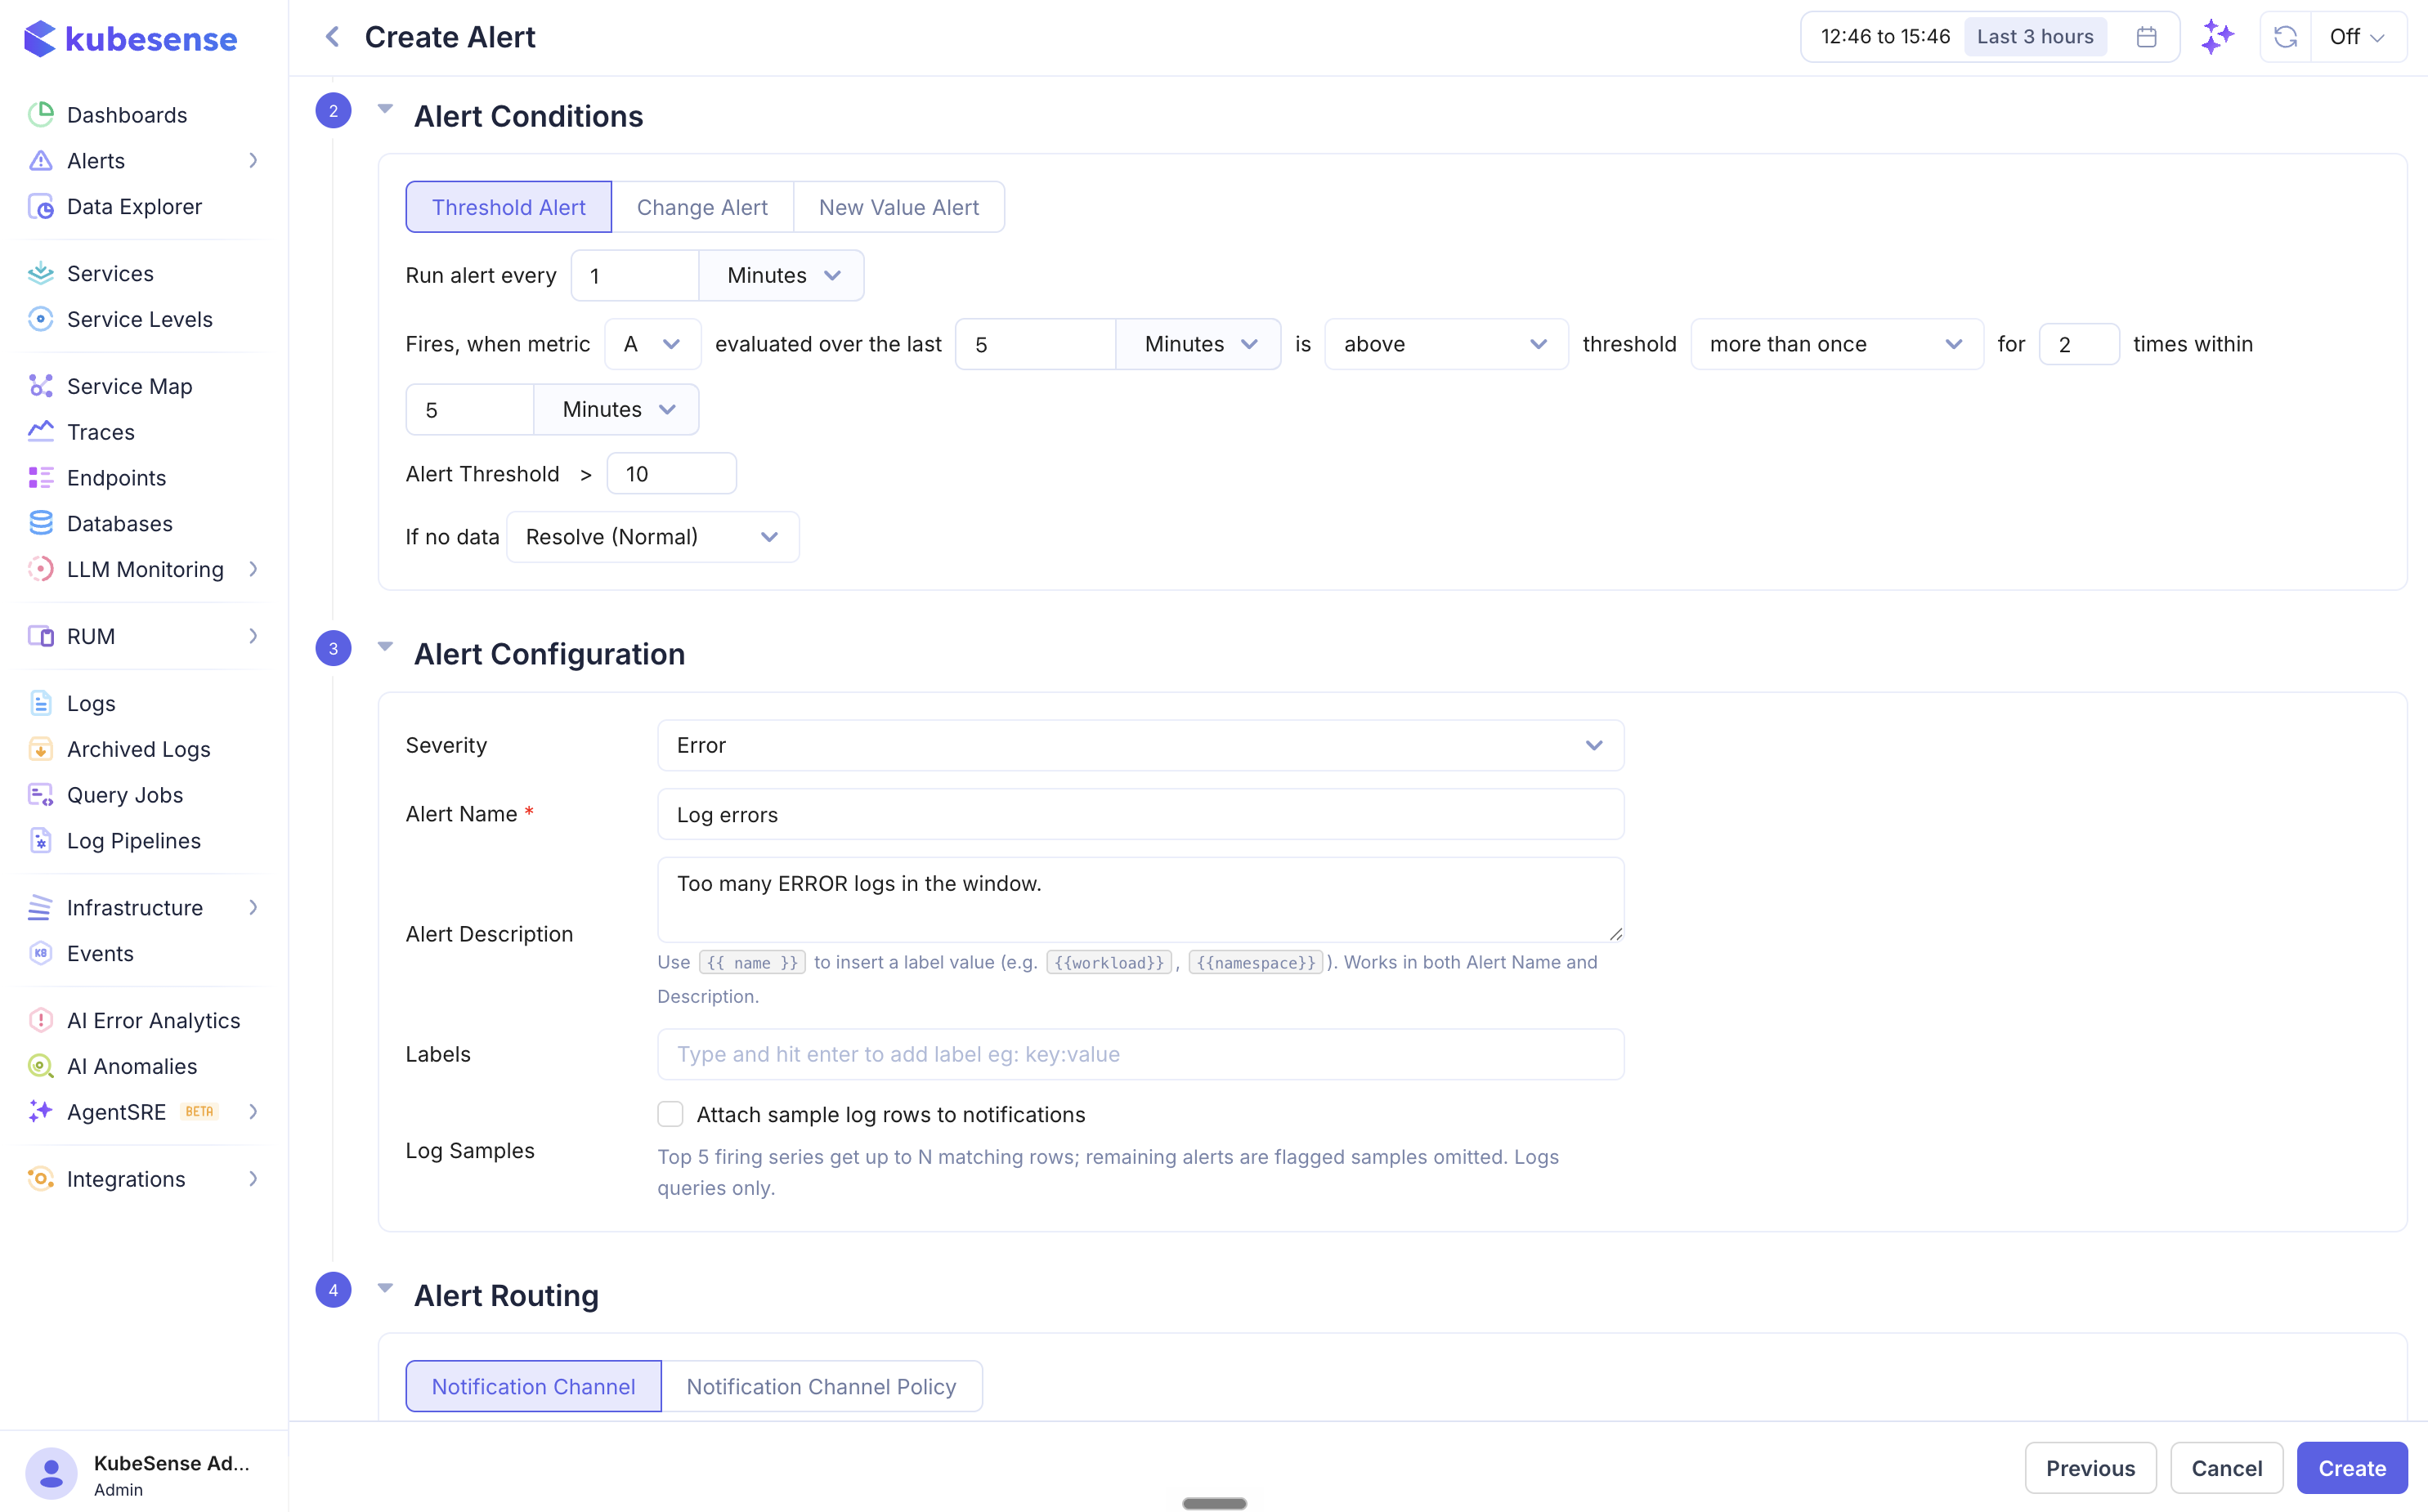
When using more than once, you specify both the number of required breaches and the time window over which to count them. For example, "for 2 times within 5 Minutes" means the condition must be breached more than 2 times in the last 5-minute window before the alert fires.
When using always, the alert fires only if every single evaluation within the breach counting window resulted in a breach — useful for avoiding false positives from transient spikes.
Change Alert
Fires when the query value changes by a specified amount relative to a previous time period.
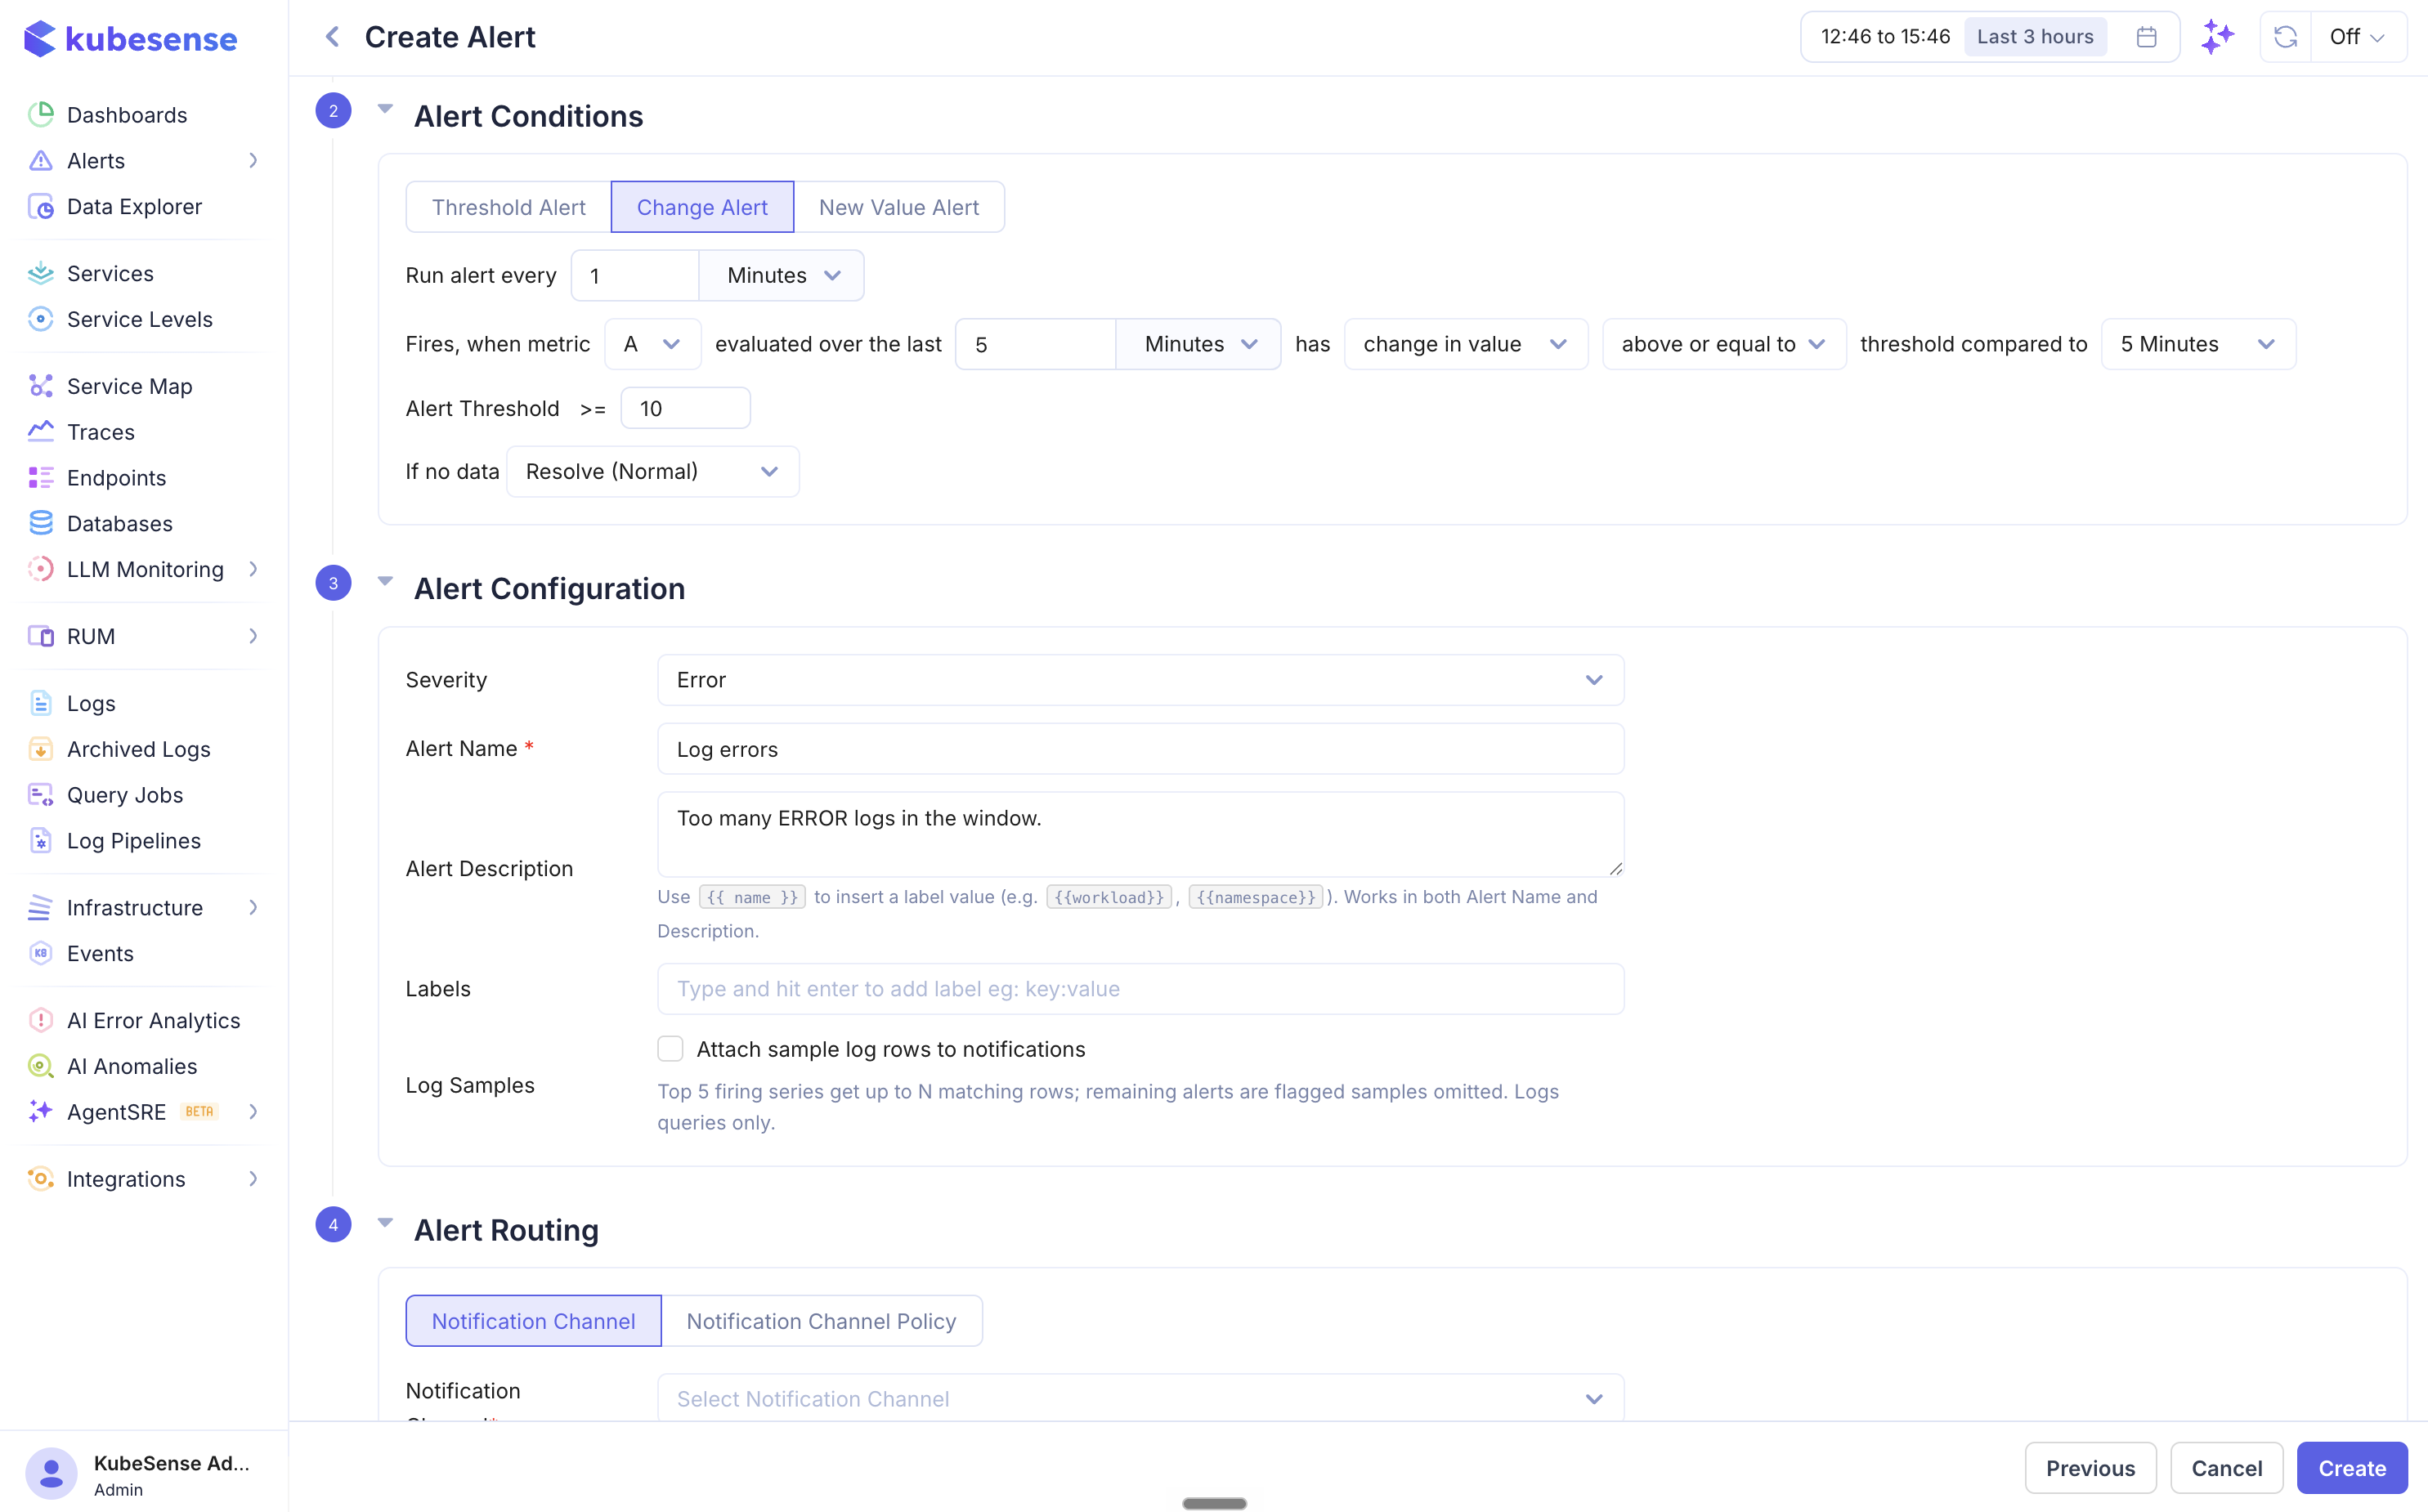
| Field | Description |
|---|---|
| Change type | change in value (absolute difference) or change in % (percentage difference) |
| Operator | equal to, above, below, etc. |
| Threshold compared to | The historical period to compare against (e.g., 5 Minutes ago) |
Use change alerts to detect sudden spikes or drops relative to recent behavior. For example, "fire when error count changes by more than 50% compared to 5 minutes ago."
New Value Alert
Fires when a value appears that was not seen in the comparison window.
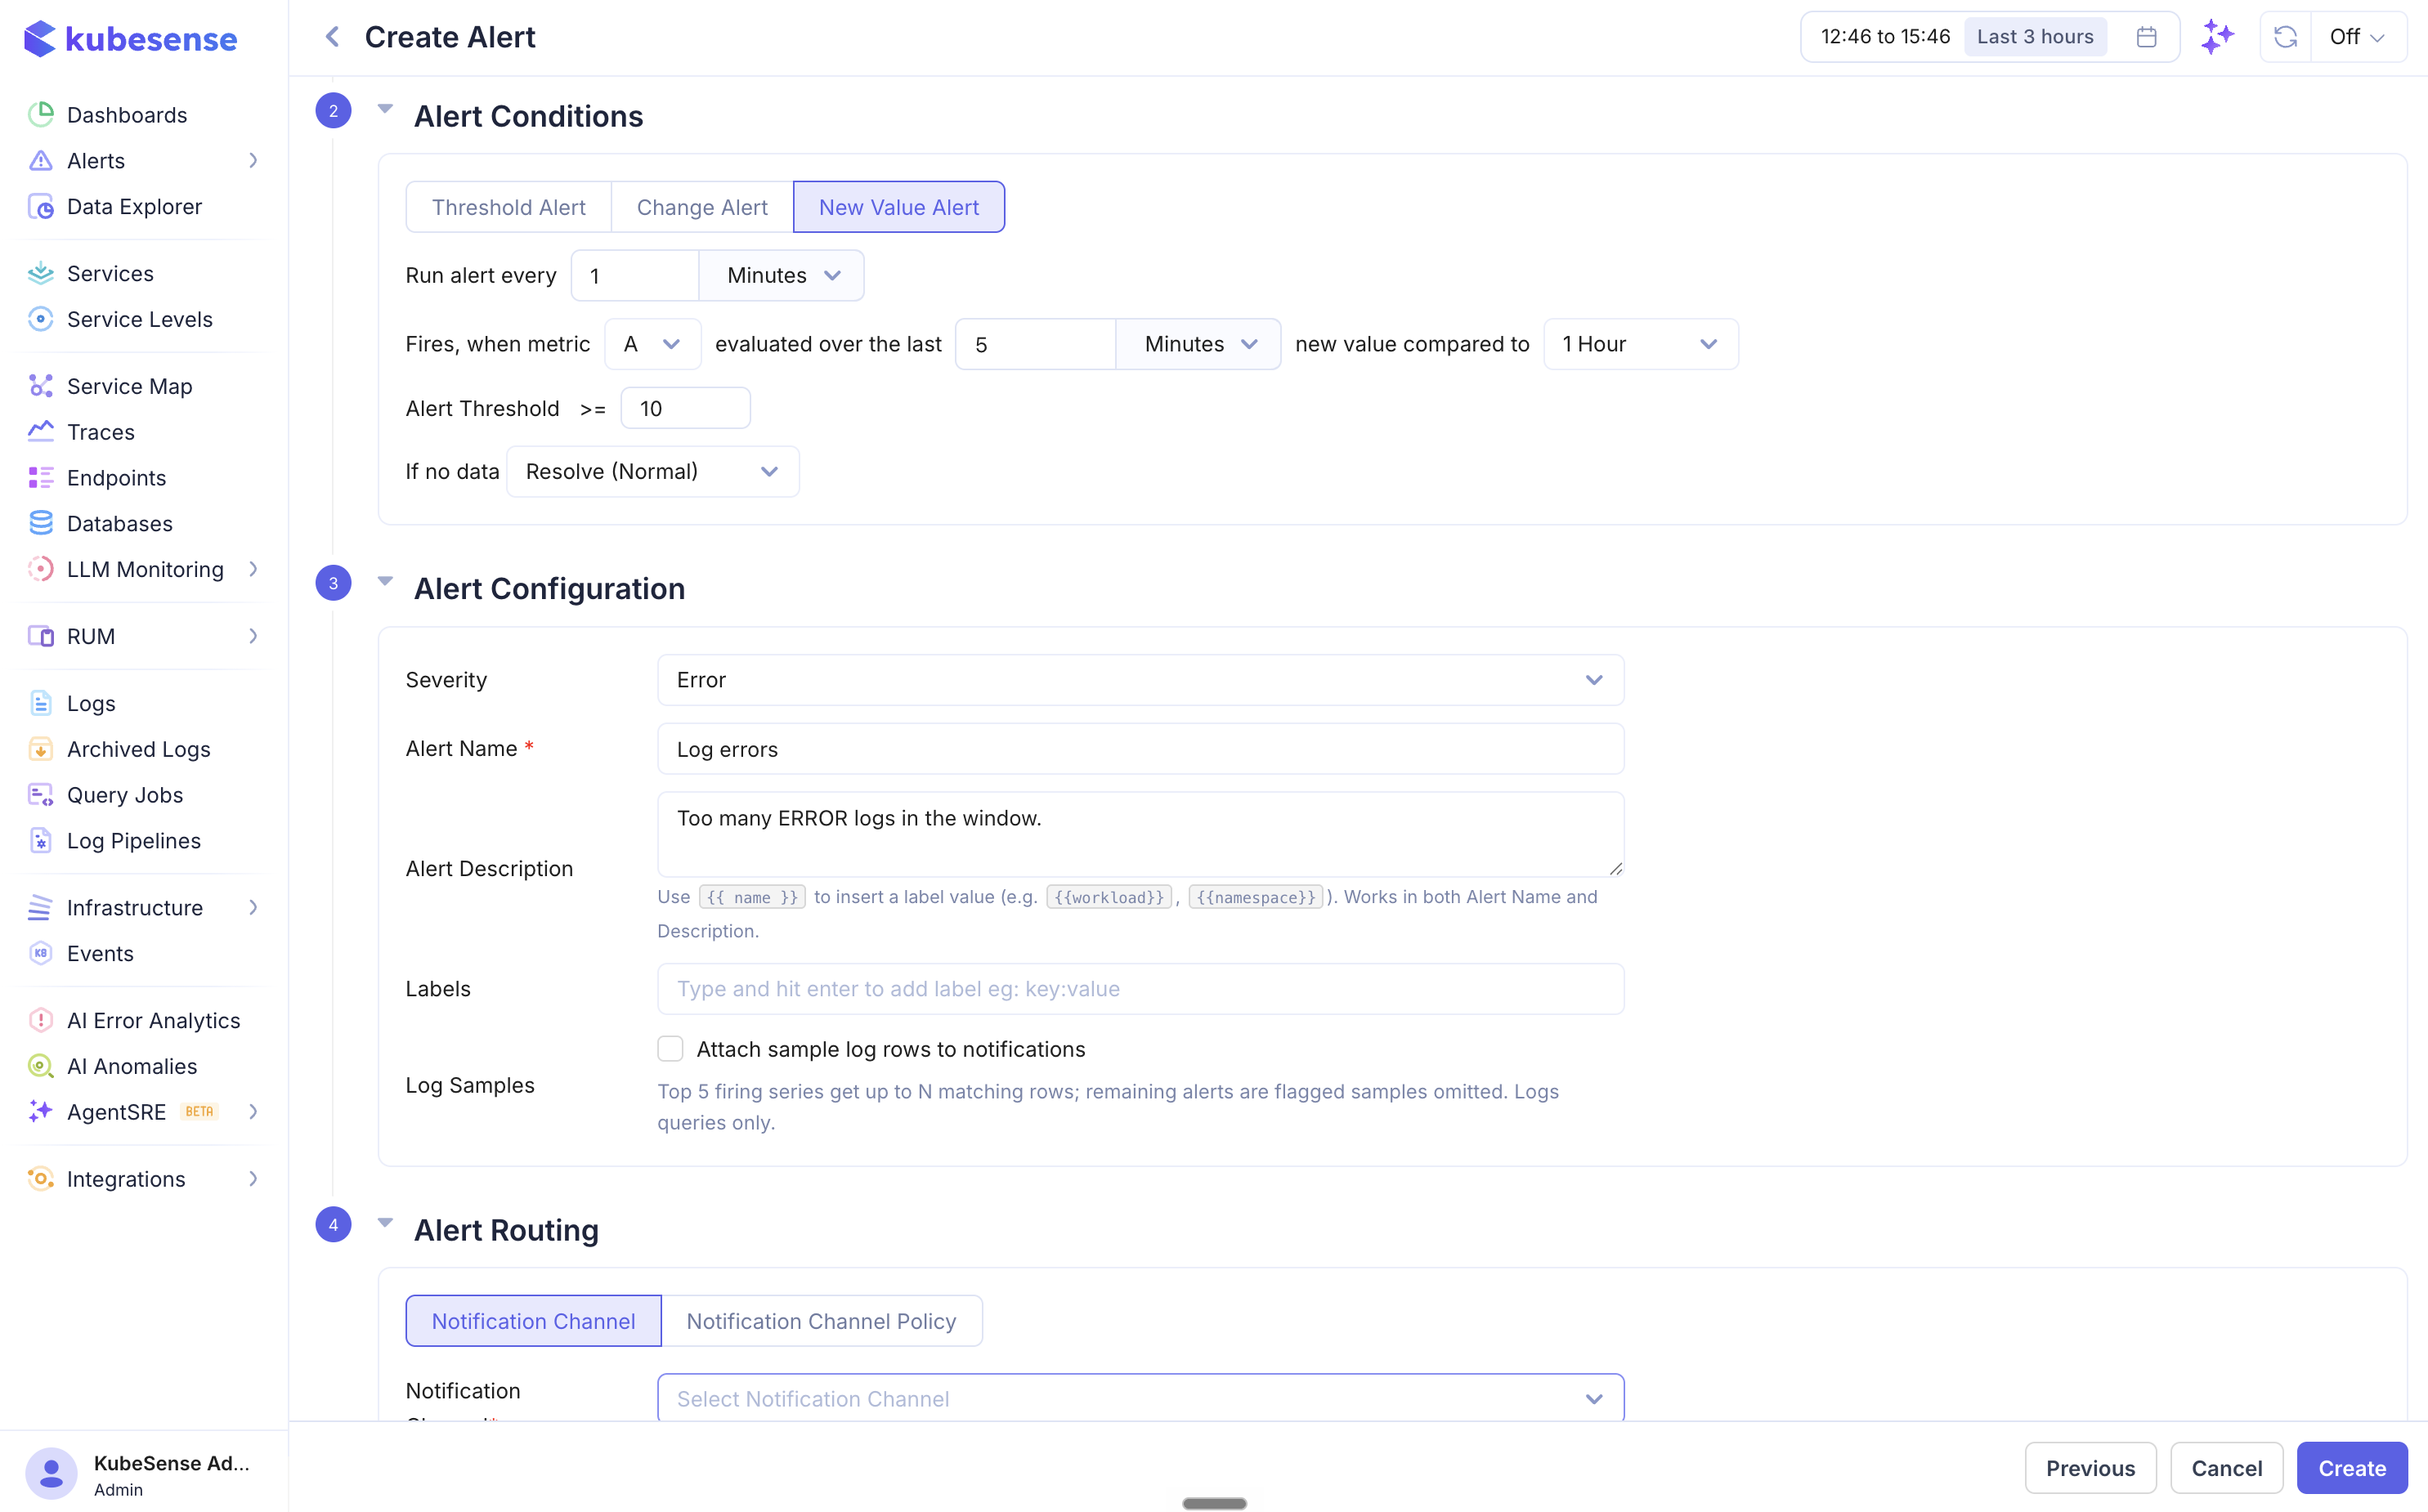
| Field | Description |
|---|---|
| New value compared to | The historical window to check against (e.g., 5 Minutes) |
Use new value alerts to detect previously unseen patterns — new error types, new endpoints, new log levels, or any other unexpected values appearing in your data.
No-data behavior
When an evaluation returns no data at all (a scrape gap, a sparse trace source, a deleted target), the rule's no-data setting decides what happens:
| Option | Behavior |
|---|---|
| Normal (default) | Treat no data as recovered — a firing alert resolves |
| Keep previous state | Hold the current state — a firing alert stays firing through the gap. Recommended for sparse sources (e.g. per-workload trace alerts on short windows) to avoid resolve/re-fire flapping. |
| Firing | Treat the disappearance of data itself as an incident and fire |
A value of 0 is real data, not "no data" — an error-count rule reading 0 during a quiet period resolves normally regardless of this setting.
Step 3 — Alert Configuration
| Field | Description |
|---|---|
| Severity | Critical, Error, Warning, or Info |
| Alert Name | A descriptive name for the alert. Supports {{label}} placeholders resolved per instance — e.g. High errors on {{workload}}. |
| Alert Description | Optional text explaining what the alert monitors and why (also supports placeholders) |
| Labels | Key-value pairs attached to the alert. Labels appear in notifications and can be used for routing (e.g., team:backend, env:production). |
| Attach samples | For logs/traces rules: capture up to N matching rows at fire time and attach them to notifications and the alert detail page, so responders see example offending lines without leaving the alert |
Step 4 — Alert Routing
Choose how notifications are delivered when the alert fires.
- Notification Channel — Select a specific notification channel (Slack, Teams, Email, etc.) to receive this alert
- Notification Channel Policy — Route alerts dynamically based on label matching. Alerts are sent to channels whose matching labels correspond to the alert's labels.
Alert Lifecycle
States
| State | Description |
|---|---|
| Normal | The alert condition is not met. The system continues evaluating at each interval. |
| Pending | The condition is met but the firing frequency requirement (e.g. more than N times) is not yet satisfied. No notification has been sent. |
| Firing | The alert condition is met and the required firing frequency is satisfied. Notifications are sent. |
State Transitions
- Normal → Firing — The condition is met and the firing frequency requirement is satisfied. A notification is sent and an alert event is recorded.
- Firing → Normal — The condition is no longer met (for
at_least_once: no breaches in the breach counting window; formore_than_once: breach count drops below the threshold; foralways: at least one evaluation did not breach). A resolved notification is sent. - Grouped (multi-series) rules track these transitions per instance — each series fires and resolves independently, and each transition is visible on that instance's event timeline.
Resolved Notifications
When an alert transitions from firing back to normal, a resolved notification is automatically sent to all configured channels, so your team knows the issue has been addressed.
Multi-Series Alerts
When a query uses Group By, the alert evaluates each group independently. For example, if you group by workload and three workloads breach the threshold, you receive three separate alert notifications — each with the specific workload name and value in the labels.
This is useful for scenarios like:
- Error count per workload exceeding a threshold
- Latency per namespace crossing an SLO boundary
- Request rate per service dropping below expected levels
Example Alert Rules
| Name | Type | What it monitors |
|---|---|---|
| Error log alert | Threshold | Error log count exceeds a limit |
| 499 Error Spike - traces | Change | Sudden increase in 499 status codes from trace data |
| Low Login Activity | Threshold | Login activity drops below expected levels |
| Failed Login Attempts >= 1 | Threshold | Any failed login attempt detected |
| Node max capacity | Threshold | Node CPU or memory approaching capacity |
| Detect Log level change | New Value | Unexpected log levels appearing |
| HTTP 500 Error Count | Threshold | HTTP 500 errors exceed a threshold |
| Application Error Alert | Threshold | Application error logs detected |