
Synthetic Monitoring
KubeSense Synthetic Monitoring runs scheduled checks against your APIs, websites and network endpoints from probe agents, and shows uptime, response times and failures under Synthetics in KubeSense. Checks run from agents inside your own clusters and VMs, so internal services are covered as well as public ones. Failures alert through the KubeSense notification channels you already use.
Synthetic Monitoring uses the MySQL, ClickHouse and metrics store your KubeSense installation already has: no extra databases.
How It Works
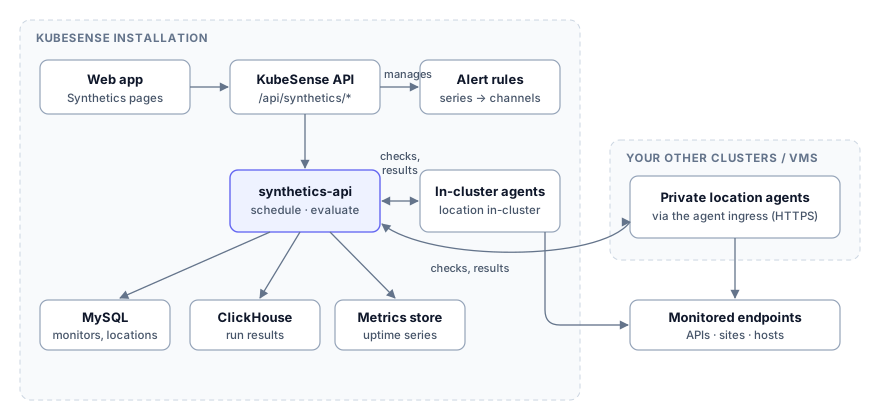
- synthetics-api is the control plane. It stores monitors and locations, hands checks to agents, evaluates results, and records uptime and outages. Users reach it only through the KubeSense API.
- Agents run the checks. They pull their checks from synthetics-api and send back the results. Each agent belongs to one location.
- Results are stored in ClickHouse; uptime and response-time series go to the metrics store, where alerts and dashboards read them.
- Alerts are KubeSense alert rules, one per monitor, kept in step with the monitor and delivered through your notification channels.
Concepts
| Term | Meaning |
|---|---|
| Monitor | One check of one target (a URL, host or test flow), with a type, an interval, the locations it runs from, assertions and alert settings |
| Run | One execution of a monitor from one agent, with its status, timings and assertion results |
| Location | A place checks run from. Every installation has an in-cluster location; you add your own for other clusters, networks or regions |
| Agent | A process in a location that runs checks. More agents in a location add redundancy |
| Suite | A named group of monitors that you view, run and alert on together |
| CI batch | A set of monitors run on demand from a CI/CD pipeline, with one pass/fail result |
| Outage | A period in which a monitor was down, recorded from the first failure to the recovery |
| Maintenance window | A period in which matching monitors do not alert or record outages |
Check Types
HTTP, TCP, DNS, SSL certificate, gRPC, ICMP ping, WebSocket, UDP, multistep API, MCP server, network path, Kubernetes resource and browser tests. See Check Types.
Sections
Getting started
- Deployment — Install Synthetic Monitoring on Kubernetes (Helm) or on a VM (Docker Compose)
- Configuration — Helm values, synthetics-api settings and agent settings
- Locations & Agents — The in-cluster location, private locations in other clusters and on VMs, and agent installation
User manual
- Monitors — Create, edit, run and manage monitors
- Check Types — What each check type tests and how to configure it
- Monitor Details & Runs — Uptime, response times, run history and run details
- Overview — The state of every monitor at a glance
- Suites — Group monitors and run them together
- Results & CI Batches — Search every run, and run monitors from CI/CD pipelines
- Alerts & Maintenance — How monitors alert, notification channels, muting and maintenance windows
- Settings — Monitor defaults, variables, tag rules and import/export
- Troubleshooting — Common problems and their fixes