AI Error Analytics
AI Error Analytics automatically detects, groups, and classifies errors across your entire infrastructure — including HTTP errors, gRPC failures, Kafka issues, container crashes, and unavailable deployments. Instead of manually sifting through logs and traces, you get a centralized view of all recorded incidents with the ability to slice, dice, and drill down to the raw telemetry.
Error Overview
The main view shows all errors grouped by type for the selected cluster and time period.
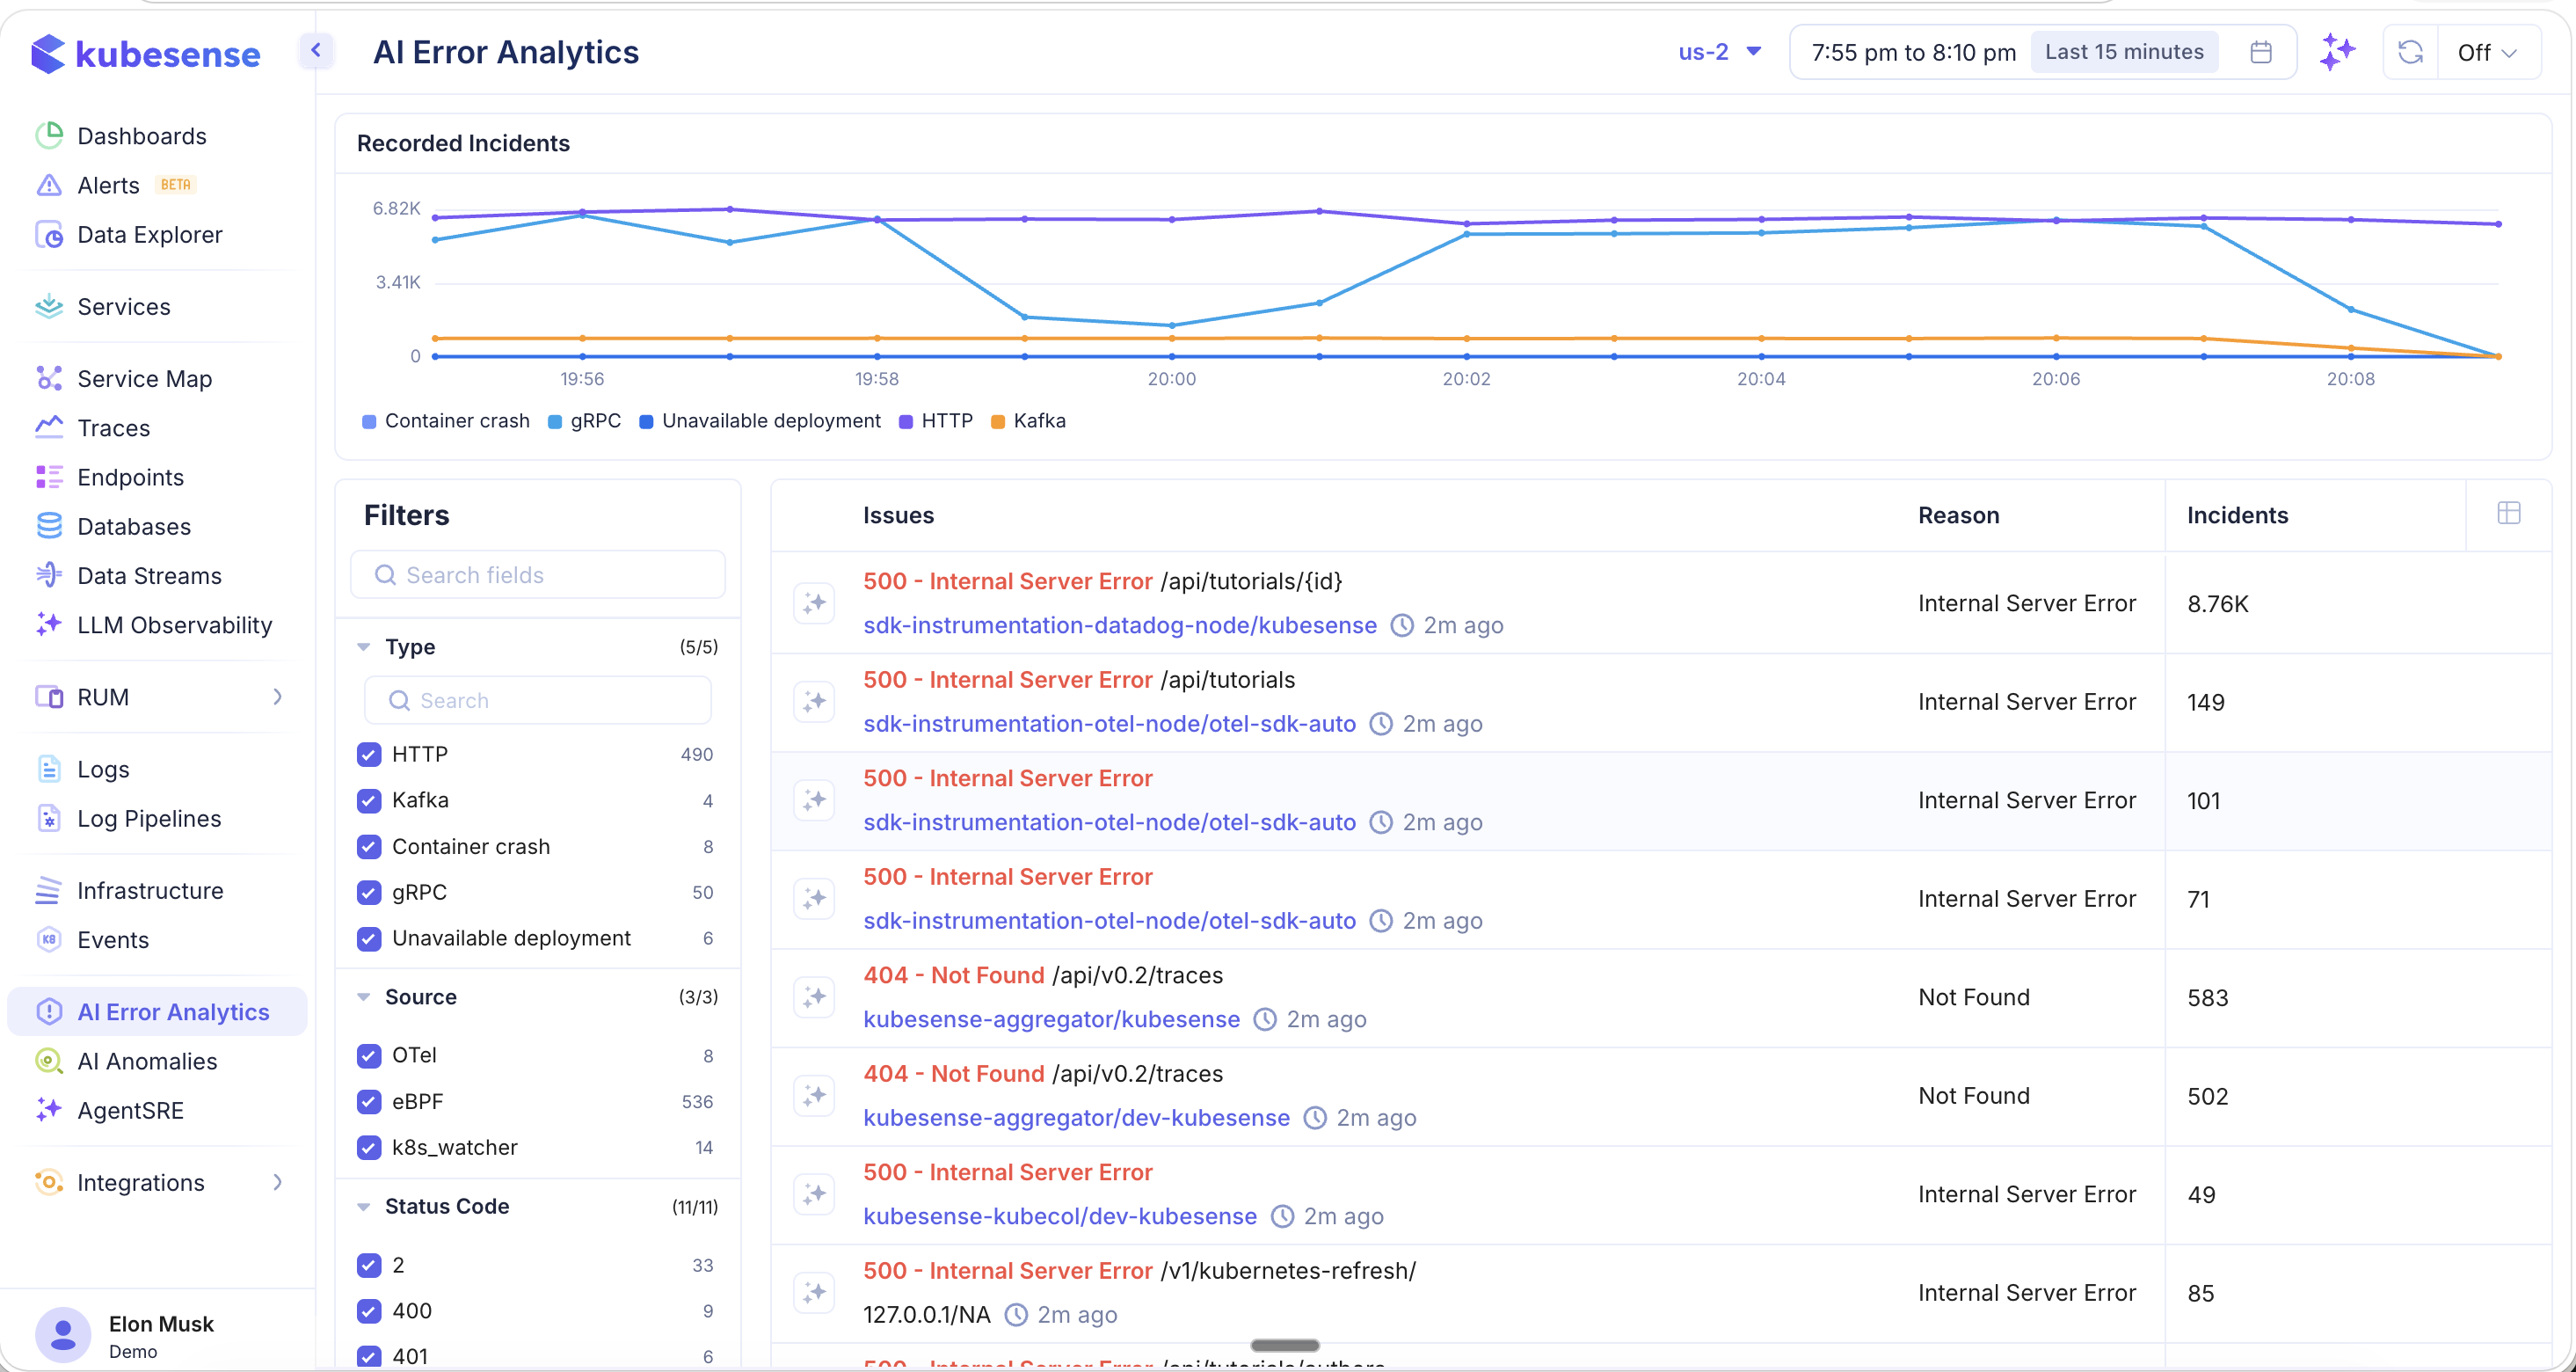
Recorded Incidents Chart
The time-series chart at the top shows Recorded Incidents over time, color-coded by error type:
- Container crash — Pod/container crash events (OOMKilled, ExitCode errors)
- gRPC — gRPC protocol errors
- Unavailable deployment — Services that cannot be reached or are not ready
- HTTP — HTTP protocol errors (4xx, 5xx status codes)
- Kafka — Kafka message processing errors
Issues Table
Each row represents a grouped error pattern with:
| Column | Description |
|---|---|
| Issues | Error description with status code and resource path (e.g., 500 - Internal Server Error /api/tutorials/{id}) |
| Service | The affected workload and namespace (e.g., sdk-instrumentation-datadog-node/kubesense) with a time indicator showing when the error was last seen |
| Reason | Root cause classification (e.g., Internal Server Error, Not Found, OOMKilled, Error) |
| Incidents | Total count of occurrences for this error group |
Click the star icon next to any issue to mark it for follow-up.
Filters
The left-hand filter panel provides extensive faceted filtering to narrow down errors.
Type
Filter by error category — each type shows its count:
- HTTP — HTTP protocol errors (e.g., 490 incidents)
- Kafka — Kafka processing errors (e.g., 4 incidents)
- Container crash — Container/pod crash events (e.g., 8 incidents)
- gRPC — gRPC protocol errors (e.g., 50 incidents)
- Unavailable deployment — Deployment reachability issues (e.g., 6 incidents)
Source
Filter by the data source that detected the error:
- OTel — OpenTelemetry SDK traces
- eBPF — Kernel-level auto-instrumented traffic
- k8s_watcher — Kubernetes event watcher (for container crashes and deployment issues)
Status Code
Filter by specific HTTP/gRPC status codes (e.g., 2, 400, 401, 404, 500, 503) to isolate specific error types.
Namespace
Filter by Kubernetes namespace to focus on errors from a specific team or application group.
Column Picker
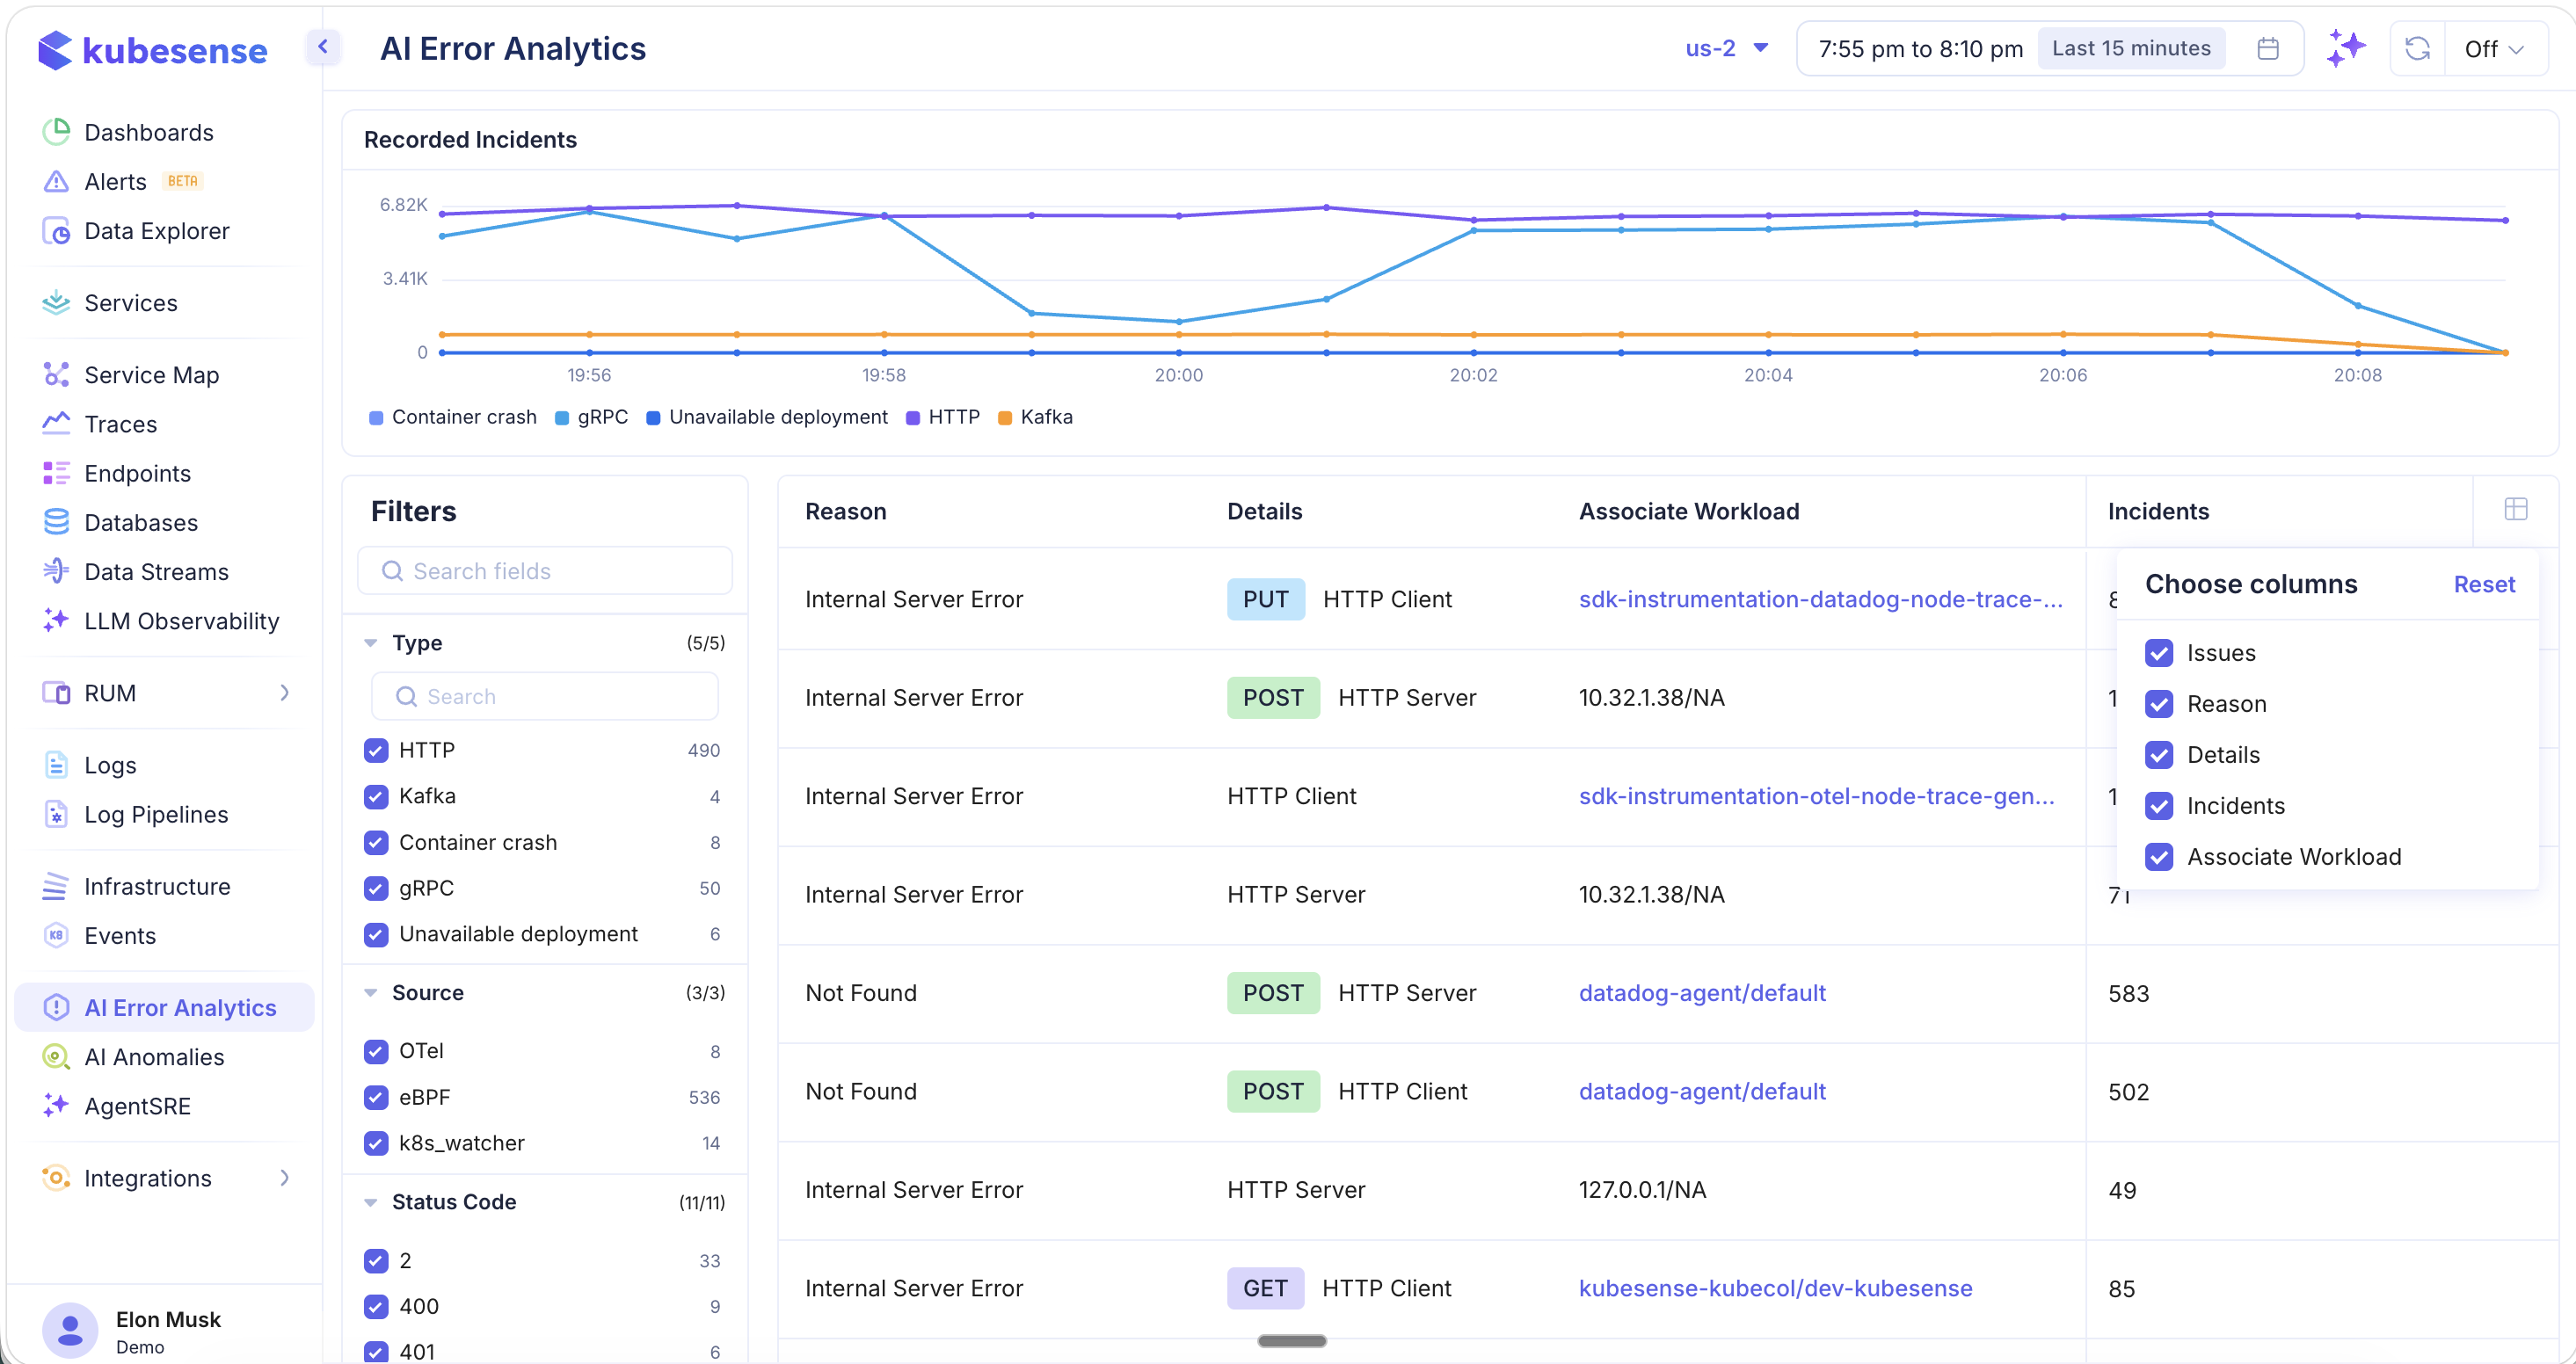
Click the column picker icon to customize which columns are displayed. Available columns:
- Issues — Error description and service
- Reason — Error classification
- Details — Protocol role and HTTP method badge (GET, POST, PUT)
- Incidents — Occurrence count
- Associate Workload — The workload and namespace link associated with the error
With additional columns enabled, you can see the HTTP method (PUT, POST, GET), whether the error was from an HTTP Client or HTTP Server perspective, and the exact workload involved — making it easier to identify whether the issue is on the caller or the callee side.
Drilling into Error Traces
Click any error row to navigate directly to the Traces page, pre-filtered to show only the raw telemetry data related to that specific error group.
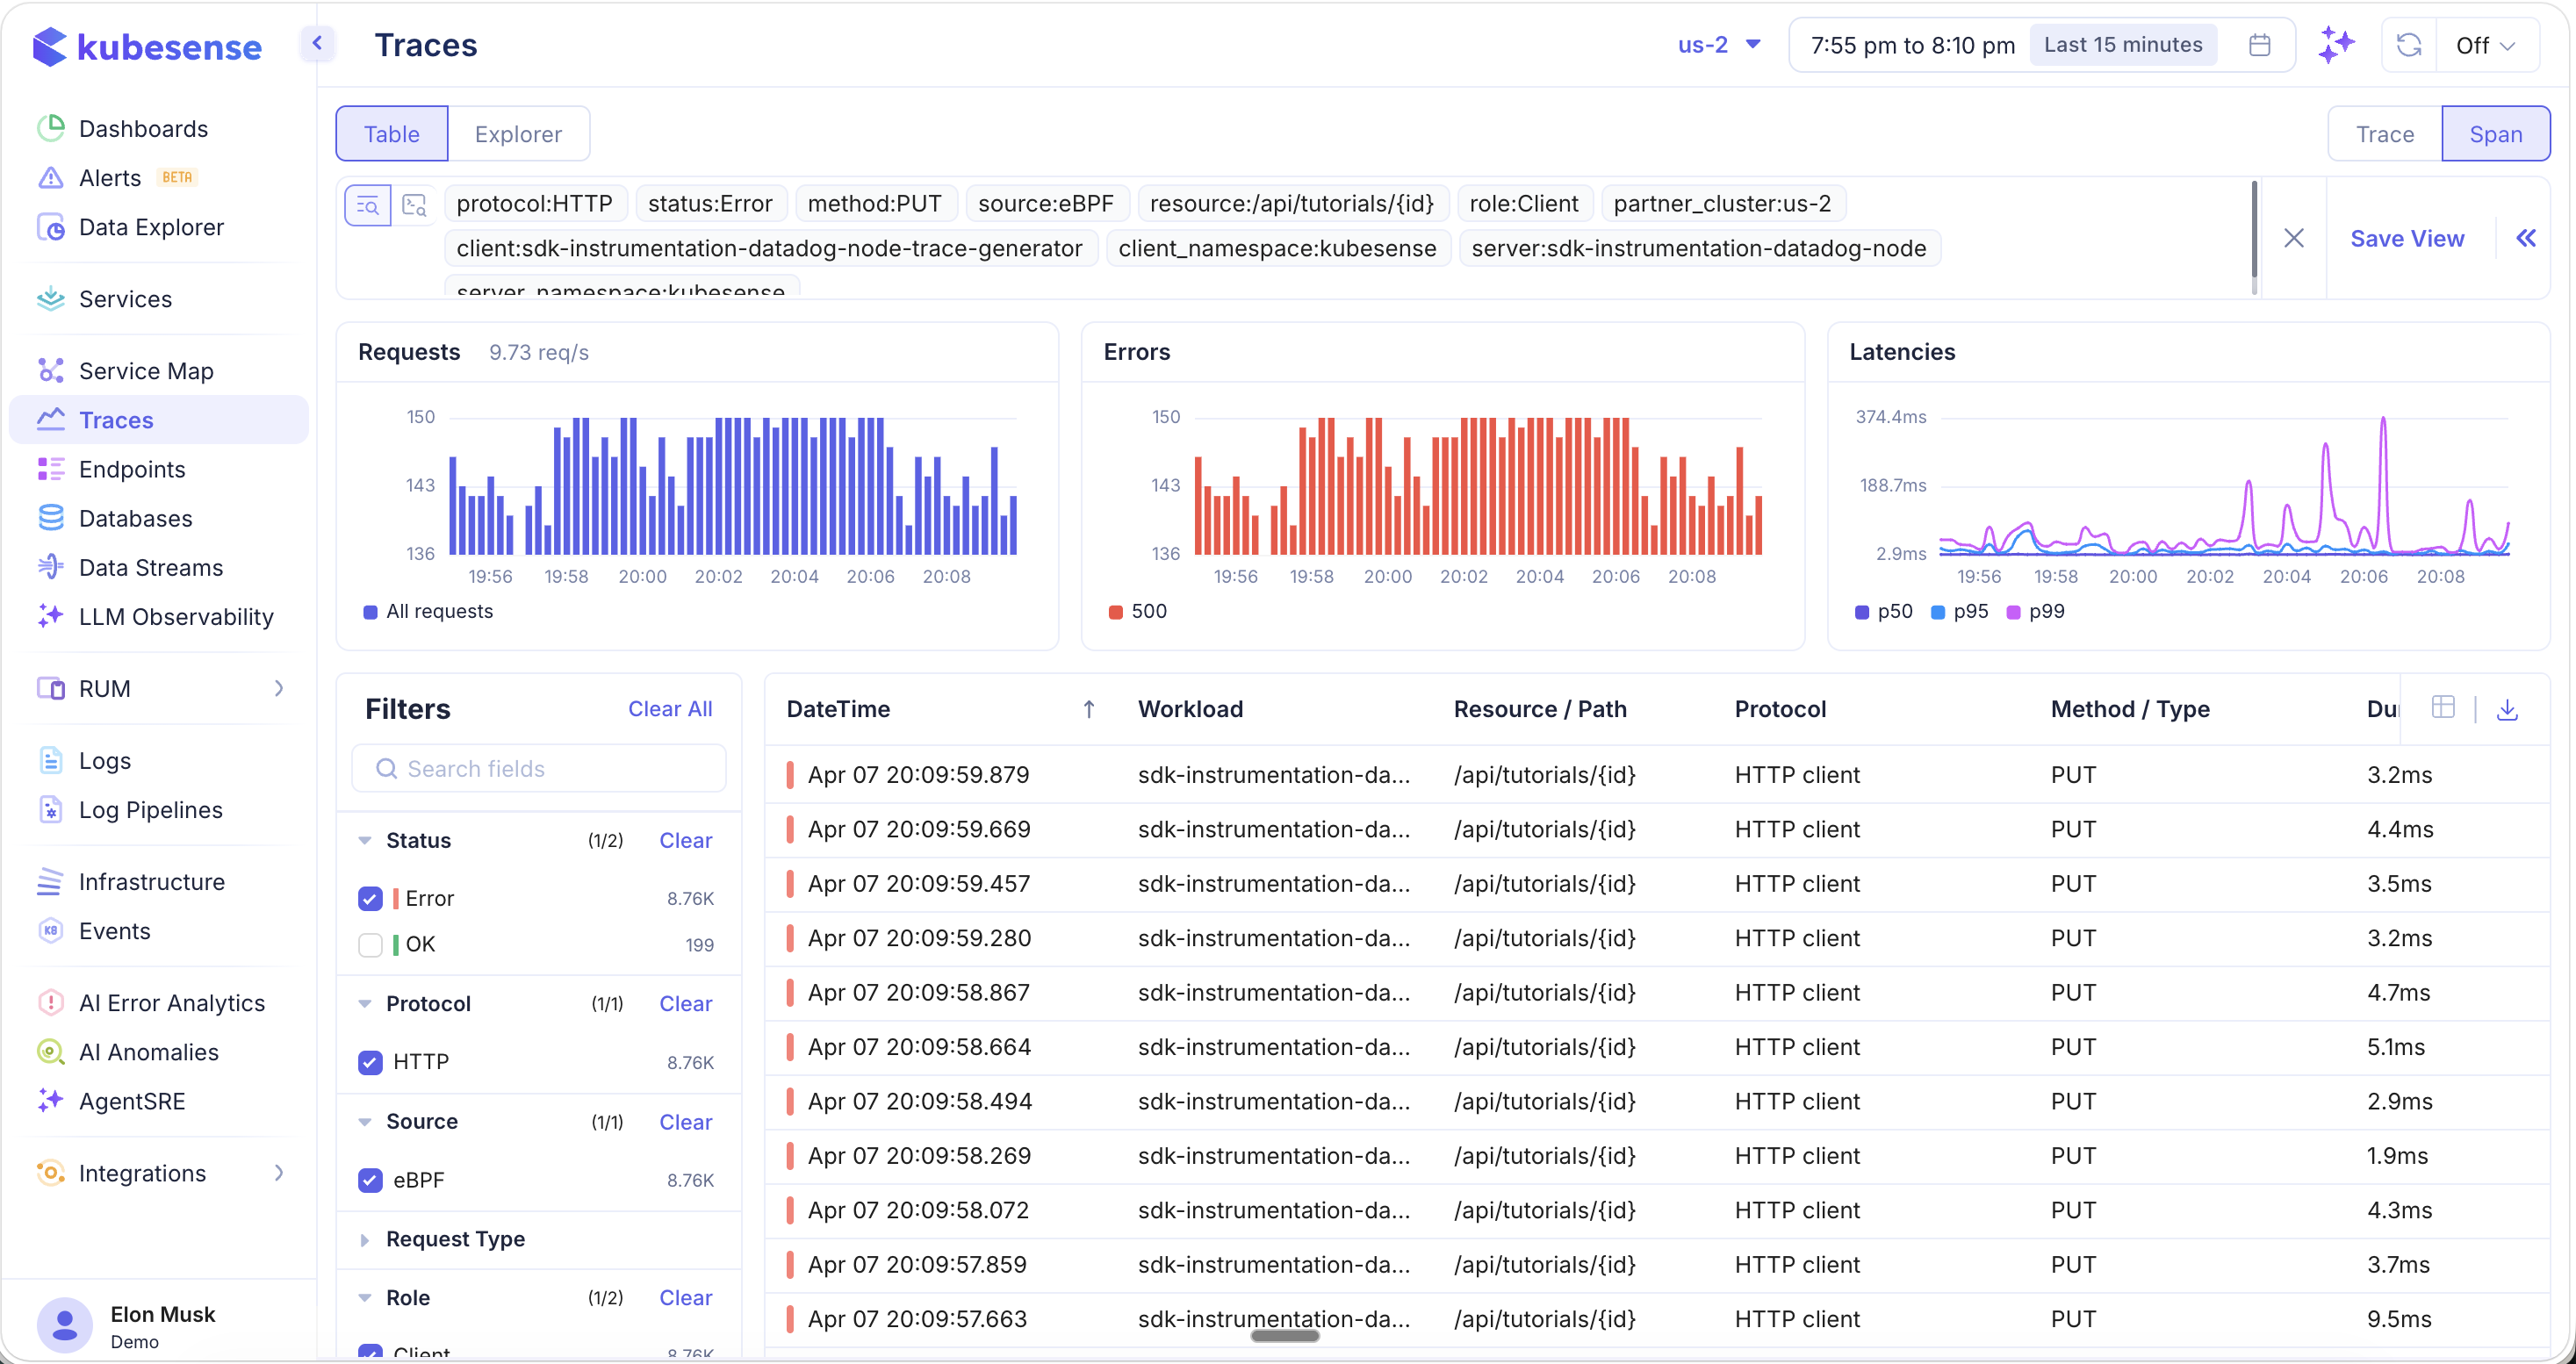
All relevant filters are automatically applied — protocol, status, method, source, resource path, role, client, server, namespace, and cluster. From the Traces page you can:
- Browse all individual error traces for this issue
- See the Requests, Errors, and Latencies charts scoped to this error
- Click into any trace for the full waterfall, flamegraph, metrics, logs, and tags
- Save the filtered view for ongoing monitoring
This seamless navigation from grouped errors to raw traces eliminates the need to manually construct complex filter queries.
Container Crash Analysis
Filter by Container crash type to see all infrastructure-level failures:
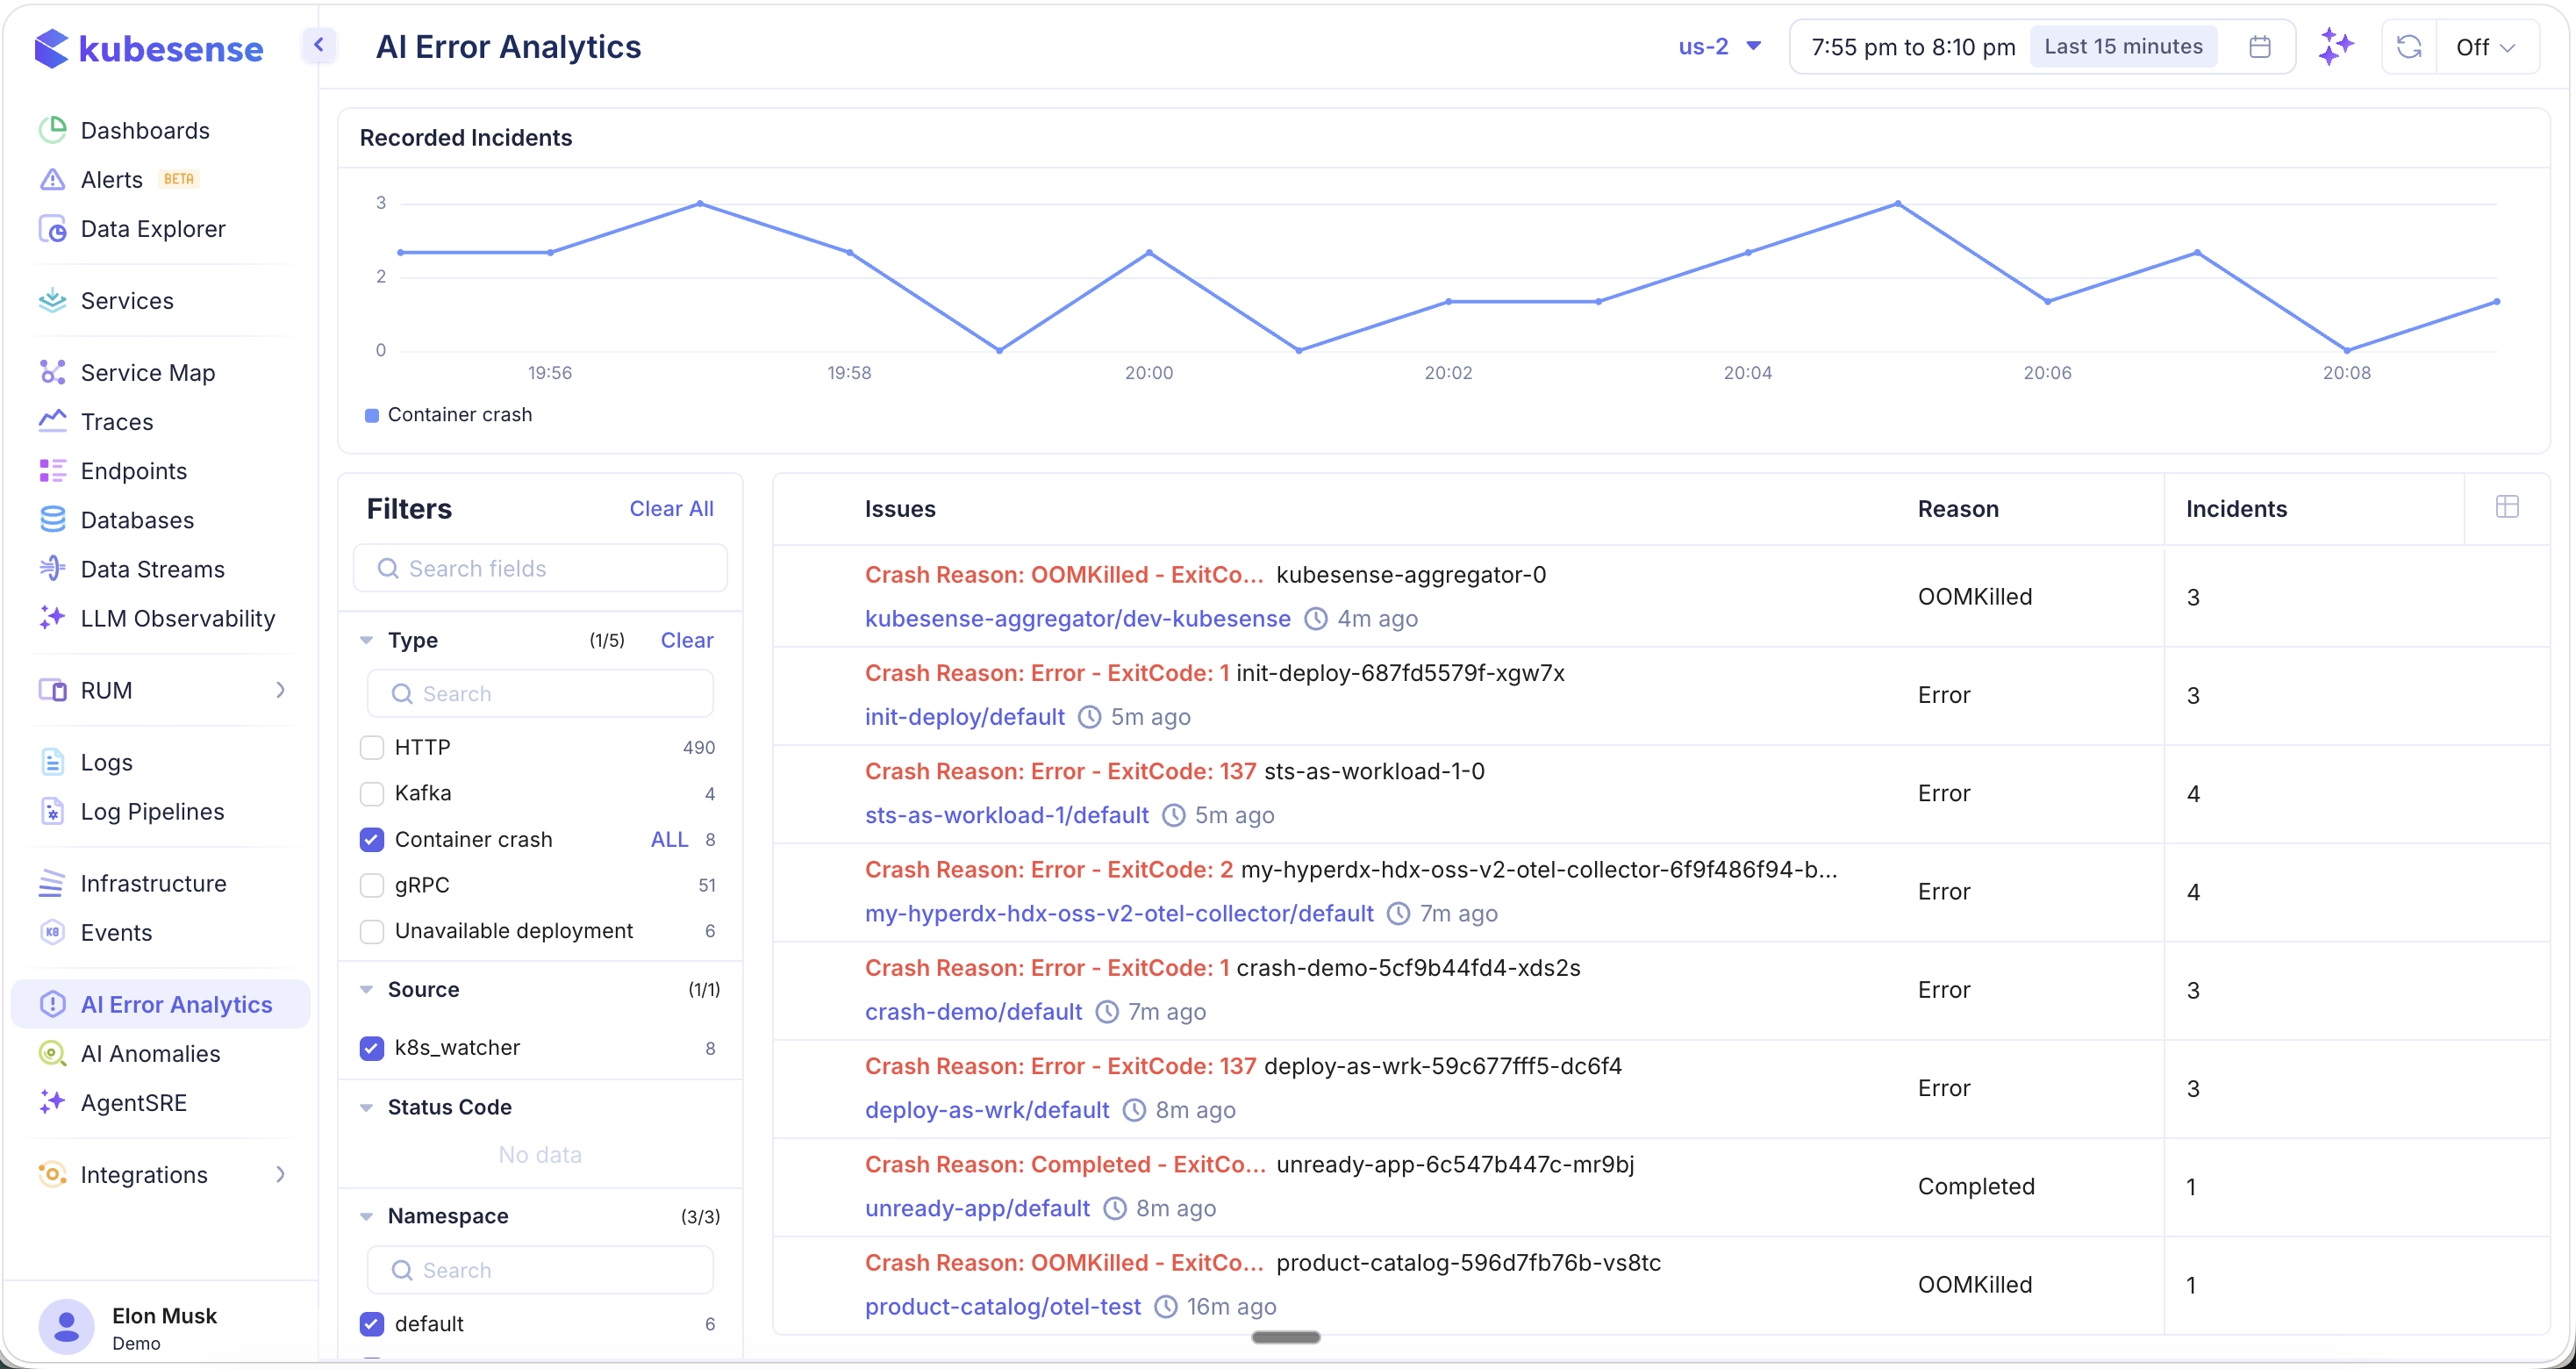
Container crash errors include:
- OOMKilled — Container killed due to exceeding memory limits (e.g.,
Crash Reason: OOMKilled - ExitCode... kubesense-aggregator-0) - Error with ExitCode — Container exited with a non-zero exit code (e.g.,
Crash Reason: Error - ExitCode: 137,ExitCode: 1,ExitCode: 2) - Completed — Container completed but was not expected to exit
Each crash shows:
- The pod name and workload/namespace where the crash occurred
- How long ago the crash happened (e.g., "4m ago", "7m ago", "16m ago")
- The Reason classification (OOMKilled, Error, Completed)
- The Incidents count showing how many times the crash has occurred
The source for container crash detection is k8s_watcher, which monitors Kubernetes events in real time. The Recorded Incidents chart updates to show only container crash events, helping you identify patterns like recurring OOMKilled events or cascading failures.
Use Cases
- Error triage — Quickly see all errors across your infrastructure ranked by incident count, without manually searching through logs or traces
- Incident investigation — Click any grouped error to drill into the raw traces with all filters pre-applied
- Container crash monitoring — Monitor OOMKilled events, exit code errors, and deployment failures in one place
- Cross-service error correlation — See which services and endpoints are generating the most errors and from which instrumentation sources
- Proactive monitoring — Star important error groups and monitor their incident counts over time