AI Anomalies
AI Anomalies uses machine learning to automatically detect unusual patterns in your API error rates and latencies by building a dynamic baseline of normal behavior. Instead of relying on static thresholds, KubeSense learns from your actual traffic patterns and triggers anomalies only when there is a significant breach from the expected baseline range.
How Baseline Learning Works
KubeSense continuously learns from your traffic patterns across multiple dimensions:
- Weekday vs. weekend — Traffic patterns often differ significantly between business days and weekends
- Business hours vs. non-business hours — Peak traffic during working hours, lower traffic overnight
- Peak hours and peak days — Recurring high-traffic periods (e.g., Monday mornings, end-of-month processing)
- Seasonal patterns — Longer-term trends that repeat weekly or monthly
Anomaly detection starts working immediately — you will see anomalies from day one. However, the quality and accuracy of detection improves significantly over time as the model accumulates more data. After approximately one month of data, the baseline calculation becomes highly accurate, and false positives are minimized.
Anomalies Overview
The Anomalies page shows all detected anomalies for the selected cluster and time period.
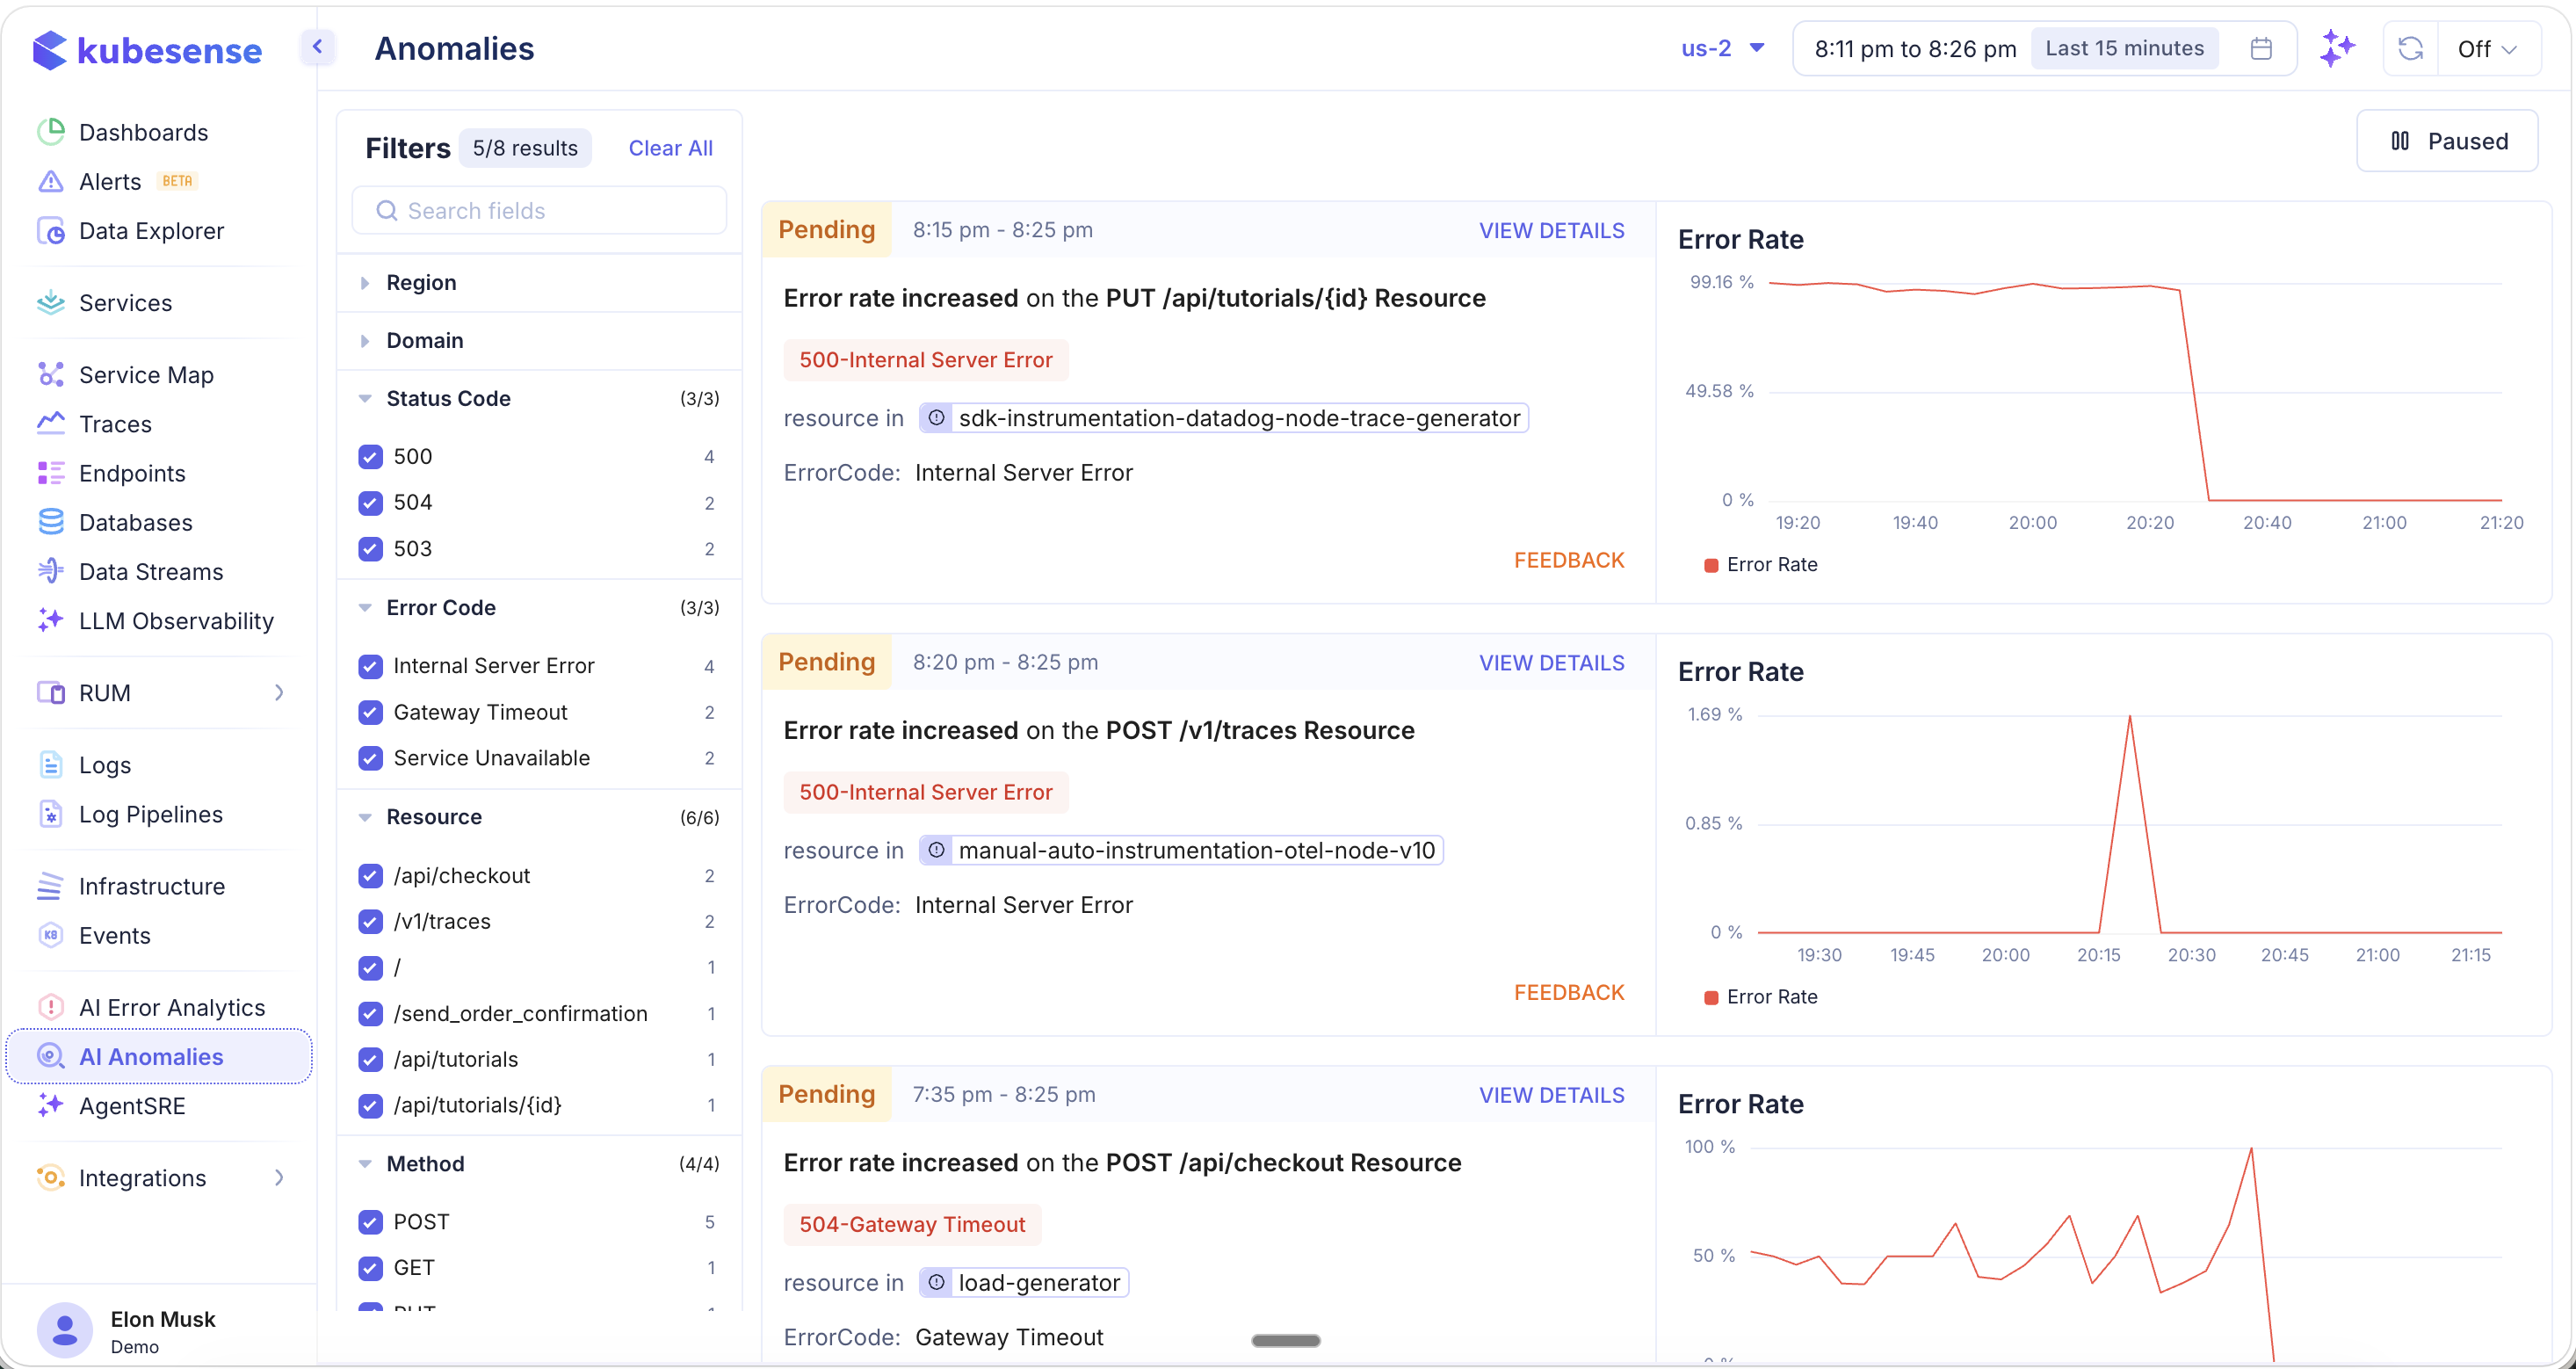
Each anomaly is displayed as a card with:
| Field | Description |
|---|---|
| Status | Current status — Pending (orange), Active, or Resolved |
| Time Range | When the anomaly was detected (e.g., "8:15 pm - 8:25 pm") |
| Description | What was detected (e.g., "Error rate increased on the PUT /api/tutorials/{id} Resource") |
| Error Badge | The specific error type (e.g., 500-Internal Server Error, 504-Gateway Timeout) |
| Resource | The affected workload with a link to navigate to it |
| ErrorCode | The error classification (e.g., Internal Server Error, Gateway Timeout) |
| Error Rate Chart | A time-series visualization showing the anomalous spike against the baseline |
| VIEW DETAILS | Link to see full anomaly context including correlated metrics and traces |
| FEEDBACK | Provide feedback on whether the detection was accurate to improve the model |
Filters
The left-hand filter panel provides extensive faceted filtering to narrow down anomalies. The filter count (e.g., "5/8 results") shows how many anomalies match your current filters.
Region
Filter by geographic region where the anomaly was detected.
Domain
Filter by service domain.
Status Code
Filter by the HTTP status code associated with the anomaly (e.g., 500, 504, 503). Each status code shows its anomaly count.
Error Code
Filter by error classification:
- Internal Server Error — 5xx server-side failures
- Gateway Timeout — 504 upstream timeout errors
- Service Unavailable — 503 service overload or maintenance
Resource
Filter by the specific API resource/path where the anomaly was detected (e.g., /api/checkout, /v1/traces, /send_order_confirmation, /api/tutorials, /api/tutorials/\{id\}).
Method
Filter by HTTP method:
- POST, GET, PUT, DELETE
Pause / Resume Detection
Use the Paused / Active toggle in the top-right corner to control anomaly detection:
- Active — Anomaly detection is running continuously, evaluating incoming metrics against the learned baseline
- Paused — Anomaly detection is temporarily stopped. No new anomalies will be generated, but existing anomalies remain visible
This is useful during planned maintenance windows, deployments, or load tests where expected traffic changes would otherwise trigger false anomalies.
Detection Types
KubeSense detects anomalies across two primary metric types:
Error Rate Anomalies
Triggered when the error rate for an endpoint significantly exceeds the learned baseline. The error rate chart on each anomaly card shows the spike relative to normal behavior.
Latency Anomalies
Triggered when response latencies (P50, P95, P99) deviate significantly from the expected range, indicating performance degradation even when there may not be explicit errors.
Actions
- View Details — See the full anomaly context including the baseline range, correlated metrics, affected traces, and timeline
- Feedback — Mark the anomaly as accurate or inaccurate to help the model improve its detection over time. This feedback loop is critical for reducing false positives and tuning the model to your specific environment.
Use Cases
- Early warning system — Detect performance degradation or rising error rates before they escalate into full incidents
- Post-deployment monitoring — Watch for anomalies after a new deployment to catch regressions that static thresholds might miss
- Baseline-aware alerting — Avoid false positives from expected traffic variations (e.g., weekend traffic drops, peak hour surges)
- Root cause investigation — Use anomaly details to drill into the affected endpoint, view correlated traces, and identify the underlying cause
- Continuous improvement — Provide feedback on detected anomalies to improve detection accuracy over time