AgentSRE
AgentSRE is KubeSense's AI-powered SRE companion that helps you investigate issues, perform root cause analysis, and answer questions about your infrastructure — all through a conversational interface backed by your actual observability data. Instead of writing complex queries or navigating between multiple dashboards, you can ask questions in natural language and get data-driven answers in seconds.
Getting Started
AgentSRE opens with a clean chat interface and a prompt to "Investigate anything". You can type any question about your infrastructure, services, logs, traces, or metrics.
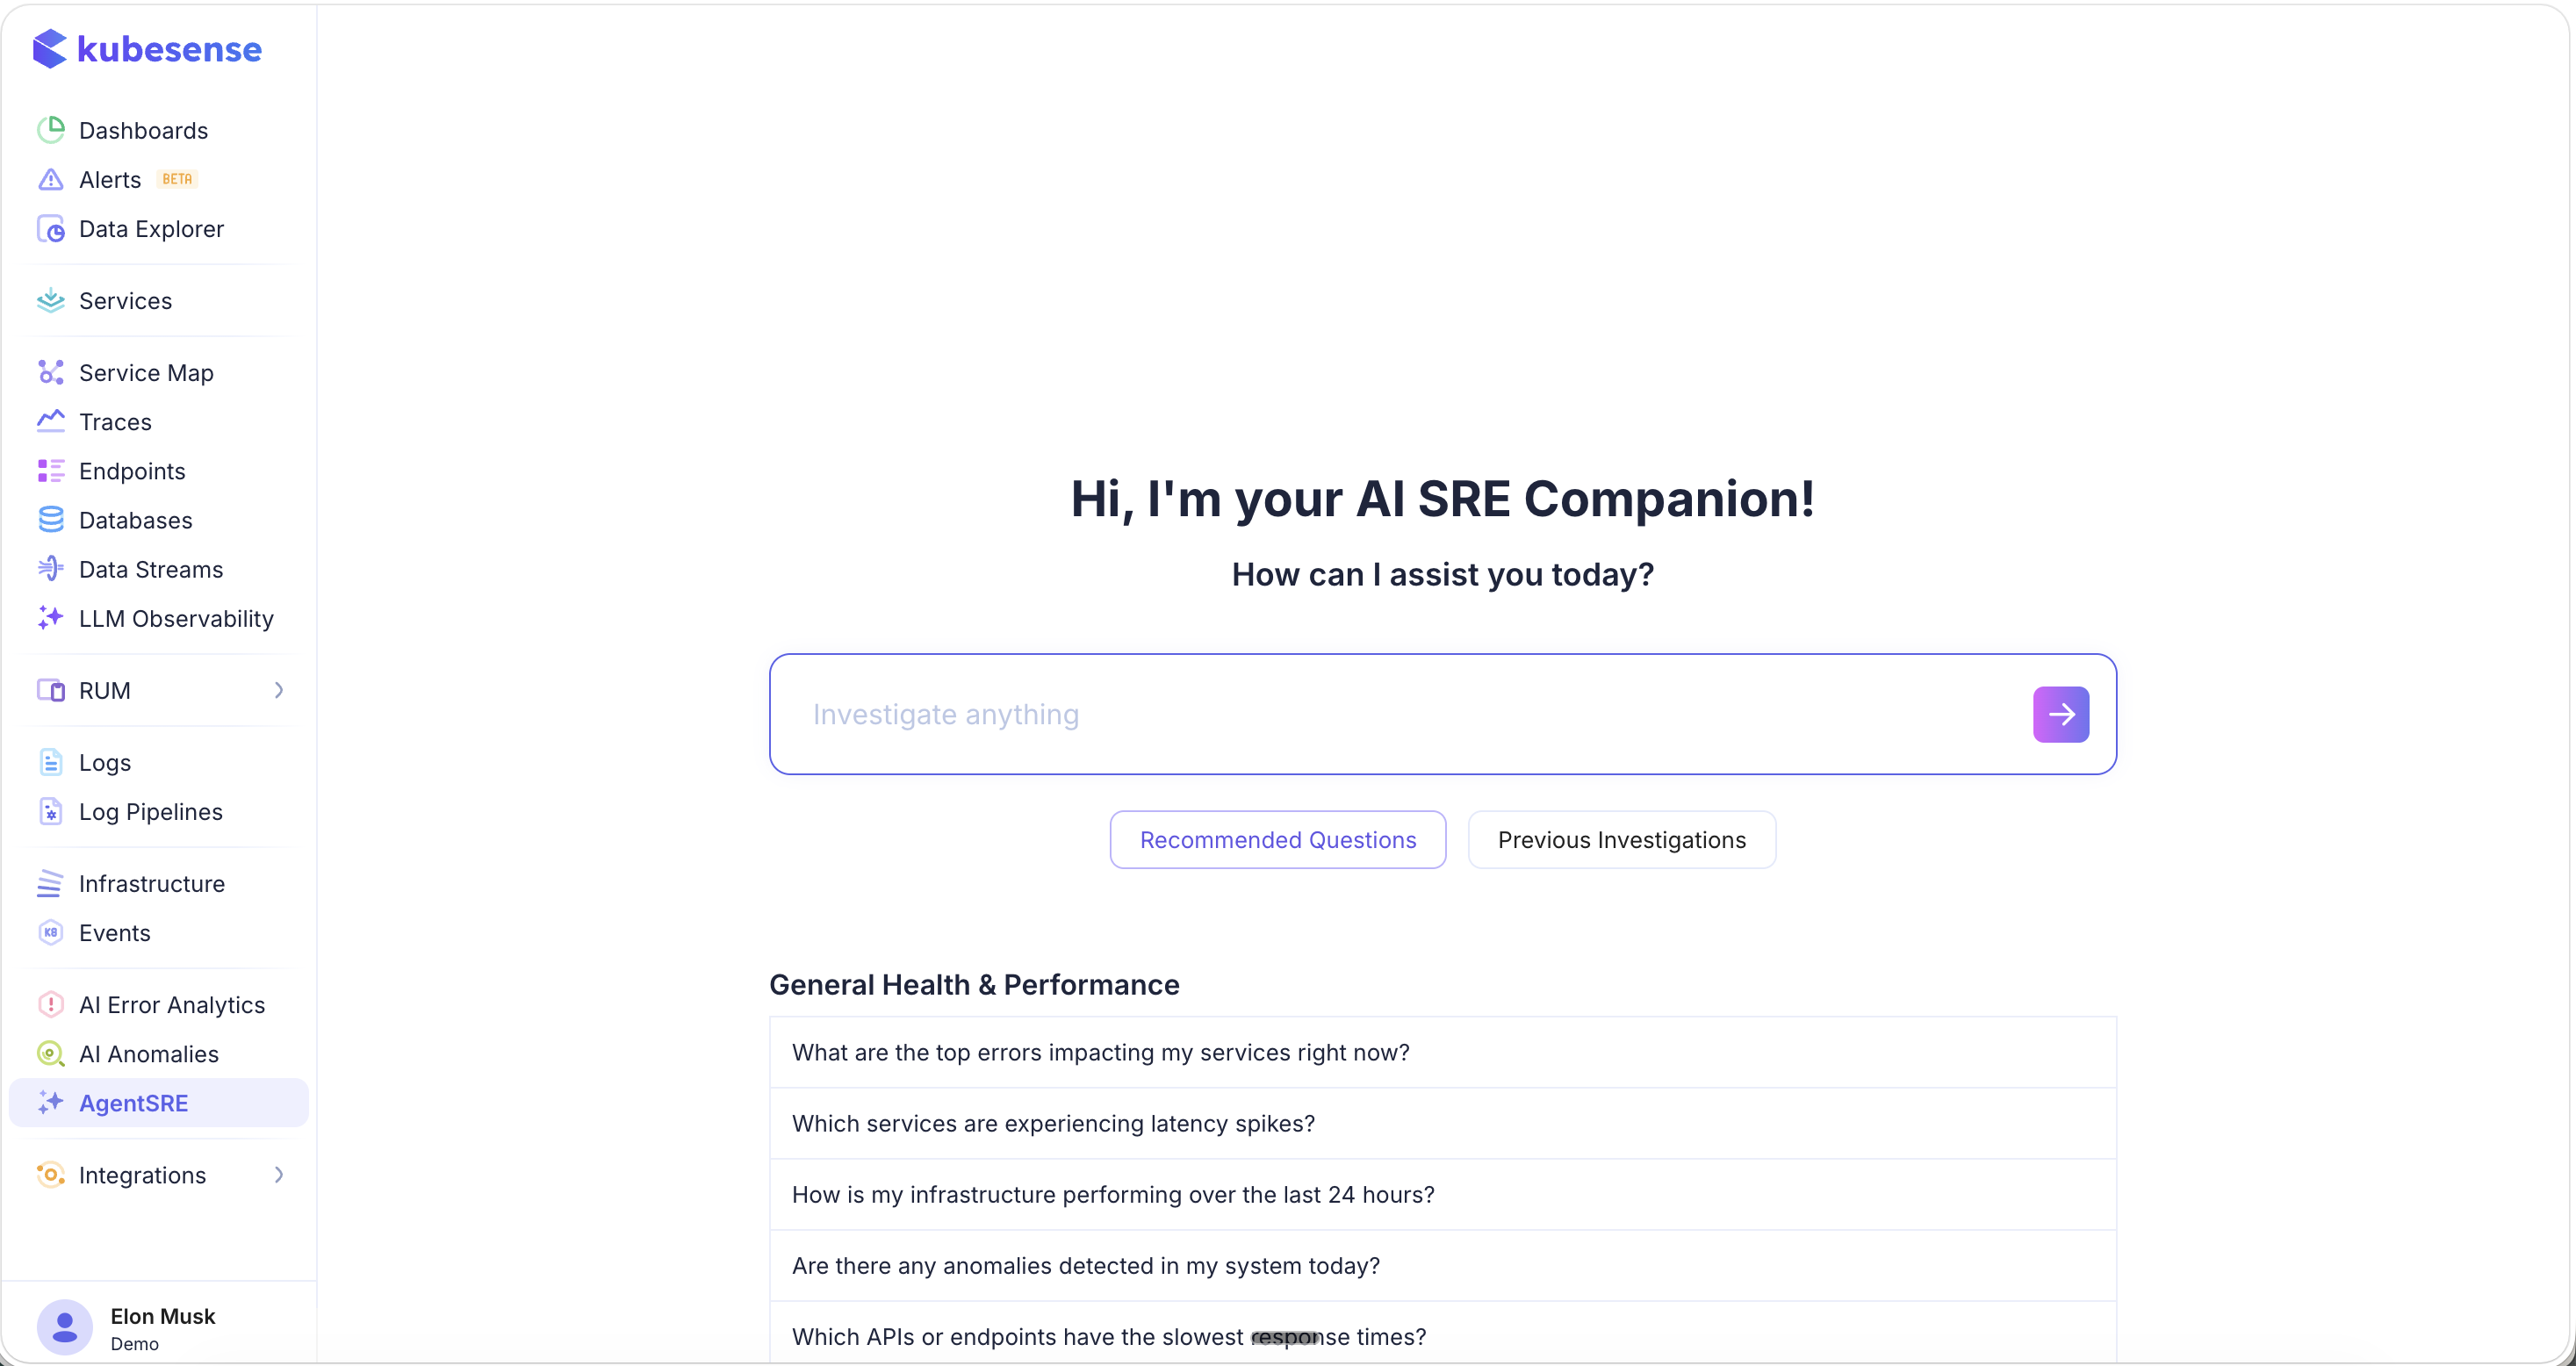
Two quick-access buttons help you get started:
- Recommended Questions — Pre-built questions organized by category to help you explore common investigation scenarios
- Previous Investigations — Access past investigation results for reference and continuity
Recommended Questions
AgentSRE provides suggested questions under General Health & Performance:
- "What are the top errors impacting my services right now?"
- "Which services are experiencing latency spikes?"
- "How is my infrastructure performing over the last 24 hours?"
- "Are there any anomalies detected in my system today?"
- "Which APIs or endpoints have the slowest response times?"
Click any suggested question to instantly start the investigation, or type your own custom question.
Natural Language Querying
AgentSRE translates your natural language questions into precise queries against your observability data and presents the results in a clear, actionable format.
Example: Log Analysis
Ask a question like "get me count of error logs in last 30 mins" and AgentSRE will:
- Understand the intent and generate the appropriate query
- Execute it against your data
- Present the results with analysis and follow-up suggestions
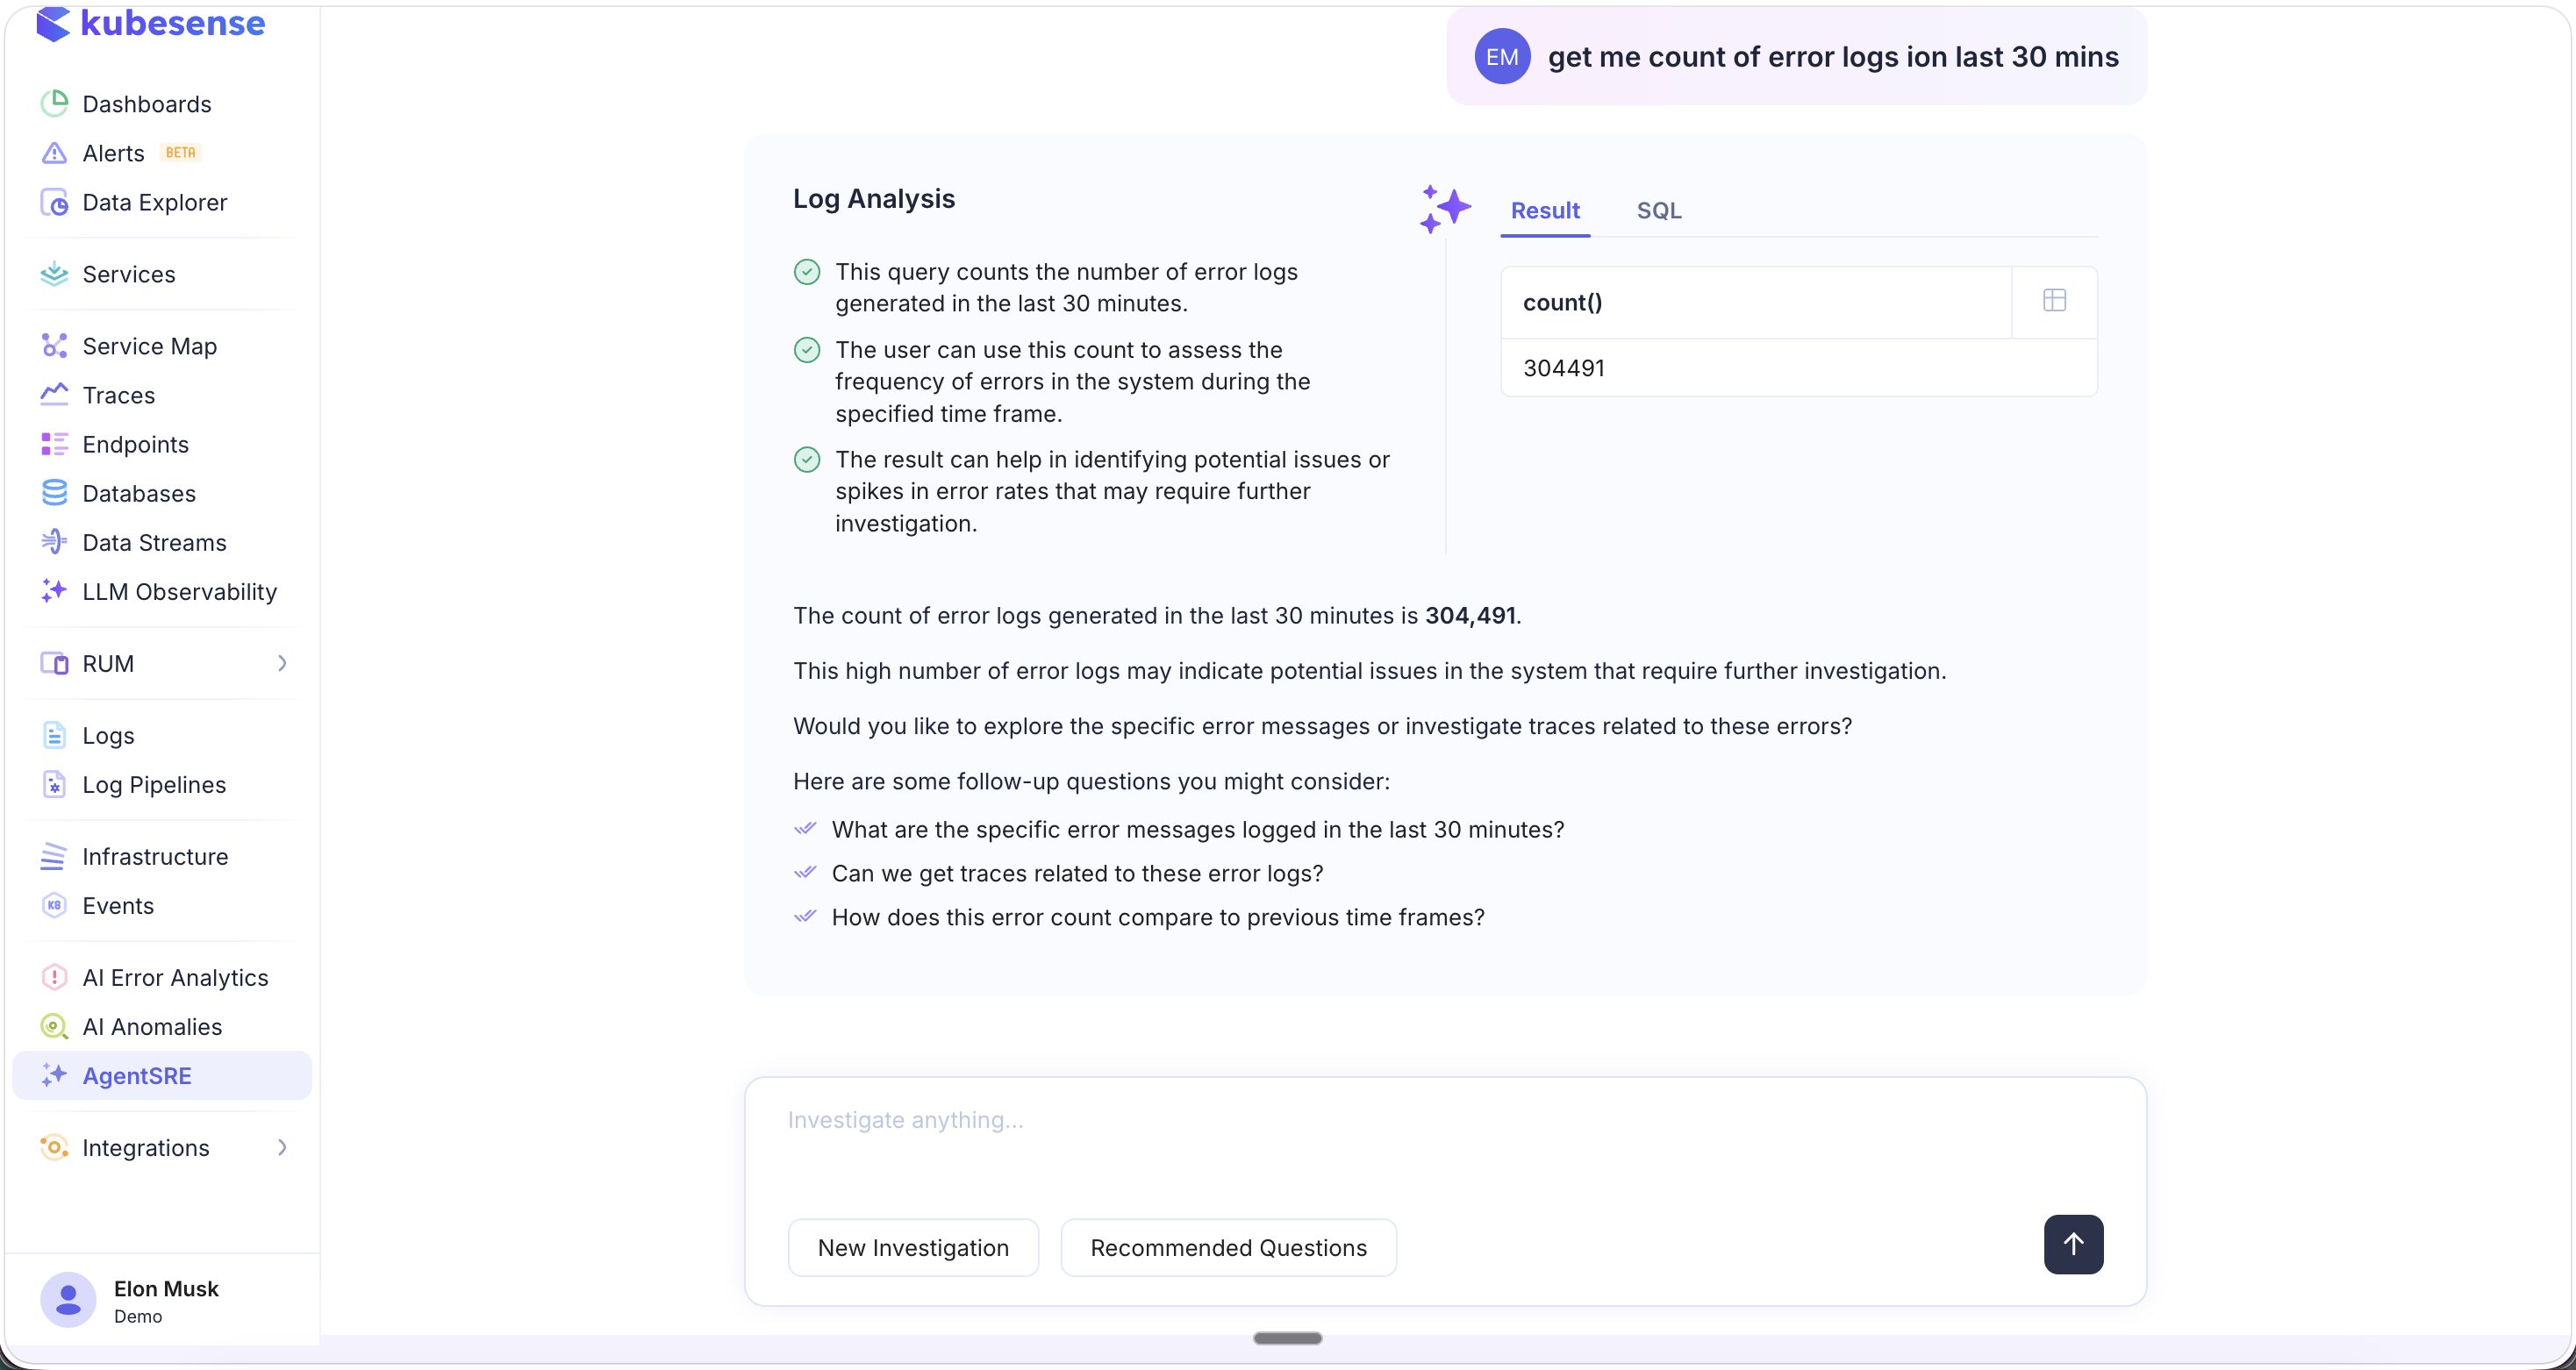
The response includes:
- Analysis bullets — Key takeaways from the result (e.g., query explanation, how to use the count, potential implications)
- Result tab — The actual data returned (e.g.,
count() = 304,491) - Summary — A natural language explanation of the findings and whether they warrant further investigation
- Follow-up questions — Suggested next steps to continue the investigation:
- "What are the specific error messages logged in the last 30 minutes?"
- "Can we get traces related to these error logs?"
- "How does this error count compare to previous time frames?"
SQL View
Switch to the SQL tab to see the exact query that AgentSRE generated from your natural language input:
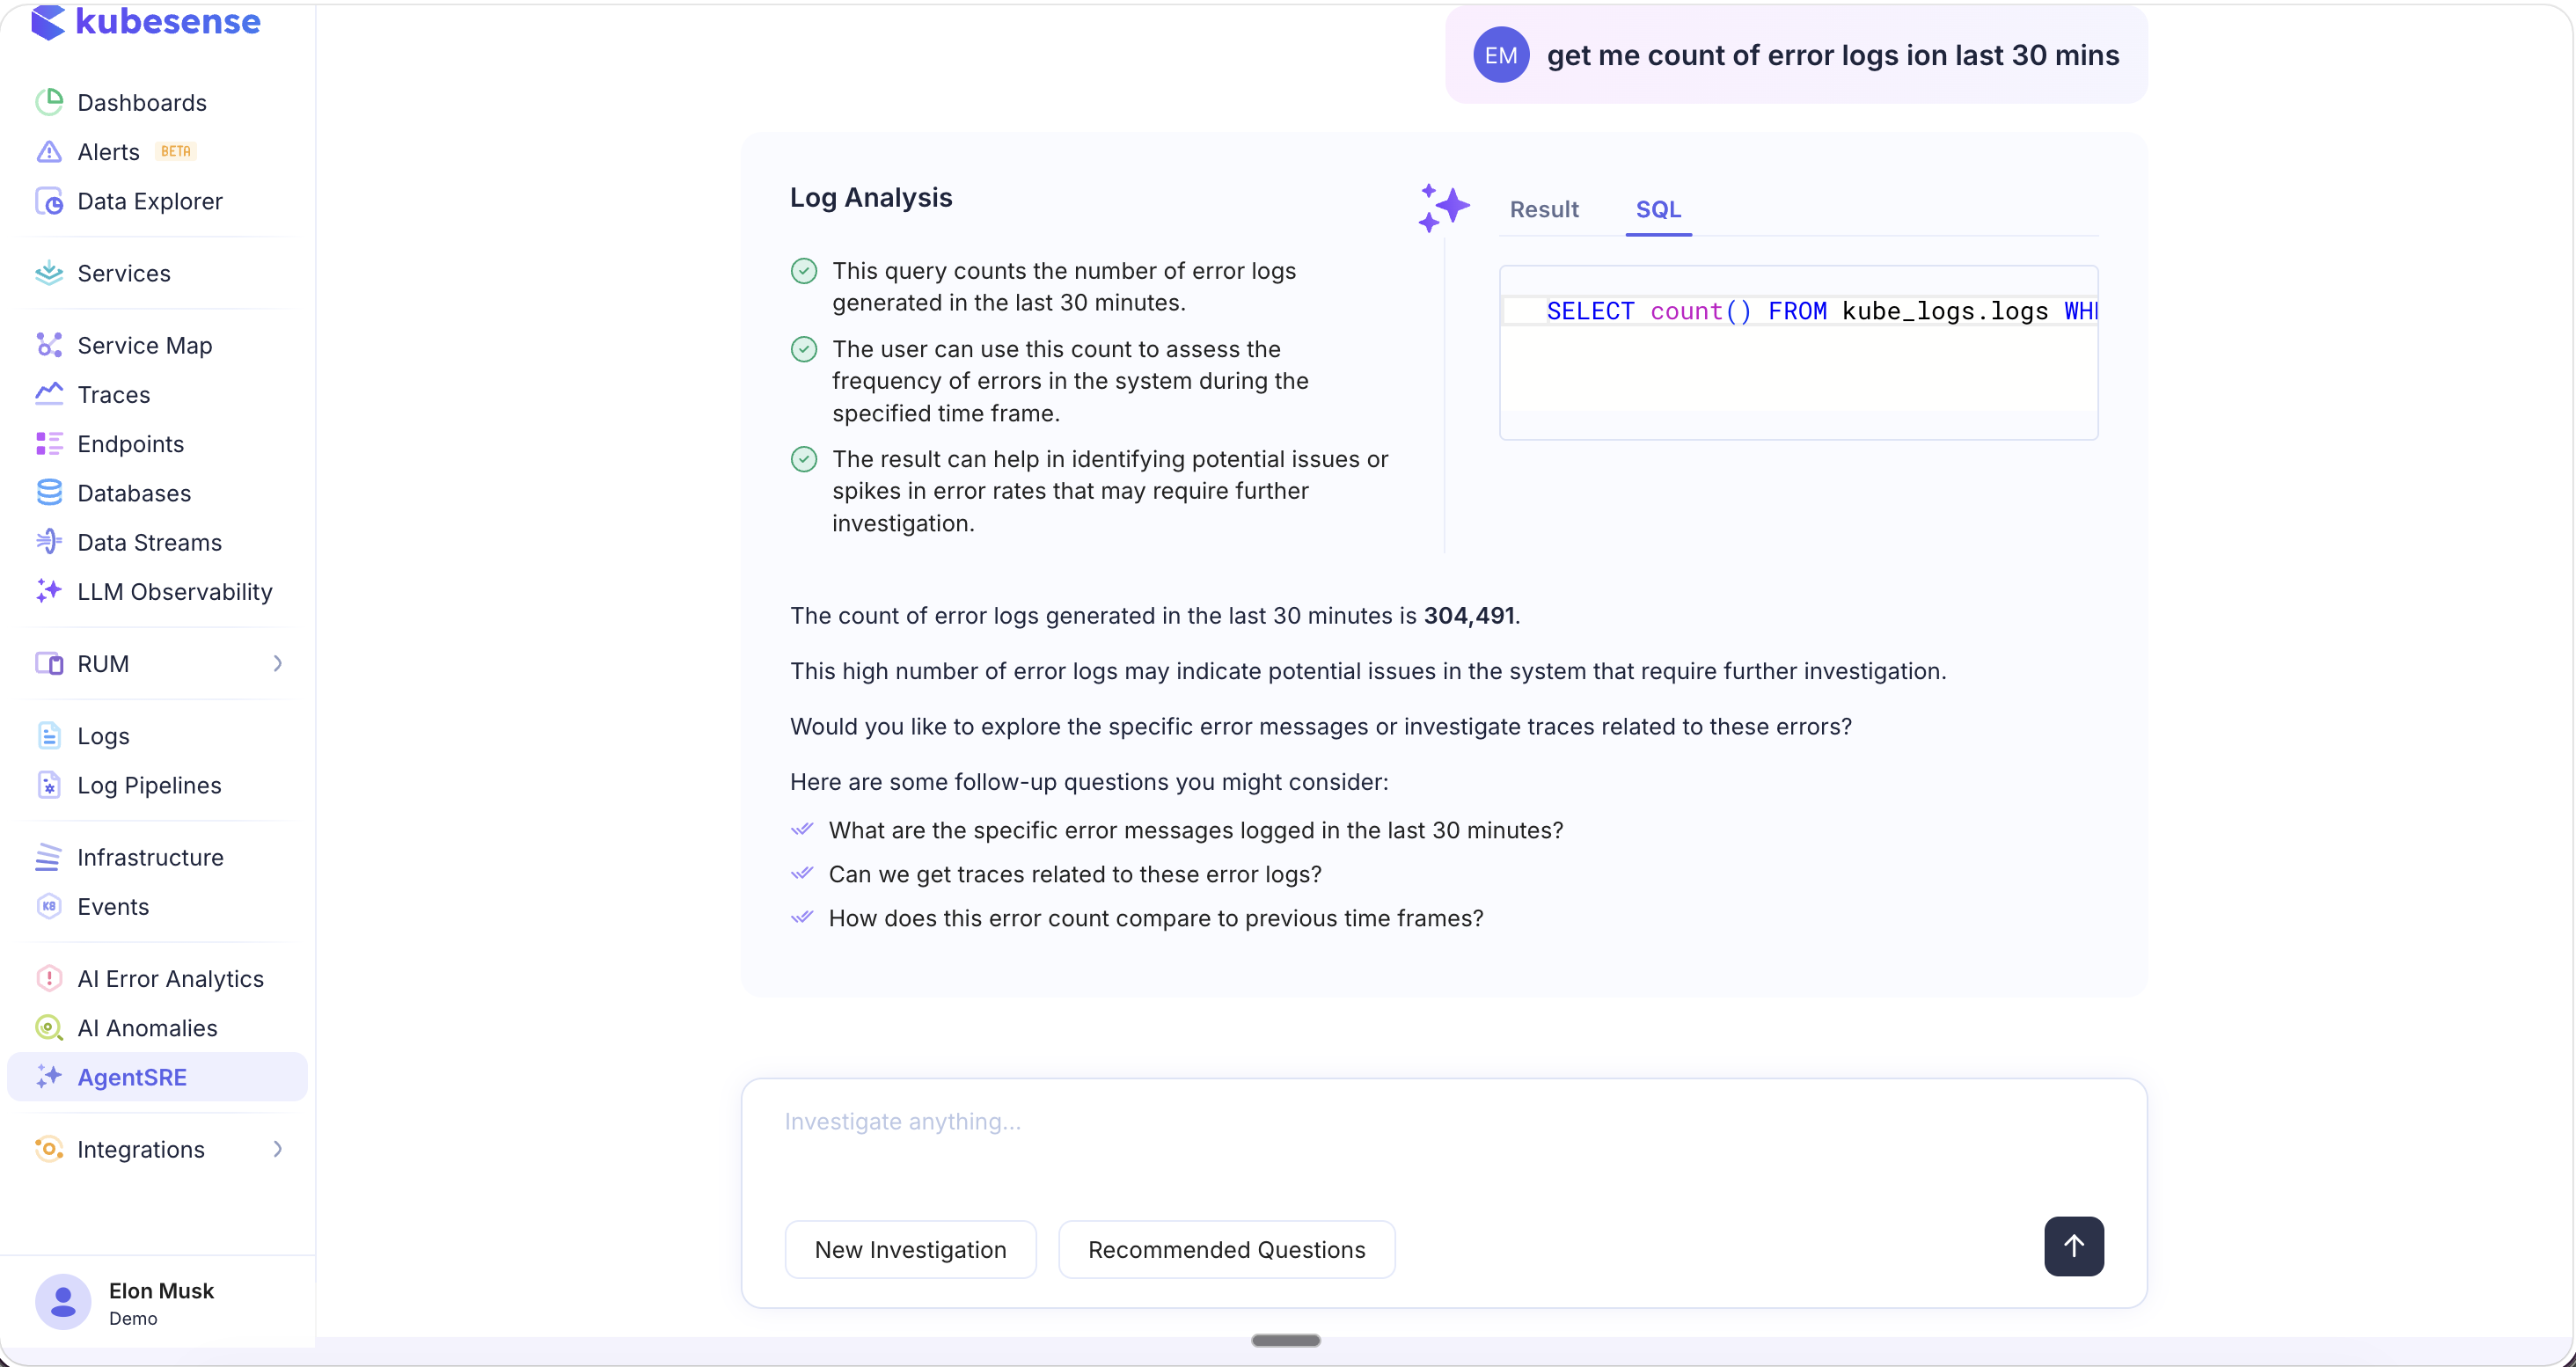
This is useful for:
- Understanding how your question was interpreted
- Learning the query syntax for future manual queries
- Copying and modifying the query for more specific investigations
- Validating the analysis approach
You can continue the conversation by typing follow-up questions in the input box at the bottom, or click New Investigation to start fresh, or Recommended Questions to explore other topics.
AI Root Cause Analysis (RCA)
AgentSRE powers the AI RCA capability available directly from any failed trace. When you encounter a trace with errors, click the AI RCA button to get an automated root cause analysis.
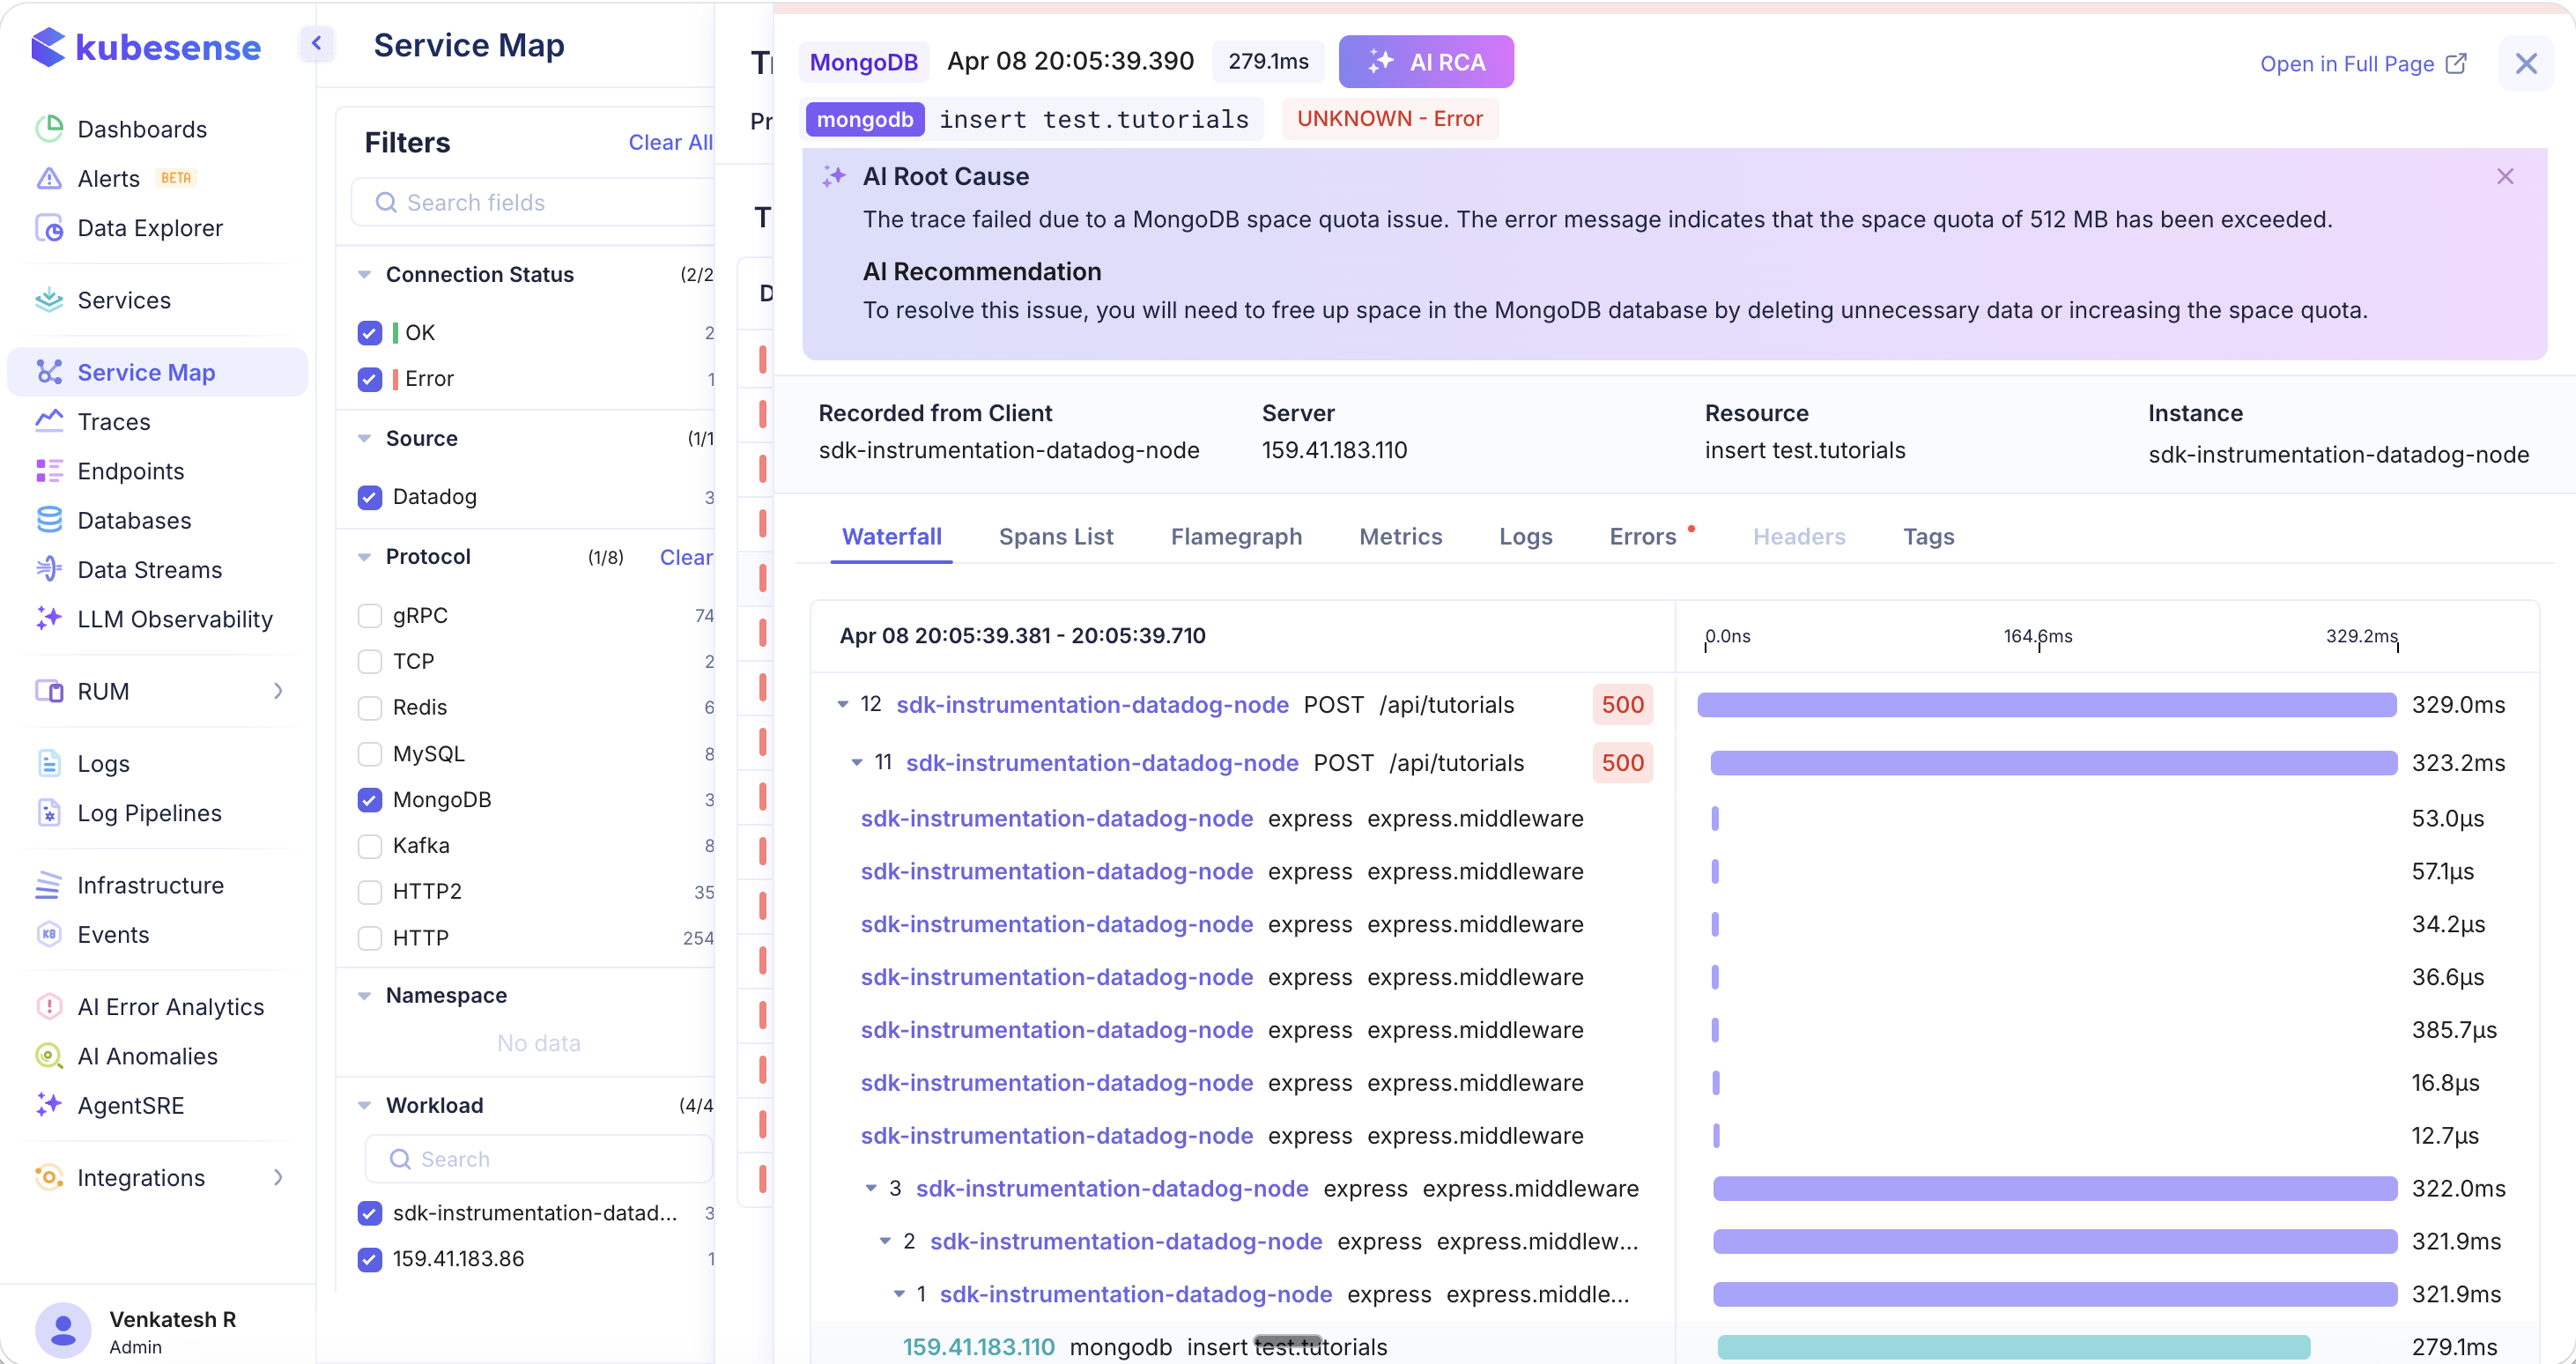
The AI RCA analyzes the trace, its spans, errors, and surrounding context, then provides:
- AI Root Cause — A clear explanation of why the trace failed (e.g., "The trace failed due to a MongoDB space quota issue. The error message indicates that the space quota of 512 MB has been exceeded.")
- AI Recommendation — Actionable steps to resolve the issue (e.g., "To resolve this issue, you will need to free up space in the MongoDB database by deleting unnecessary data or increasing the space quota.")
The RCA is contextual — it examines the full distributed trace including all spans across services (e.g., express middleware calls, database operations), the protocol details, status codes, and error messages to pinpoint the exact root cause.
AI RCA is accessible from:
- The Traces page — click any failed trace and use the AI RCA button
- The Service Map — navigate from error paths to failed traces, then run RCA
- The AI Error Analytics page — drill into grouped errors, click a trace, and run RCA
What You Can Investigate
AgentSRE can answer questions across all your observability data:
| Category | Example Questions |
|---|---|
| Errors & Incidents | "What are the top errors in the last hour?", "Why is the checkout service returning 500s?" |
| Latency & Performance | "Which services have the highest P95 latency?", "Show me slow database queries" |
| Logs | "Count error logs in the last 30 minutes", "Show me OOM errors across all namespaces" |
| Traces | "Show me traces with latency > 500ms", "Find failed traces for the payment service" |
| Infrastructure | "Which pods are consuming the most memory?", "Are there any container restarts?" |
| Anomalies | "Are there any anomalies detected today?", "What changed in the last hour?" |
| Root Cause | Run AI RCA on any failed trace for automated diagnosis and recommendations |
Use Cases
- Incident triage — Quickly understand what's happening across your infrastructure by asking broad questions, then narrow down with follow-ups
- Root cause analysis — Use AI RCA on failed traces to get instant diagnosis and remediation suggestions without manually correlating logs, metrics, and traces
- Ad-hoc investigation — Ask natural language questions instead of writing complex SQL or filter queries
- Knowledge sharing — Use Previous Investigations to review past analyses and share findings with team members
- On-call support — Get instant answers during incidents without needing deep expertise in every service or system