
Creating a Workflow
Start from a blueprint
Create New Workflow opens the starting points rather than a blank canvas.
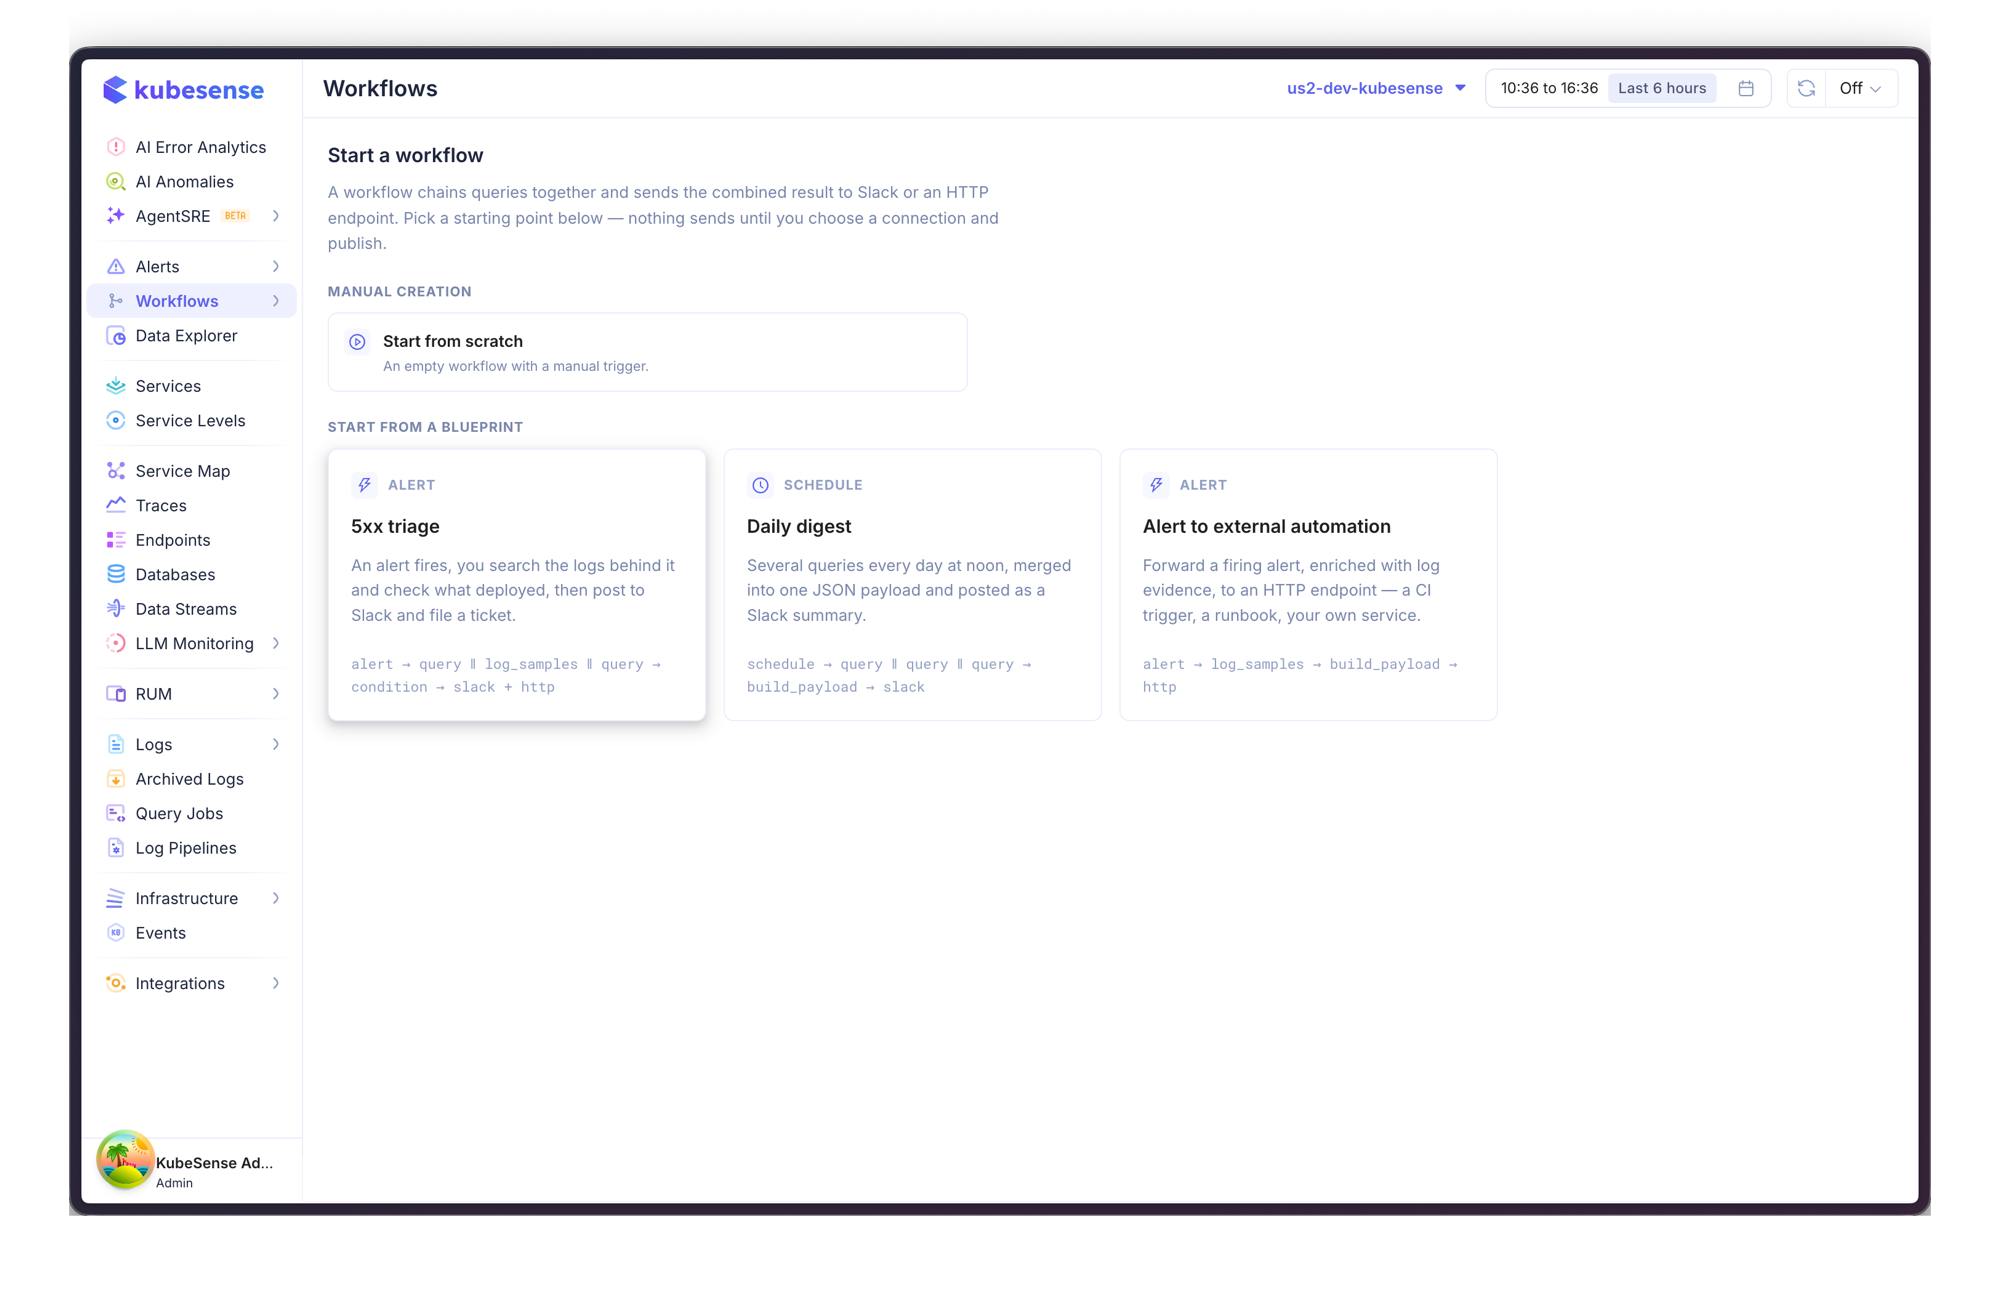
They are grouped by what starts them.
When an alert fires
| Blueprint | What it builds |
|---|---|
| 5xx triage | Search the logs behind the alert and check what deployed, then post to Slack and file a ticket |
| Error rate triage | Break the failures down by status code, pull the error logs behind them, post both as one summary |
| Latency triage | Find the slowest operations and sample the individual spans behind them |
| Saturation triage | Usage per pod alongside the restart and OOM lines, so a capacity problem is distinguishable from one bad pod |
| Alert with a noise gate | Post only when the alert is backed by real volume — the one blueprint built around a Condition |
| Alert to external automation | Forward a firing alert, enriched with log evidence, to an HTTP endpoint |
On a schedule
| Blueprint | What it builds |
|---|---|
| Daily digest | Several queries merged into one JSON payload and posted as a Slack summary |
| Morning triage digest | What failed overnight, the slowest operations, and a sample of the errors |
| Log volume watch | Daily ingest volume by namespace, posting only when it crosses your threshold |
| Weekly reliability summary | Errors, latency and throughput for the week in one post |
On demand
| Blueprint | What it builds |
|---|---|
| Service health bundle | Errors, latency and recent error logs for a workload you name at run time |
| Evidence pack to a ticket | The same gathering, filed as a ticket over HTTP — safely repeatable |
| Start from scratch | An empty workflow with a manual trigger |
The alert-triggered ones scope every query to the workload the alert names, using {{ .Trigger.alert.labels.workload }} in the step's filters. If your rules group by a different label, change that filter value to match.
A blueprint always opens unarmed: the workflow is disabled and its action steps carry no connection, so opening one and clicking around can never send anything.
The builder
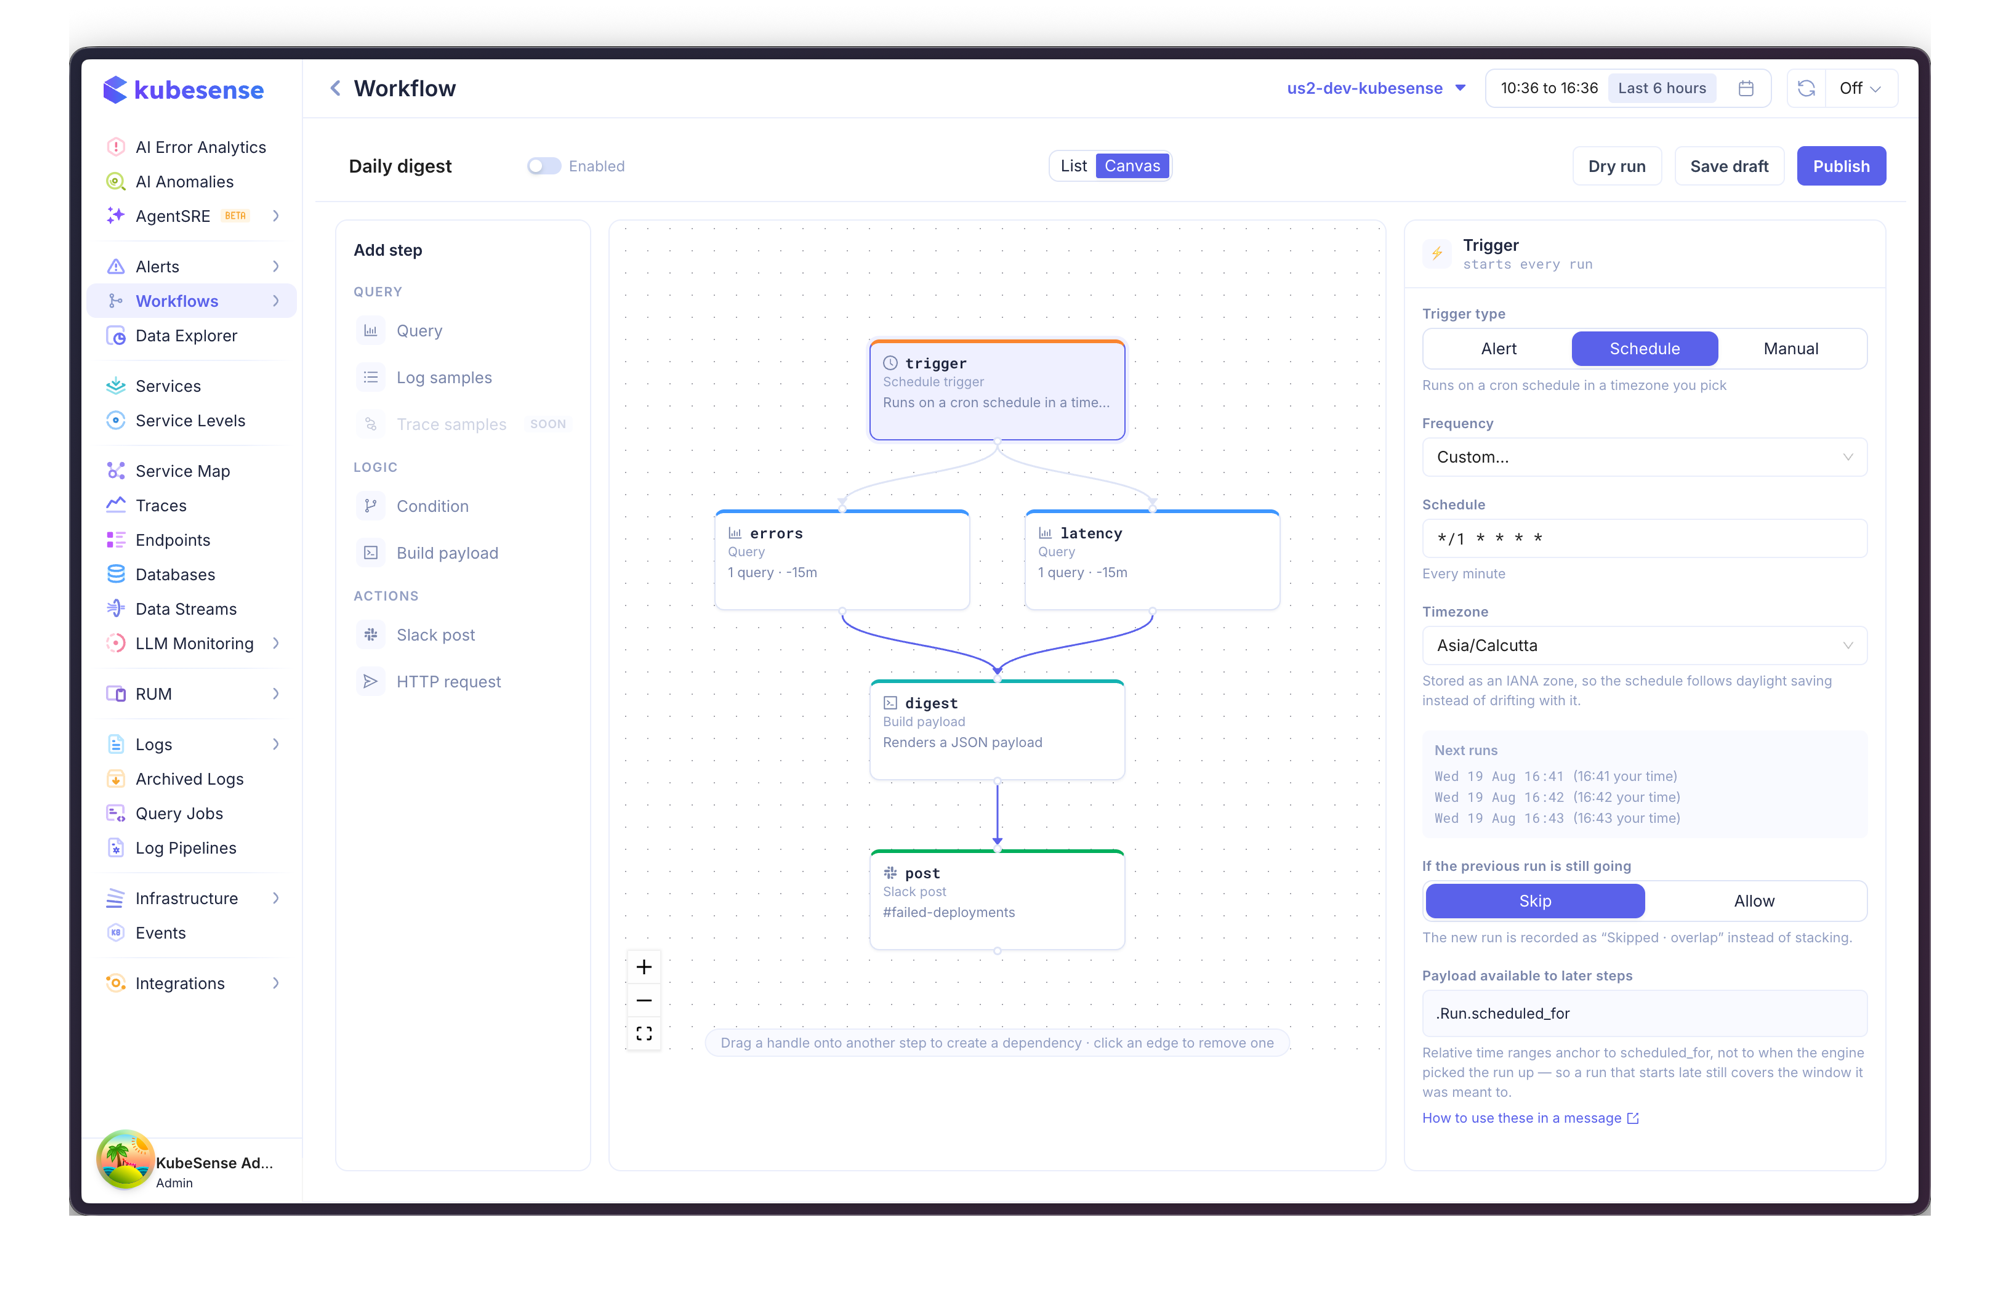
Three panels: the step palette on the left, the workflow in the middle, and the inspector for whatever is selected on the right.
List and Canvas show the same workflow. List is a linear read of execution order; Canvas shows the dependency graph — drag a handle from one step onto another to create a dependency, click an edge to remove it.
Steps at the same depth run concurrently. In the screenshot above, errors and latency both depend only on the trigger, so they execute together; digest waits for both.
Steps
| Step | What it does | Output you can read later |
|---|---|---|
| Query | Runs a metrics, logs or traces query — the same builder the alert editor uses | .series, .count, and .value in scalar mode |
| Log samples | Raw log rows matching a filter, newest first | .rows, .count, ._truncated |
| Trace samples | Individual spans matching a filter, slowest first | .rows, .count, ._truncated |
| Condition | Gates the steps that depend on it. Renders true or false | .result |
| Build payload | Reshapes earlier output into one JSON object | the JSON itself |
| Slack post | Posts a message to a channel | — |
| HTTP request | Calls an external endpoint — Jira, PagerDuty, your own automation | .status, .body, .headers |
A step reads earlier steps' output through templates: .Steps.<step_id>.<field>.
info: A step can only read steps that run before it. If a template names a step that isn't upstream, the builder flags it — add it under Runs after.
Step ids
The id is how templates address a step, so keep it short and descriptive: errors, top_errors, digest. Renaming a step does not rewrite templates that reference the old id; the Problems list will point out anything left dangling.
Time ranges
Query and Log samples steps each choose their window:
- From the trigger's window — for an alert trigger, the exact interval the rule evaluated when it fired. A rule evaluating over 6h gives the step 6h, not a fixed default.
- Relative — a fixed lookback like
-15mor-24h, anchored to the run's scheduled time rather than to when a worker picked it up, so a late run still covers the window it was meant to.
Scoping a query to what triggered the run
By default a query step looks at everything. What makes an alert-triggered workflow report on the thing that alerted is a filter whose value names something from the trigger.
Two ways to write it, and they are interchangeable:
$NAME — the same form dashboards and the explorer already use, and the one the query builder's own filter UI can produce:
field: workload operator: = value: $workload{{ }} — the full template syntax, for anything $NAME cannot express:
field: workload operator: = value: {{ .Trigger.alert.labels.workload }}$NAME is expanded first, then templates are rendered, so a single value may use both.
What $NAME can resolve
For an alert-triggered run, narrowest first — the most specific name wins:
| Source | Names |
|---|---|
| The alert's labels | whatever the rule groups by — $workload, $namespace, $cluster, … |
| The alert's own fields | $severity, $rule_name, $value, $fingerprint, $state |
| The run's inputs | $<input name>, for a manual run |
So if a rule groups by workload, then $workload is the workload that breached — the same value that appears on the alert instance under Alerts → Alert Events.
warning: A name nothing supplies is left exactly as written rather than blanked. $workload on a schedule-triggered run stays the literal text $workload, so the query returns nothing and the dry run shows you why. Blanking it would filter on an empty string and look like "no data" instead of a mistake.
Only filters and query configuration are resolved this way — a message body or URL is rendered where it is used, not here.
info: Trace-sample durations are in nanoseconds, as stored. Use humanDuration to render them: {{ humanDuration .duration }} turns 487000000 into something readable.
info: To name a span, use resource — it carries the identifying text: the HTTP path, the SQL statement, COMMIT. operation_name exists in the field list but is empty on most spans, so a template that reads it renders a blank label.resource also behaves differently in the two places you can use it. In a group by it resolves to the normalized route (GET /api/v1/users/{id}), so a p95-per-endpoint doesn't split into one series per unique URL once IDs appear in the path. In trace-sample rows it is the raw path, because there you want the request that actually happened.
Dry run
Dry run executes the workflow against real data and stops short of sending.
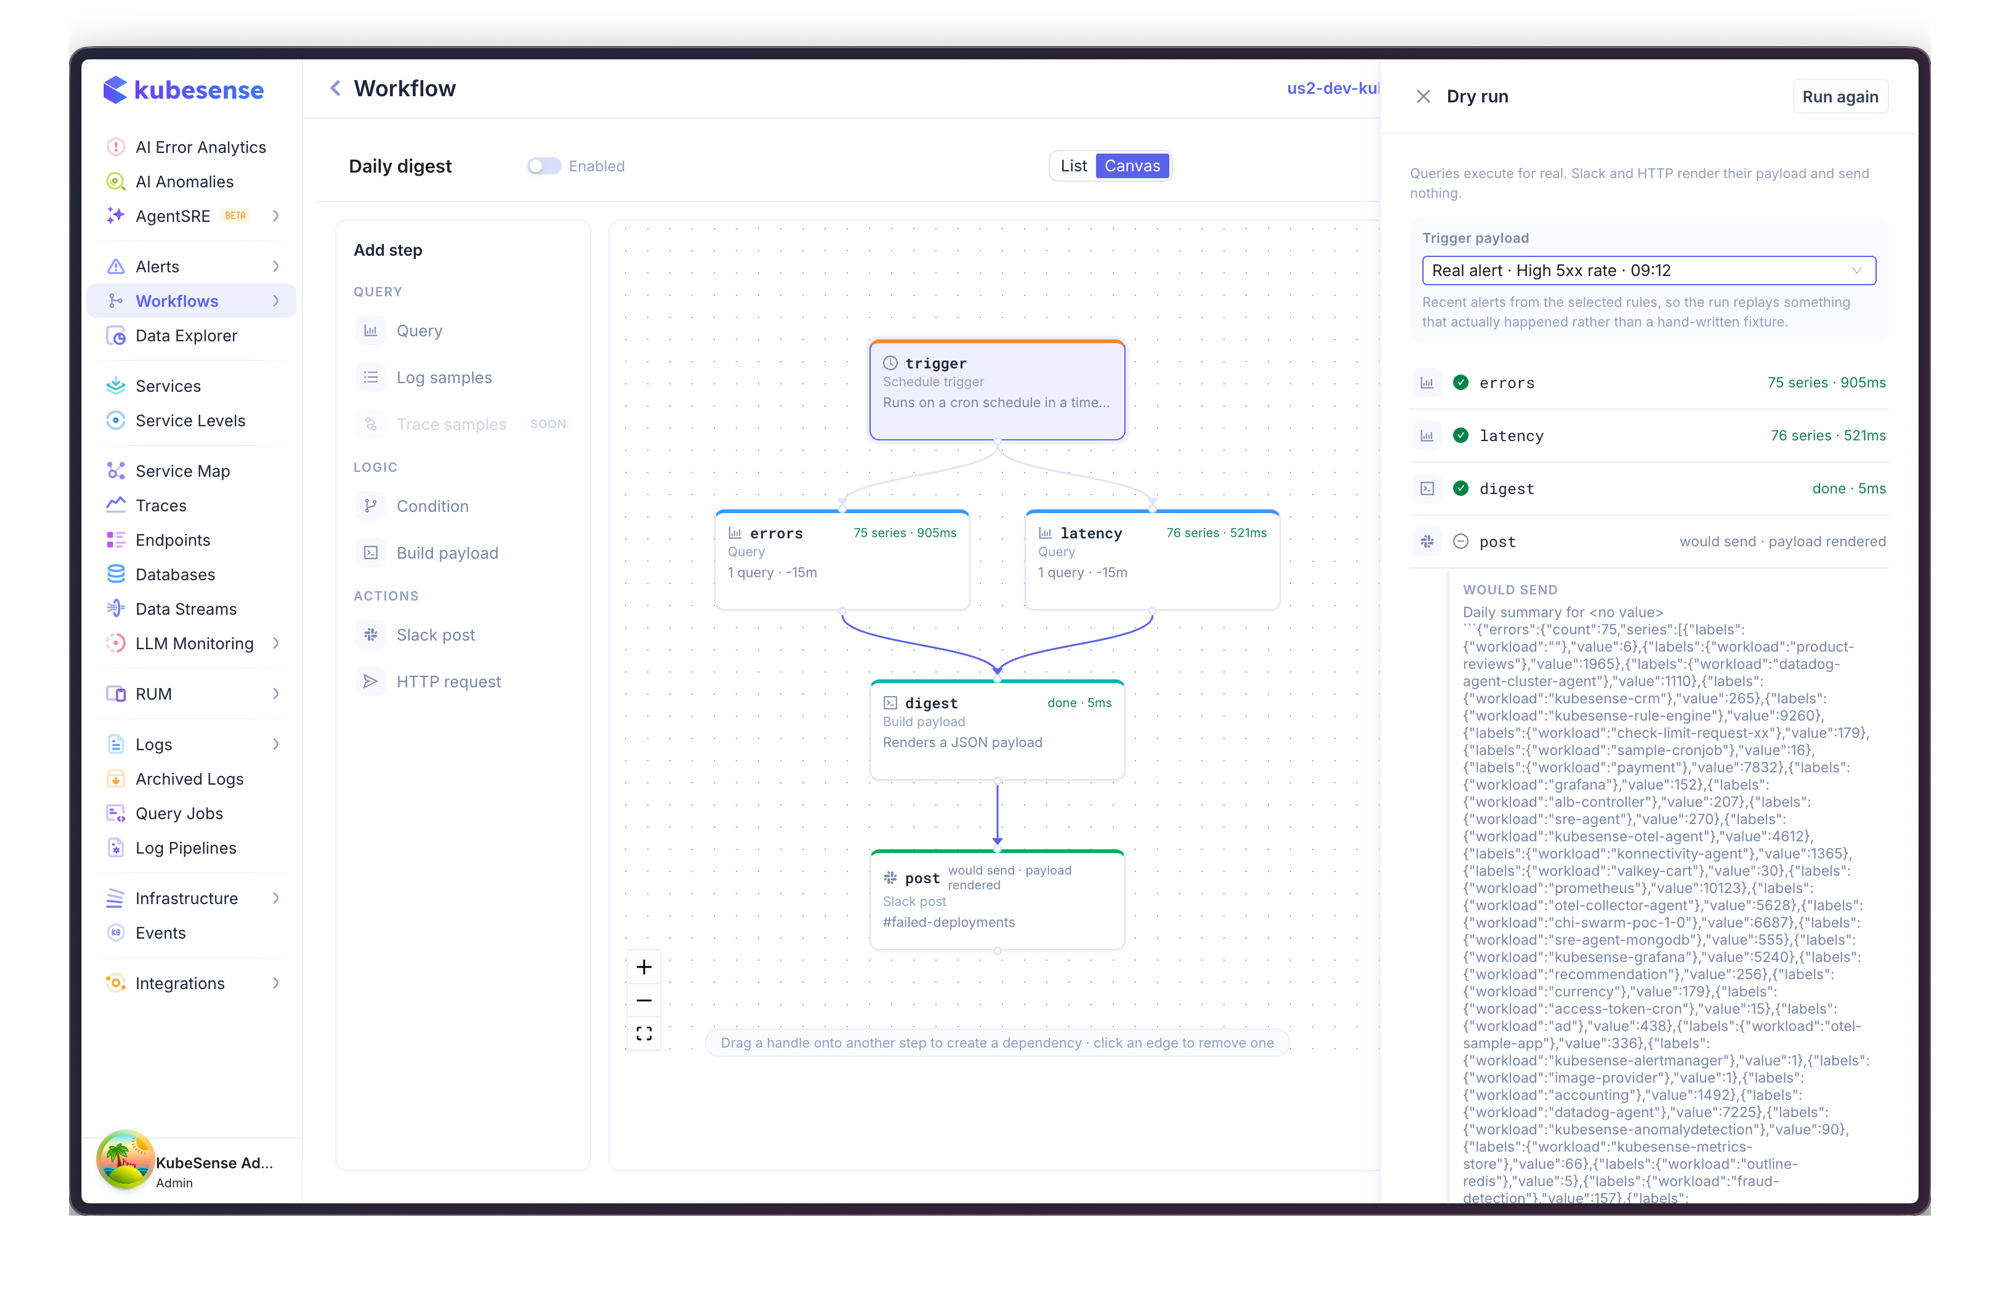
Queries run for real, so you see real counts and real timings. Slack and HTTP steps render their payload and report would send — the rendered message is shown so you can read exactly what would have arrived.
For an alert-triggered workflow you can pick a recent real alert as the trigger payload, so the run replays something that actually happened instead of a hand-written fixture.
If you need to confirm a send end to end, each simulated action offers Send for real, which arms exactly one delivery after a confirmation.
info: Dry run is the fastest way to catch a template that renders <no value> — see Message Templates.
Save and publish
Save draft stores your work. It does not arm anything, and it works even while the workflow has problems — an unpublished workflow cannot run, so there is no harm in parking a half-finished one.
Publish makes the current draft the version that triggers execute. It is refused while any error remains, and it re-checks the things that can rot between editing and publishing — a connection deleted since you wrote the step, for instance.
A published workflow also needs its Enabled toggle on before it runs.
The two are deliberately separate: editing a published workflow never changes what is running until you publish again, so a half-finished edit cannot go out with the next alert.