Service Map
The Service Map provides a real-time visual topology of all service-to-service communication across your infrastructure. It renders every connection between services as a directed graph — showing protocols, error rates, latencies, and upstream/downstream dependencies at a glance. Use the Service Map to get a bird's-eye view of cluster health, drill down into individual service relationships, and navigate directly to failed traces for root cause analysis.
Cluster-Wide Topology
The Service Map displays all discovered services and their interconnections for the selected cluster and time window. In production environments, this view can be complex — reflecting the full scope of your microservices architecture, including internal services, databases, message brokers, and external dependencies.
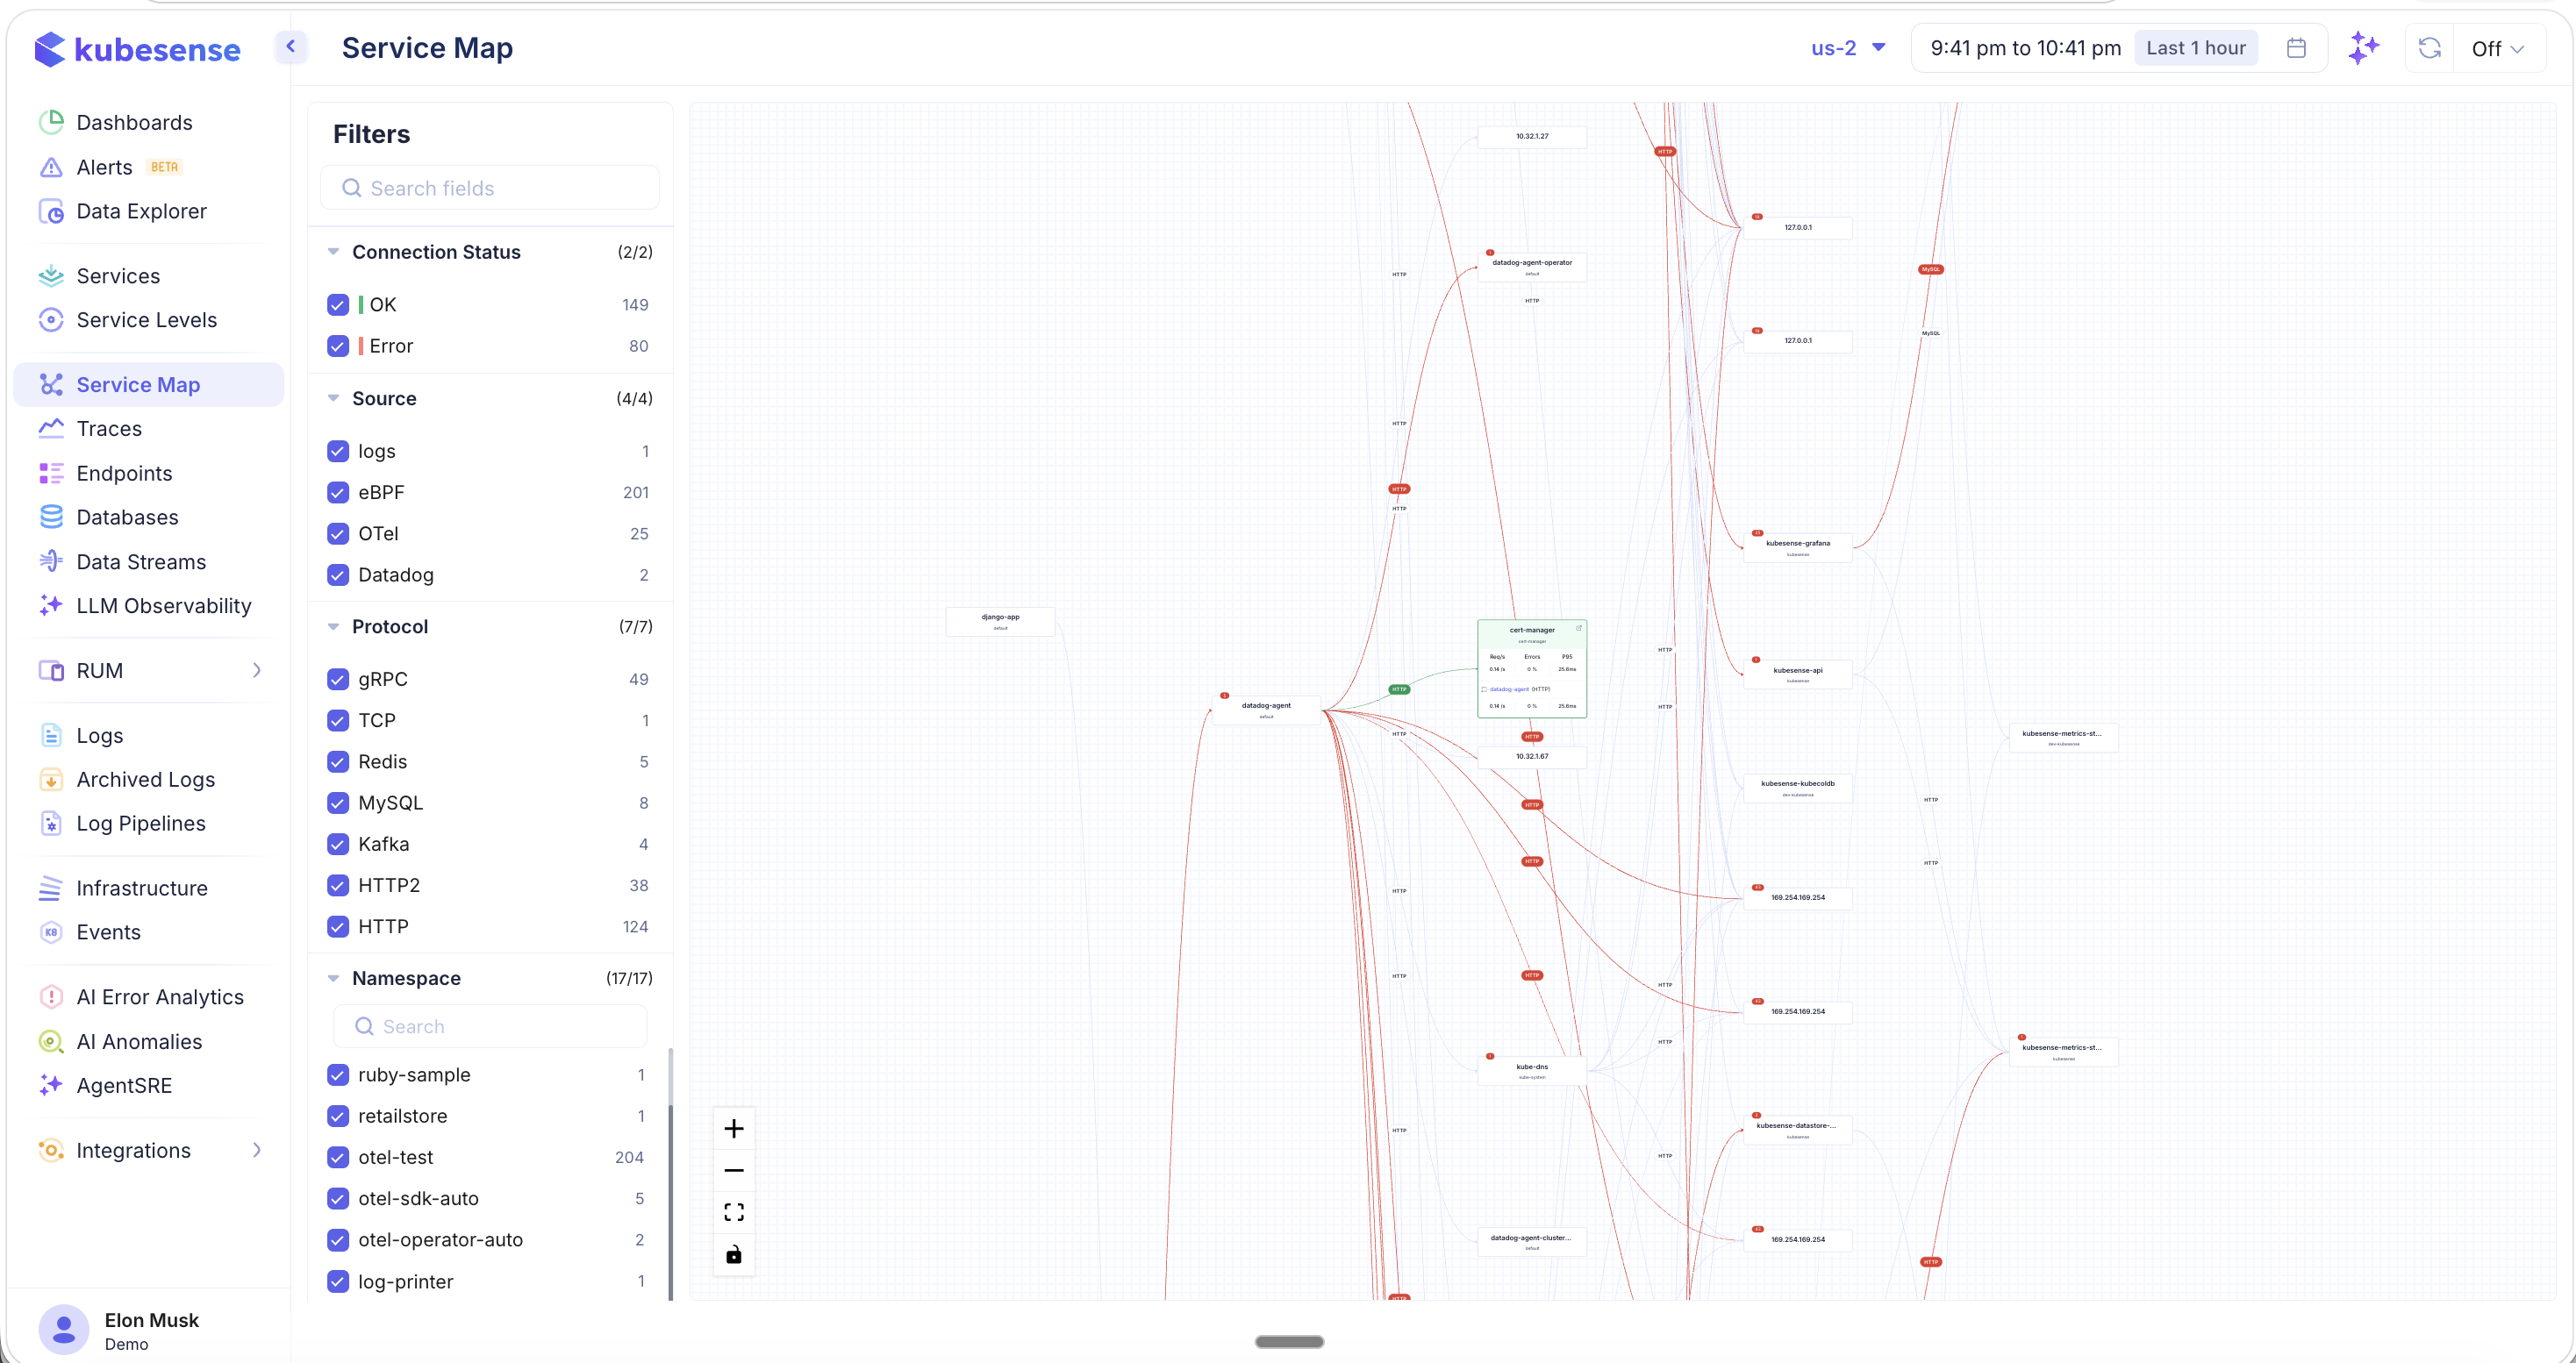
The map renders a directed graph where:
- Nodes represent services (workloads), labeled with their name and namespace
- Edges represent network connections between services, labeled with the protocol (HTTP, gRPC, Kafka, MySQL, Redis, etc.)
- Red outlines and lines indicate services or connections with errors
- Error badges show the count of errors on a service or connection path
Use the controls in the bottom-left corner to:
- Zoom in/out (+/−) to navigate large topologies
- Fit to screen to auto-zoom the entire map into view
- Lock layout to freeze the current arrangement
Filters
The left-hand filter panel lets you drill down into the service map to focus on exactly the services and connections you care about. Filters work in combination with the cluster selector and time range at the top of the page.
Connection Status
- OK — Show healthy connections (green)
- Error — Show connections with errors (red)
Source
Filter by instrumentation source to see traffic from specific collection methods:
- logs — Log-derived connections
- eBPF — Kernel-level auto-instrumented traffic (zero-code)
- OTel — OpenTelemetry SDK traces
- Datadog — Datadog agent traces
Protocol
Filter by network protocol to isolate specific traffic types:
- gRPC, TCP, Redis, MySQL, Kafka, HTTP2, HTTP
Each protocol shows the count of connections using that protocol, making it easy to identify the dominant communication patterns.
Namespace
Filter by Kubernetes namespace to focus on specific application groups. The count next to each namespace shows how many services belong to it.
Workload
Filter by specific workload names to narrow the topology to a subset of services.
Drilling into a Service
Hover over or click any service node to see detailed upstream and downstream metrics for that specific service. The expanded view shows:
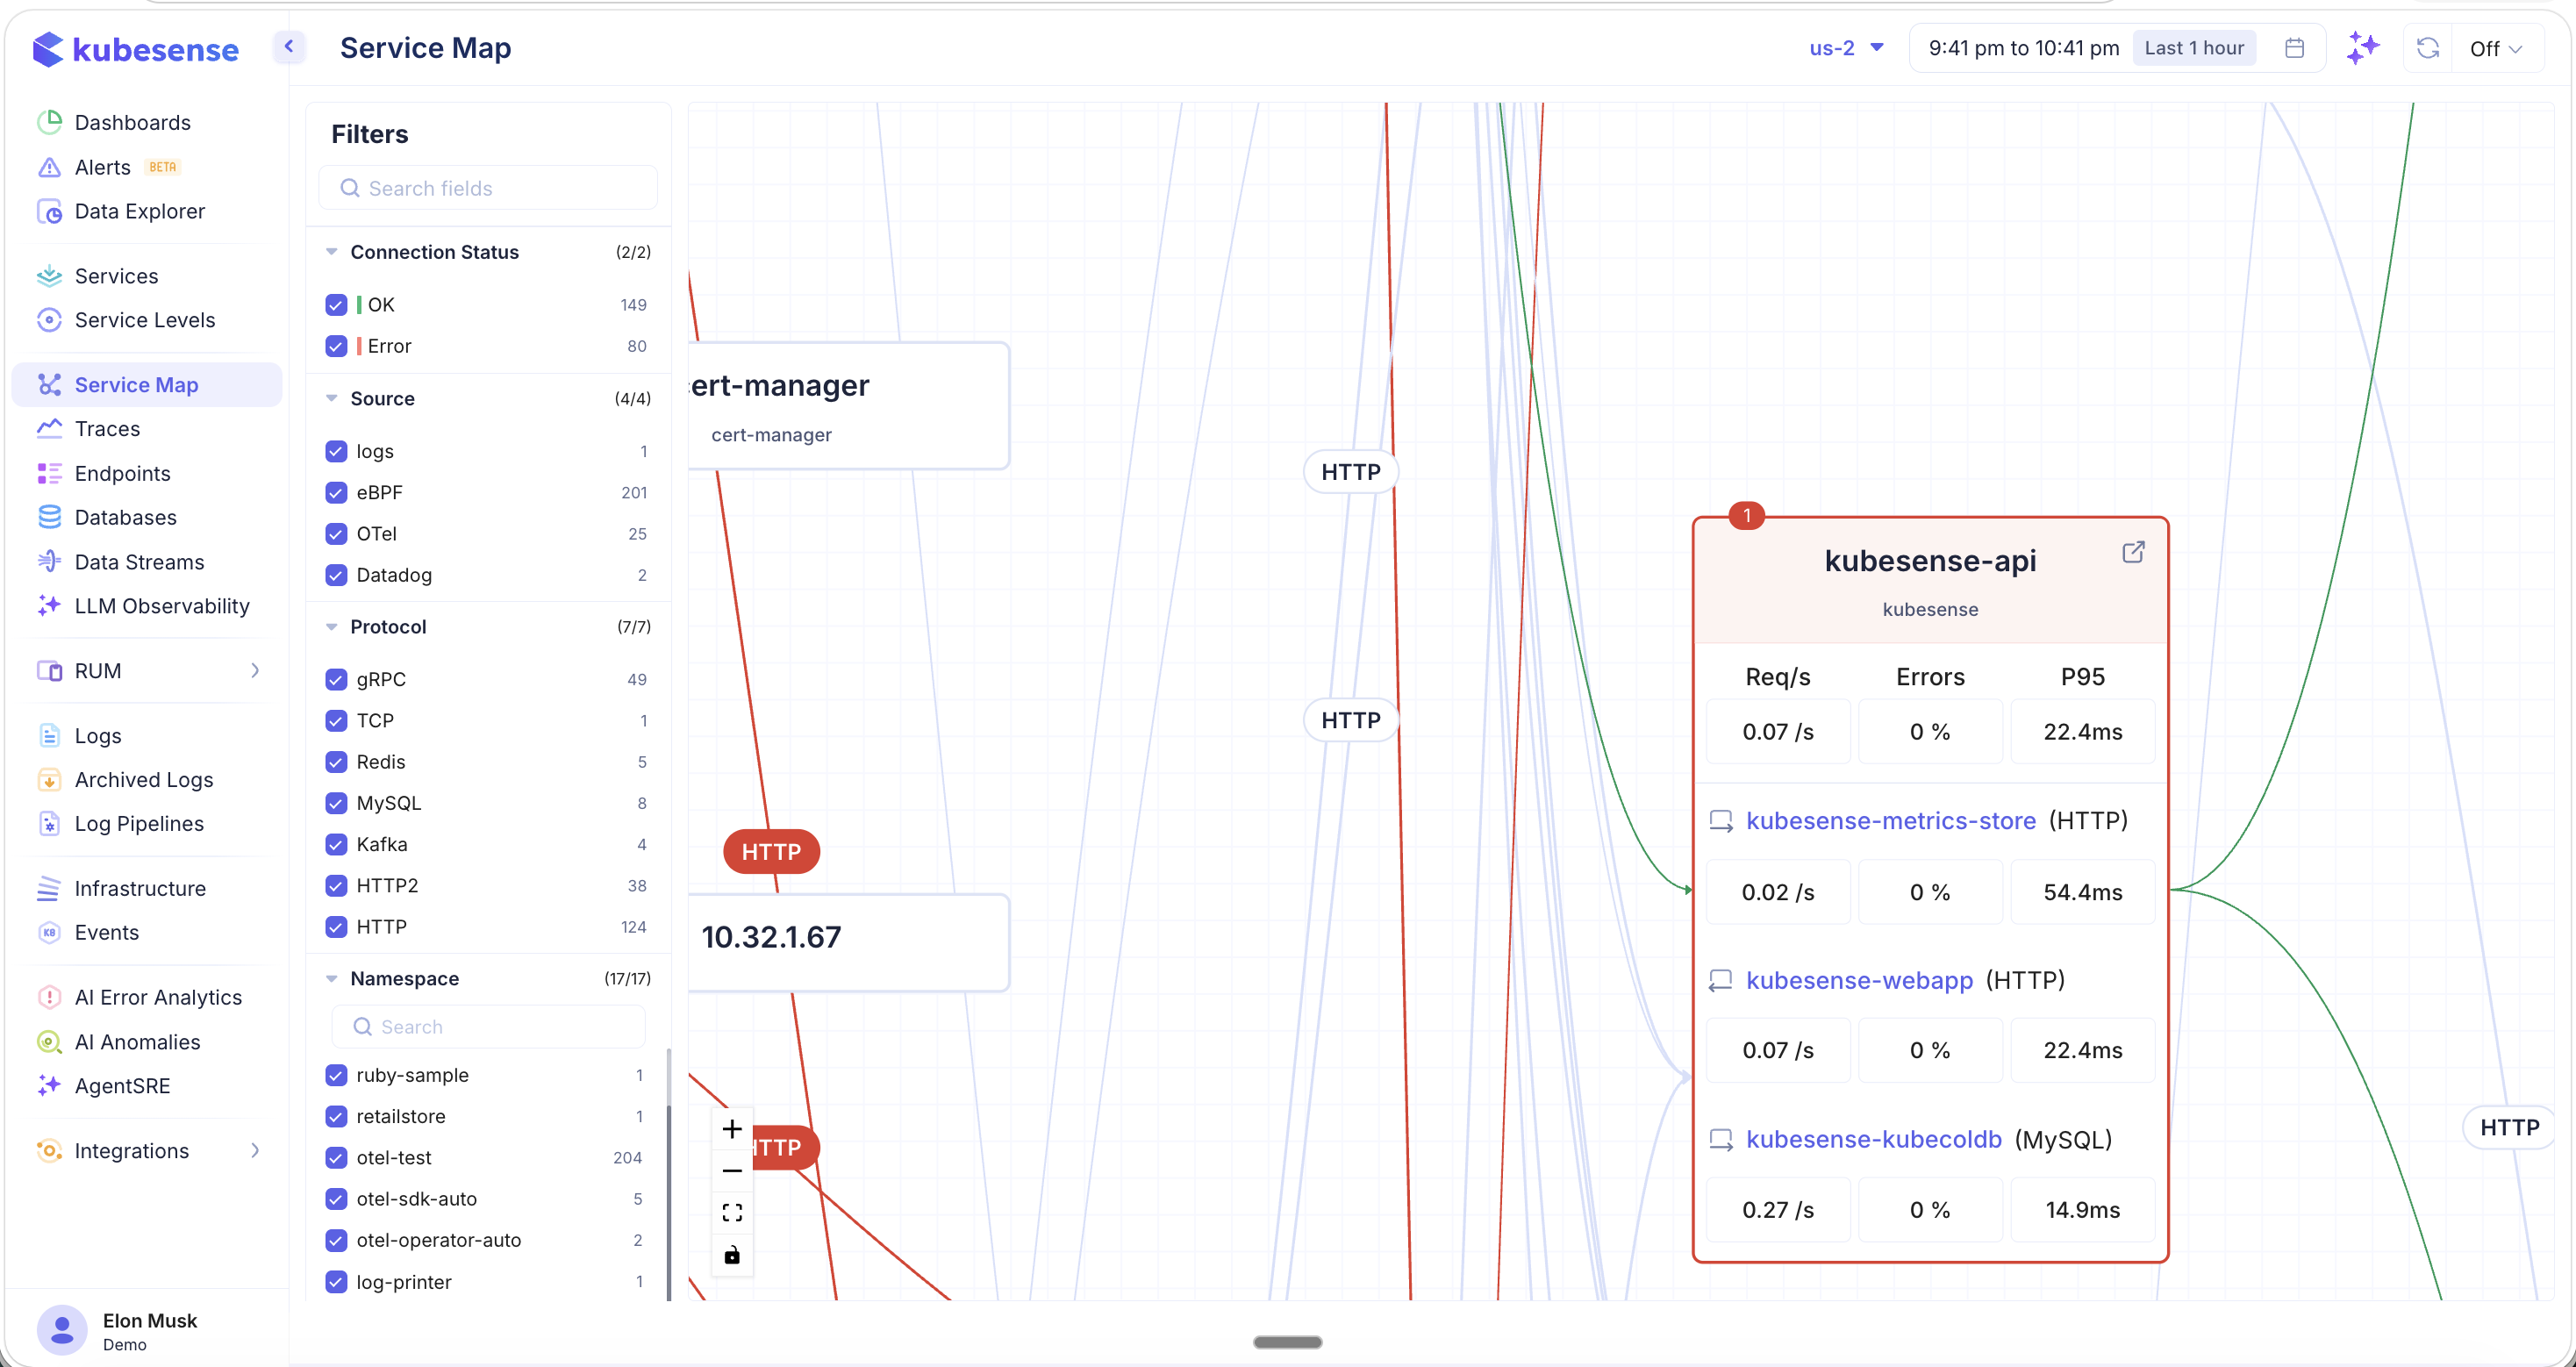
- The selected service node expands to reveal its upstream and downstream connections
- Each connection displays:
- Service name and protocol
- Req/s — Requests per second
- Errors — Error percentage
- P95 — 95th percentile latency
- Red borders around a service indicate it has active errors
- Click the external link icon on a service node to navigate to its full Service Detail page
This view is invaluable for understanding a service's position in the architecture and identifying which upstream callers or downstream dependencies are contributing to performance issues.
Filtered Service Map
Use the filter panel to isolate specific protocols, namespaces, or workloads. For example, selecting only the Kafka protocol shows just the message-broker topology:
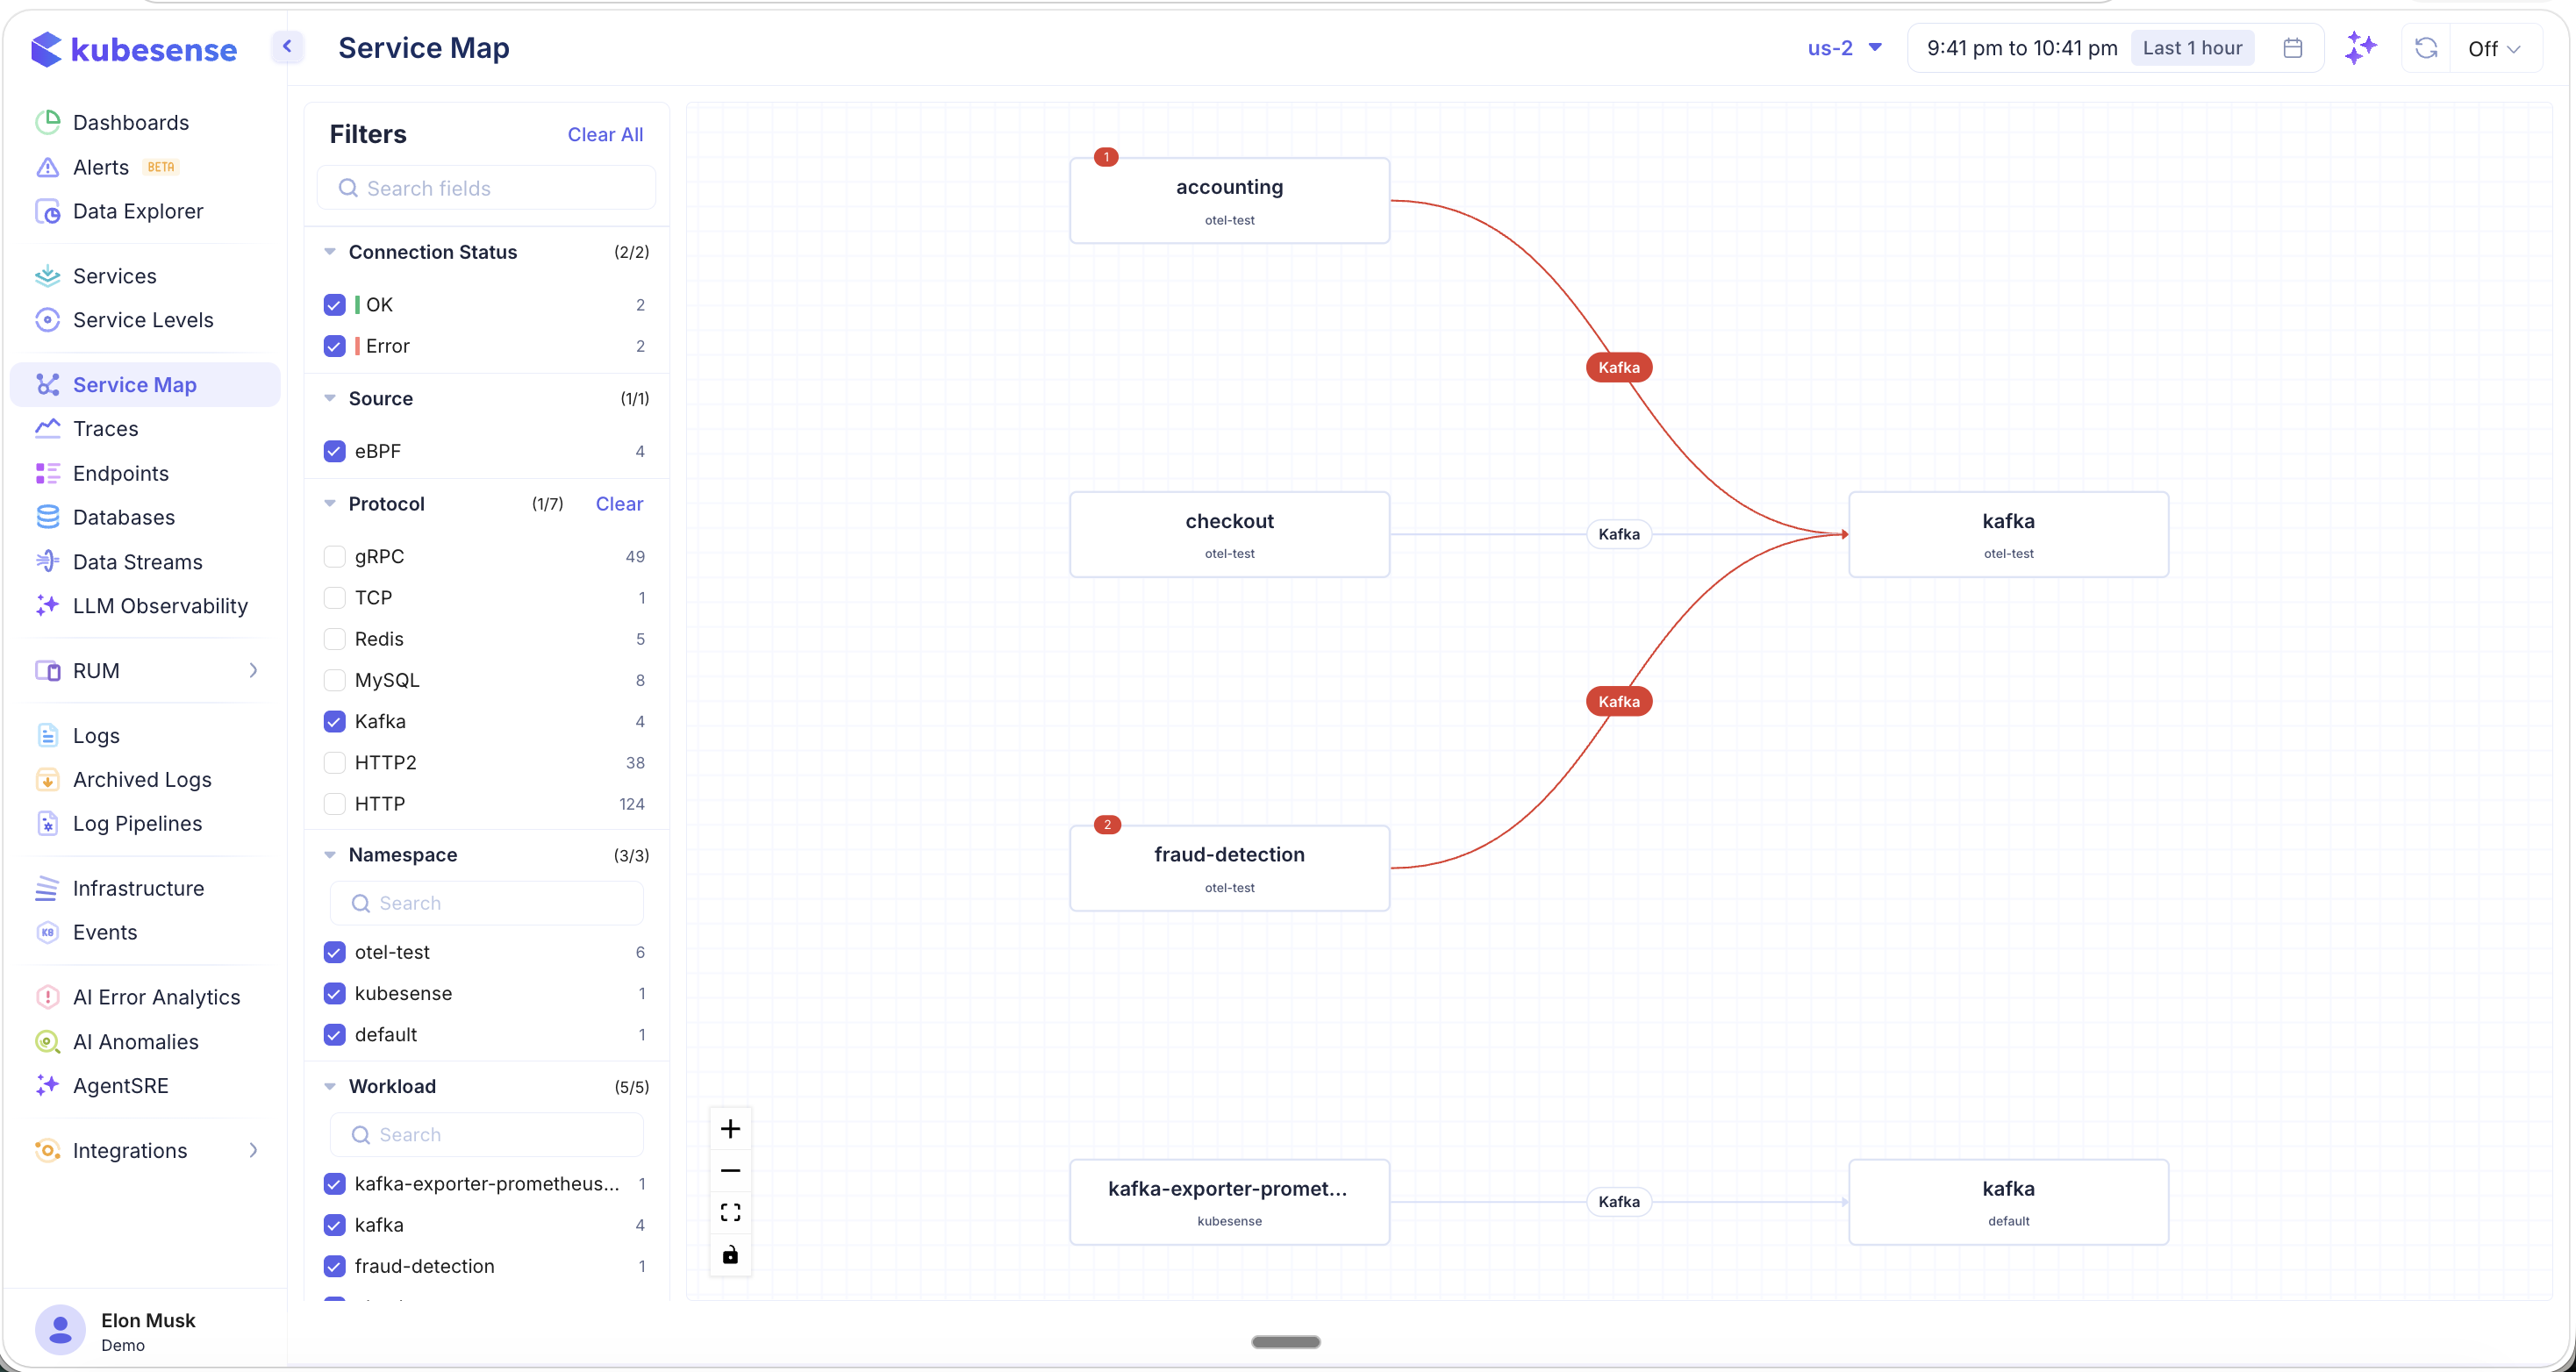
In this filtered view:
- Only services communicating via the selected protocol (Kafka) are shown
- Error badges on service nodes and connection paths highlight where failures are occurring
- The filter counts update to reflect the narrowed scope (e.g., "1/7" protocols selected, "3/3" namespaces)
- Click "Clear All" to reset all filters and return to the full topology
From Service Map to Root Cause
The Service Map is the starting point for a powerful investigation workflow:
- Spot the problem — Red lines and error badges on the Service Map highlight failing connections
- Drill into the connection — Click on an error path to see the list of failed traces between two services
- Inspect individual traces — Click on a specific trace to see its full detail — metrics, logs, errors, headers, and resource consumption
- Root cause analysis — Use the AI RCA button on any trace to perform automated root cause analysis
This flow lets you go from a high-level topology view to the exact request that caused a failure, all within a few clicks.
Use Cases
- Dependency discovery — Understand which services communicate with each other and via which protocols
- Impact analysis — Identify which downstream services are affected when an upstream service fails
- Protocol visibility — See what protocols are in use across your microservices architecture (gRPC, HTTP, Kafka, MySQL, Redis, etc.)
- Error isolation — Filter by error status to see only failing connections and quickly identify the blast radius
- Namespace scoping — Focus on a specific team's services by filtering to their namespace