Traces
The Traces page provides a comprehensive distributed tracing explorer for searching, filtering, and analyzing individual request traces and spans across your entire infrastructure. All traces are scoped to the selected cluster and time period — use the cluster selector and time picker at the top of the page to adjust.
Span View vs. Trace View
The Traces page offers two viewing modes, toggled from the top-right corner:
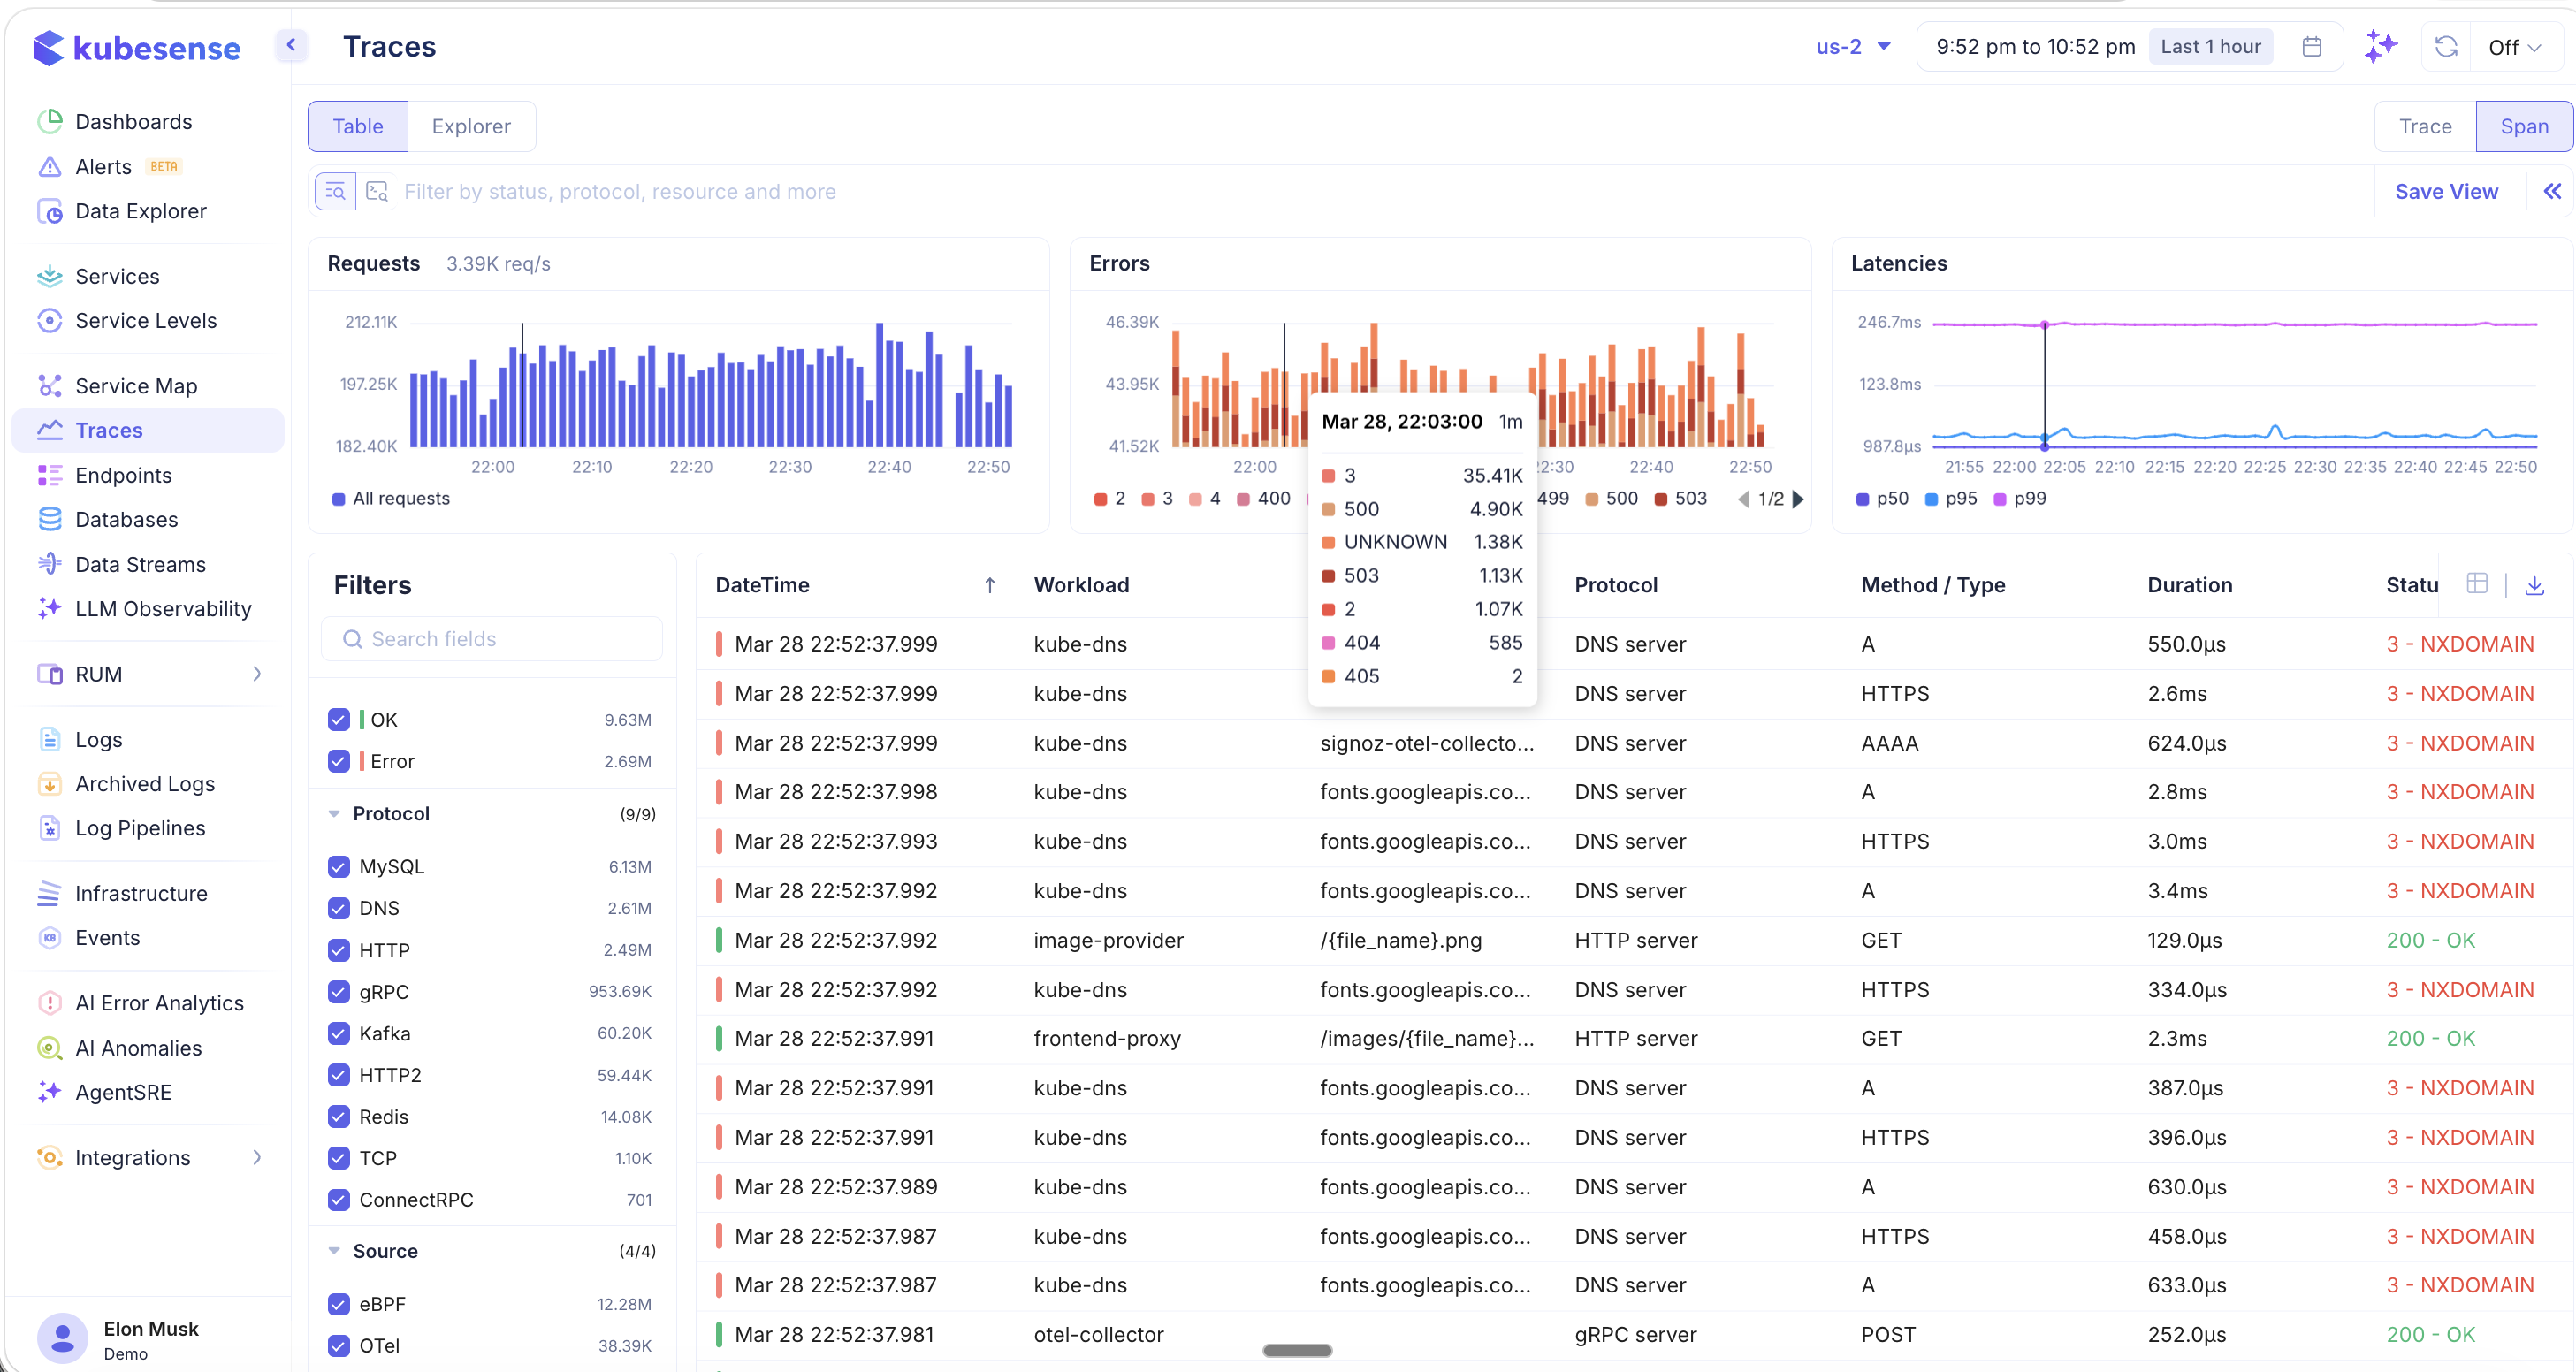
Span View
The default Span view lists every individual span captured across your services. Each row represents a single operation within a trace.
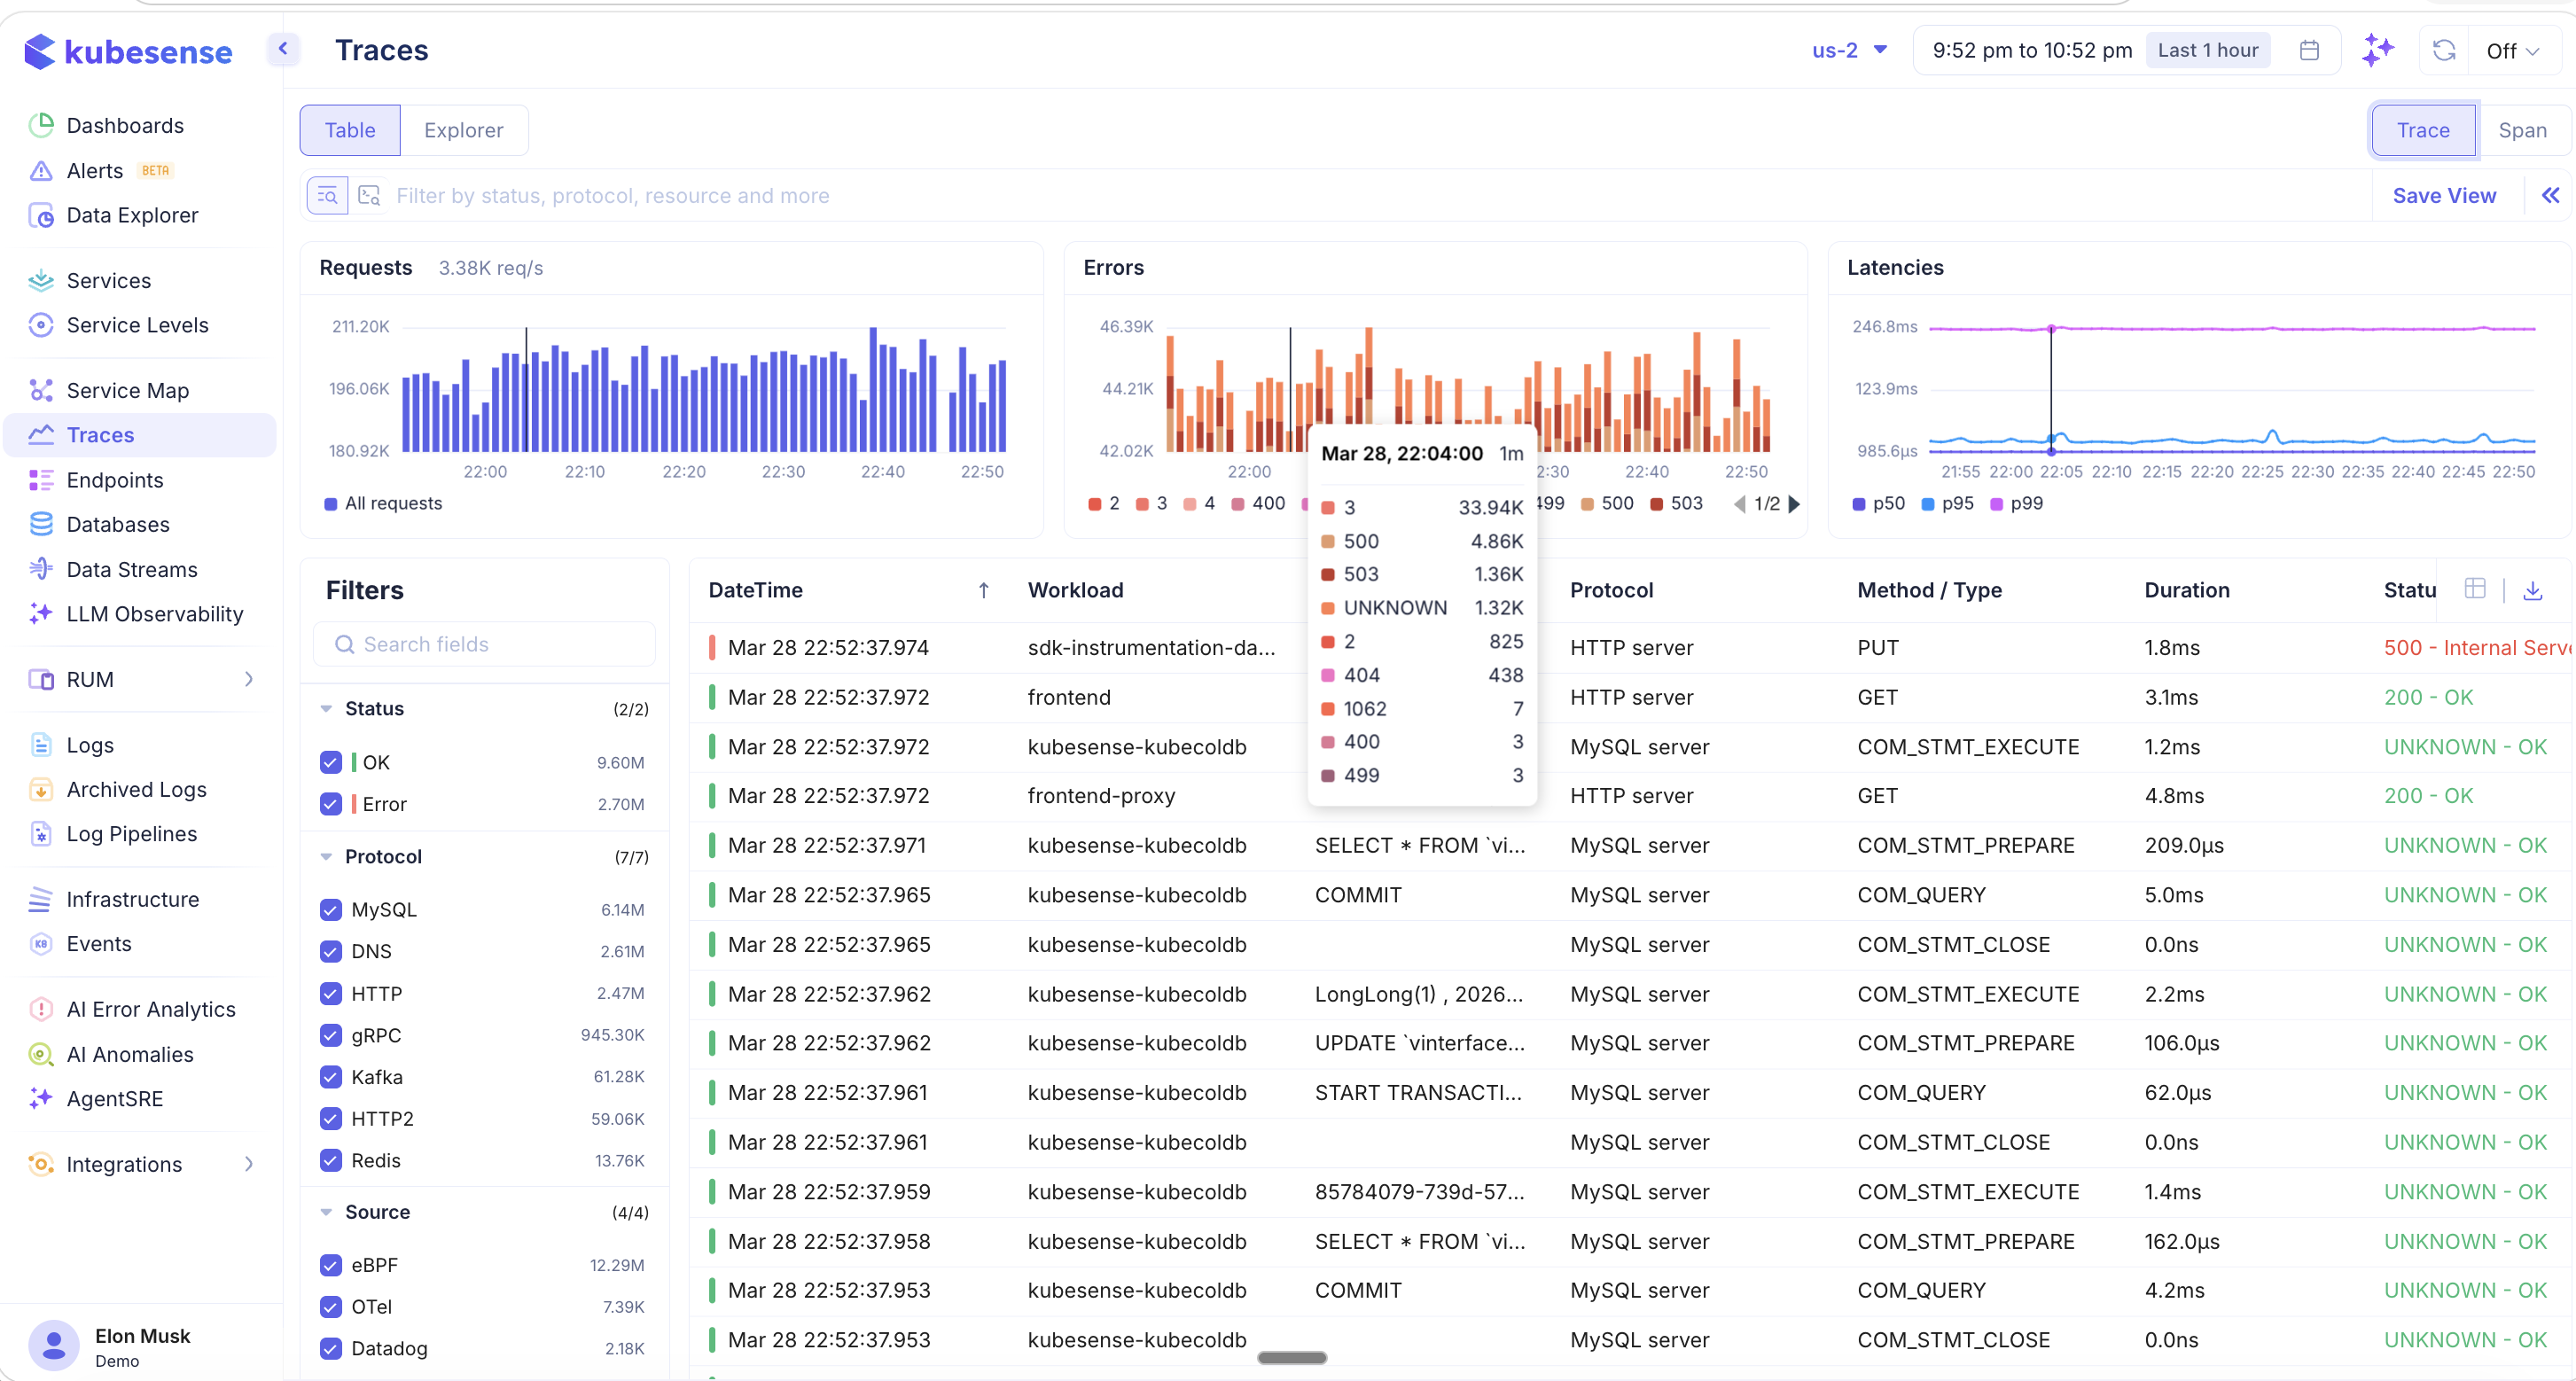
Trace View
Switch to Trace view to see complete end-to-end traces. Each row represents a full distributed trace spanning multiple services.
Both views share the same layout:
- Summary charts at the top — Requests (req/s bar chart), Errors (stacked by status code with tooltip breakdown), and Latencies (P50, P95, P99 trend lines)
- Filter panel on the left
- Trace/Span table in the main area with columns for DateTime, Workload, Resource/Path, Protocol, Method/Type, Duration, and Status
Summary Charts
The three charts at the top provide an at-a-glance view of trace health:
- Requests — Total request throughput over time. Hover to see the exact req/s at any point.
- Errors — Error volume broken down by status code (e.g., 3, 500, 503, UNKNOWN, 2, 404, 405). Hover over any bar to see the per-code breakdown for that time bucket.
- Latencies — Latency percentile trends (P50, P95, P99) over time, helping you spot latency spikes and regressions.
Filters
The left-hand filter panel provides extensive faceted filtering to narrow down traces. Each filter shows the count of matching traces, making it easy to understand the distribution of your data.
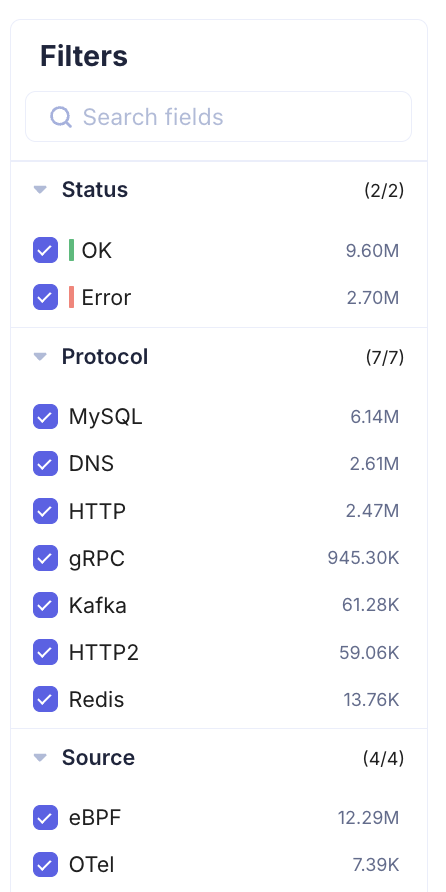
Status
- OK — Successful requests
- Error — Failed requests
Protocol
Filter by the communication protocol detected:
- MySQL, DNS, HTTP, gRPC, Kafka, HTTP2, Redis, TCP, ConnectRPC
Each protocol shows its trace count, so you can immediately see which protocols dominate your traffic.
Source
Filter by instrumentation source:
- eBPF — Kernel-level auto-instrumented traffic (zero-code)
- OTel — OpenTelemetry SDK traces
- Datadog — Datadog agent traces
Additional Filters
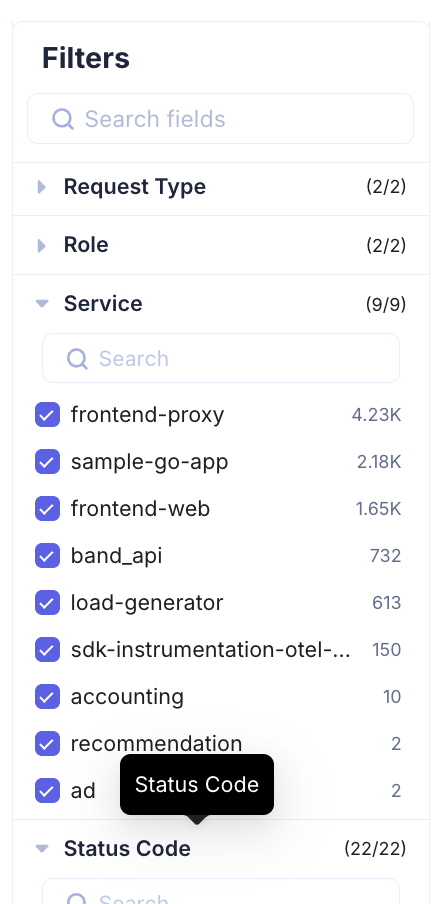
- Request Type — Filter by request type (e.g., server, client)
- Role — Filter by the role of the service in the request
- Service — Filter by specific service names with trace counts (e.g., frontend-proxy: 4.23K, sample-go-app: 2.18K, frontend-web: 1.65K)
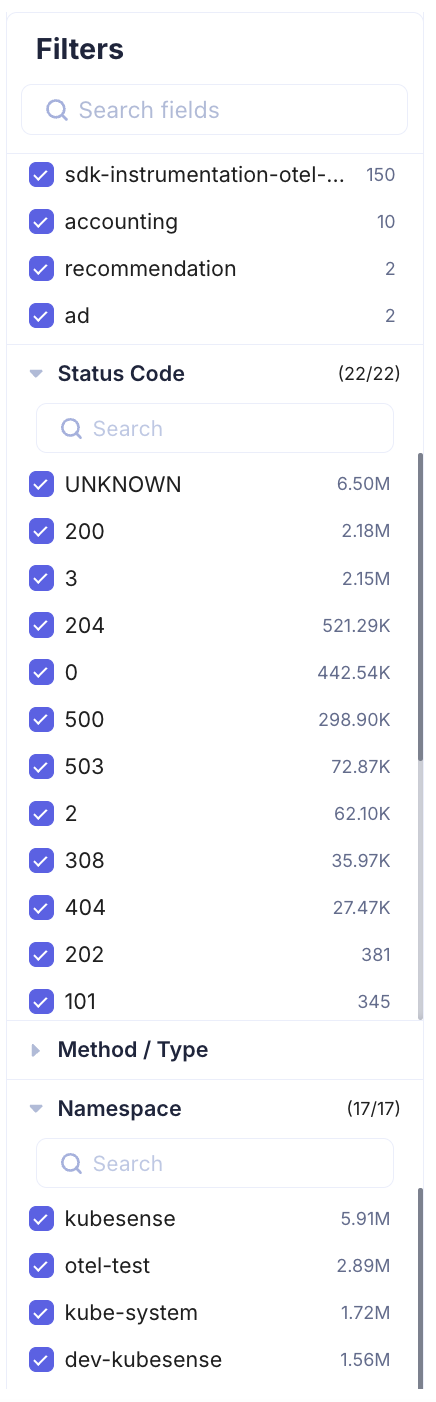
- Status Code — Filter by HTTP/gRPC status codes (UNKNOWN, 200, 204, 500, 503, 308, 404, 202, 101, and more). The count next to each code shows how many traces returned that status.
- Method / Type — Filter by HTTP method (GET, POST, PUT, DELETE) or RPC type
- Namespace — Filter by Kubernetes namespace (e.g., kubesense: 5.91M, otel-test: 2.89M, kube-system: 1.72M)
All filters are searchable — use the search box within any filter section to quickly find a specific value.
Search and Querying
The search bar at the top supports multiple search modes for finding exactly the traces you need.
Tag-Based Search
Click the search bar to see suggested filter keys and your recent searches:
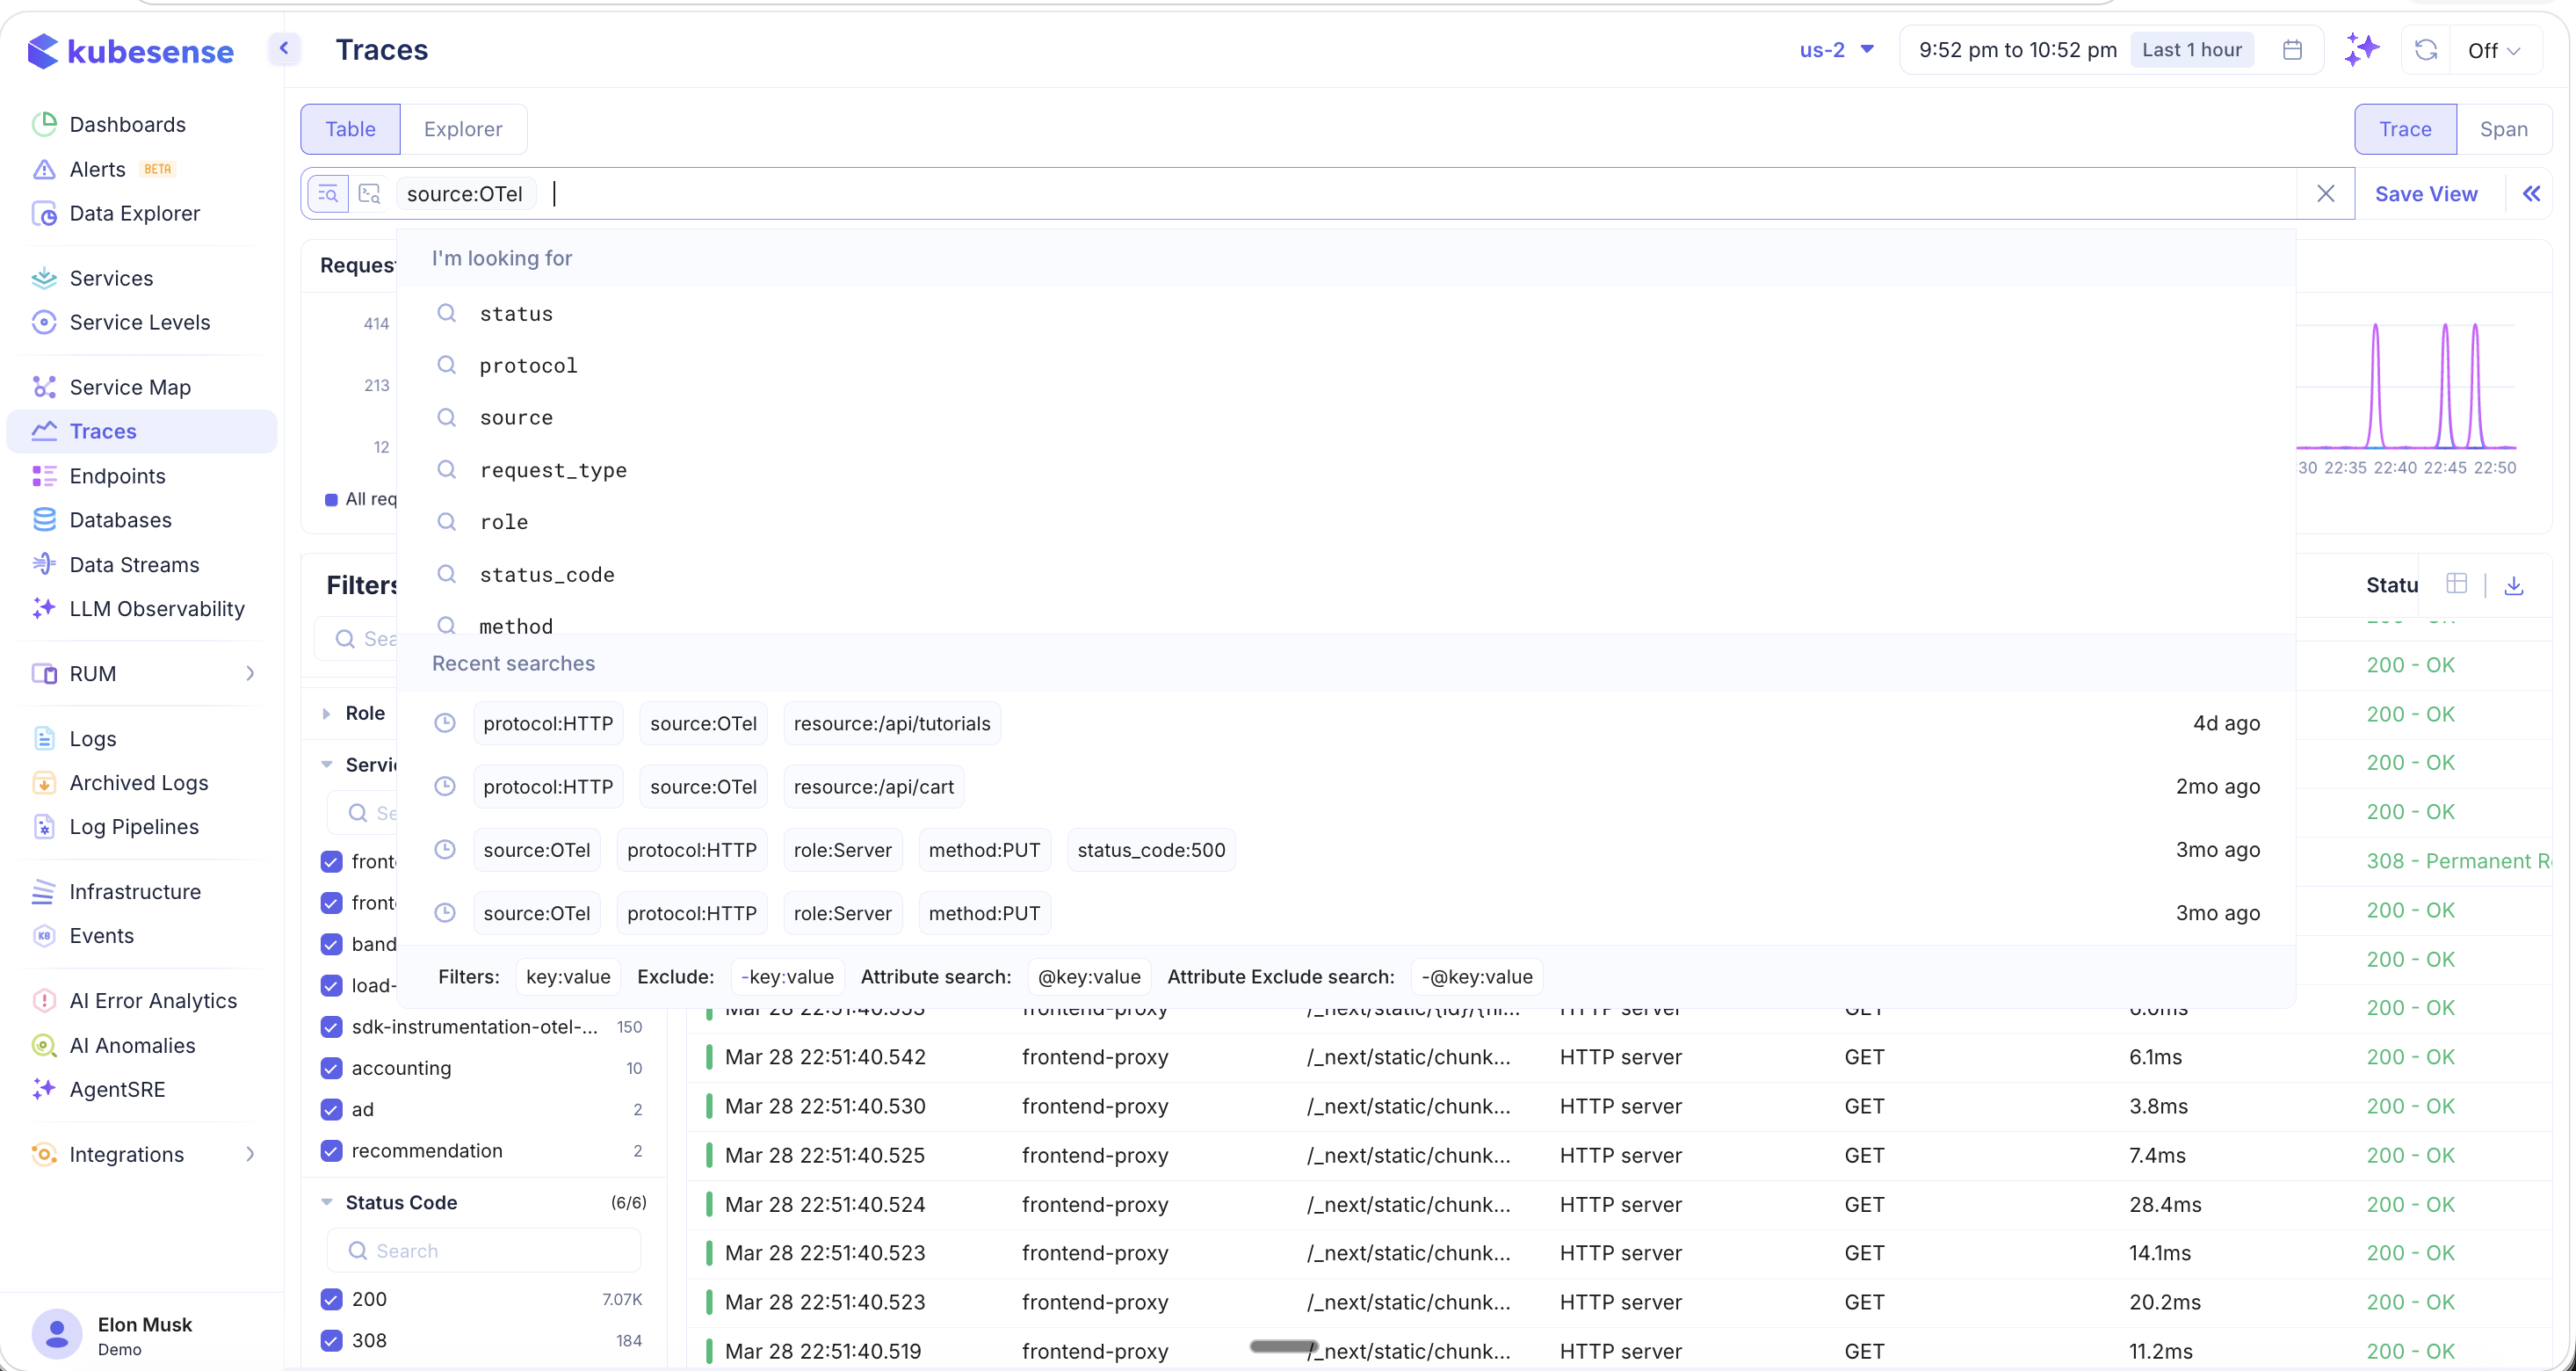
Type a filter in key:value format (e.g., protocol:HTTP, source:OTel) to quickly narrow results. The search bar suggests available keys and shows your recent search combinations with timestamps.
Search syntax reference:
- Filters:
key:value— Include traces matching this key-value pair - Exclude:
-key:value— Exclude traces matching this key-value pair - Attribute search:
@key:value— Search within trace attributes - Attribute exclude:
-@key:value— Exclude by trace attribute
Advanced SQL-Like Search
For complex queries, switch to advanced mode by typing expressions with operators:
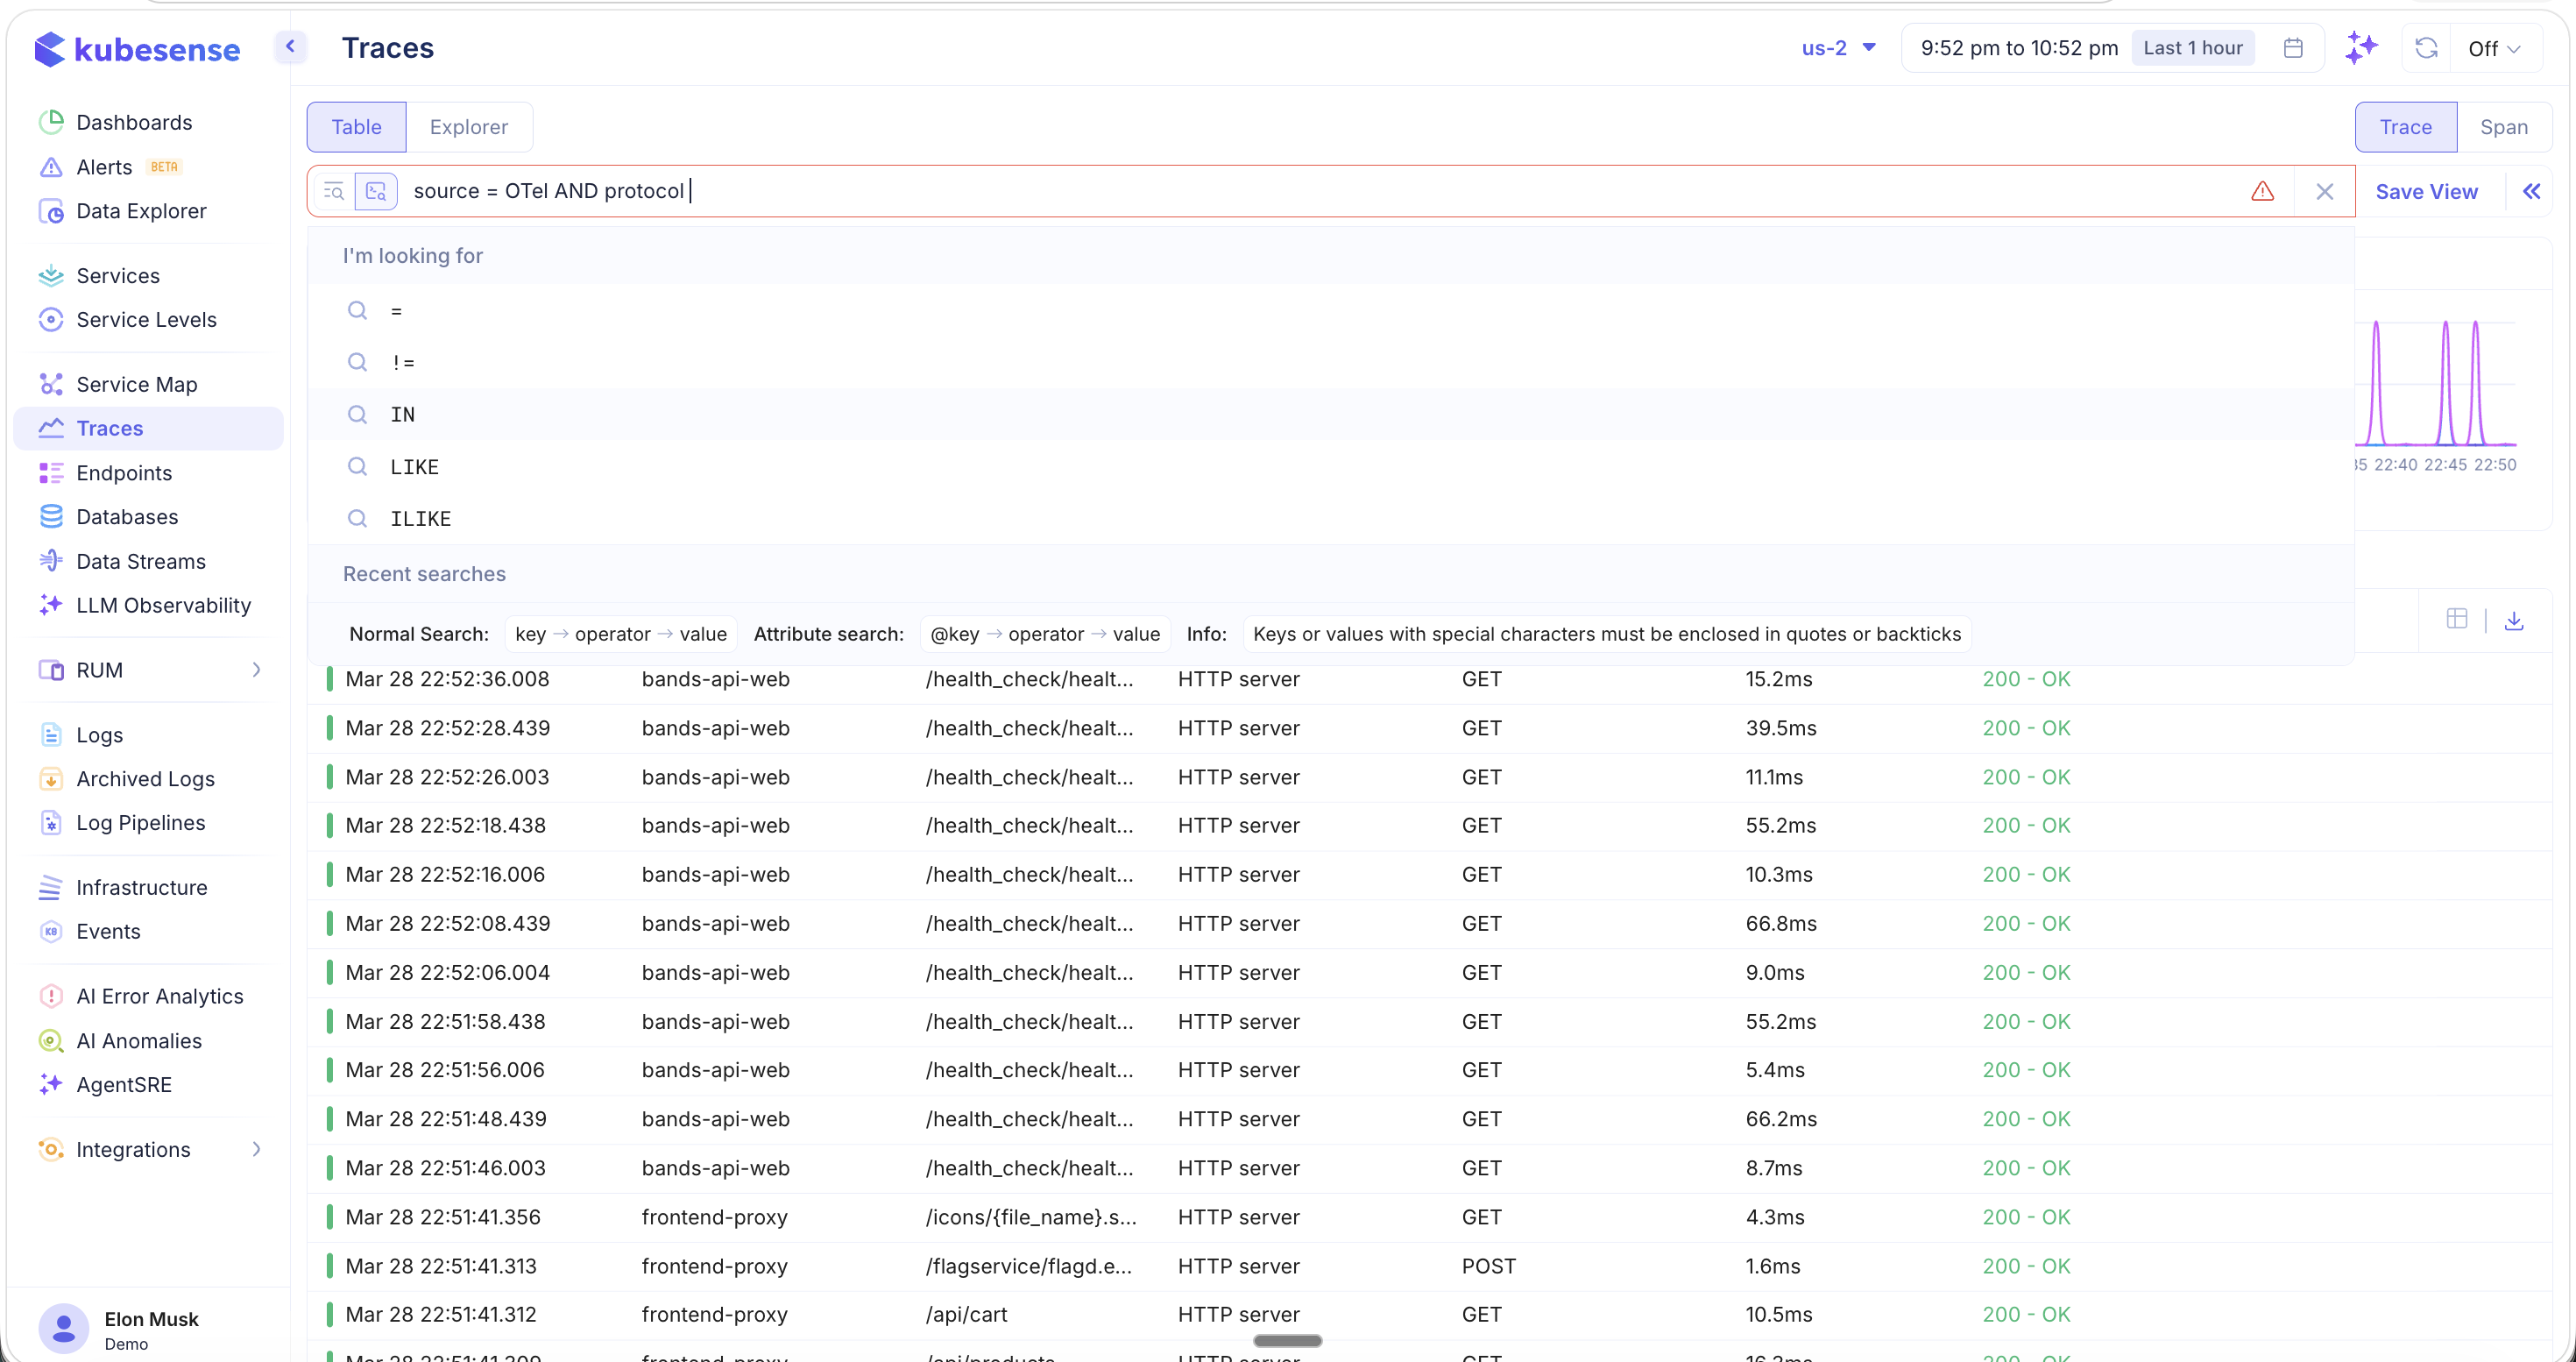
Supported operators:
=— Equals!=— Not equalsIN— Match any value in a setLIKE— Pattern matchingILIKE— Case-insensitive pattern matching
Combine conditions with AND / OR (e.g., source = OTel AND protocol = HTTP). Keys or values with special characters must be enclosed in quotes or backticks.
Attribute Search
Type @ in the search bar to search directly on trace attributes. This surfaces all extracted span attributes with their counts:
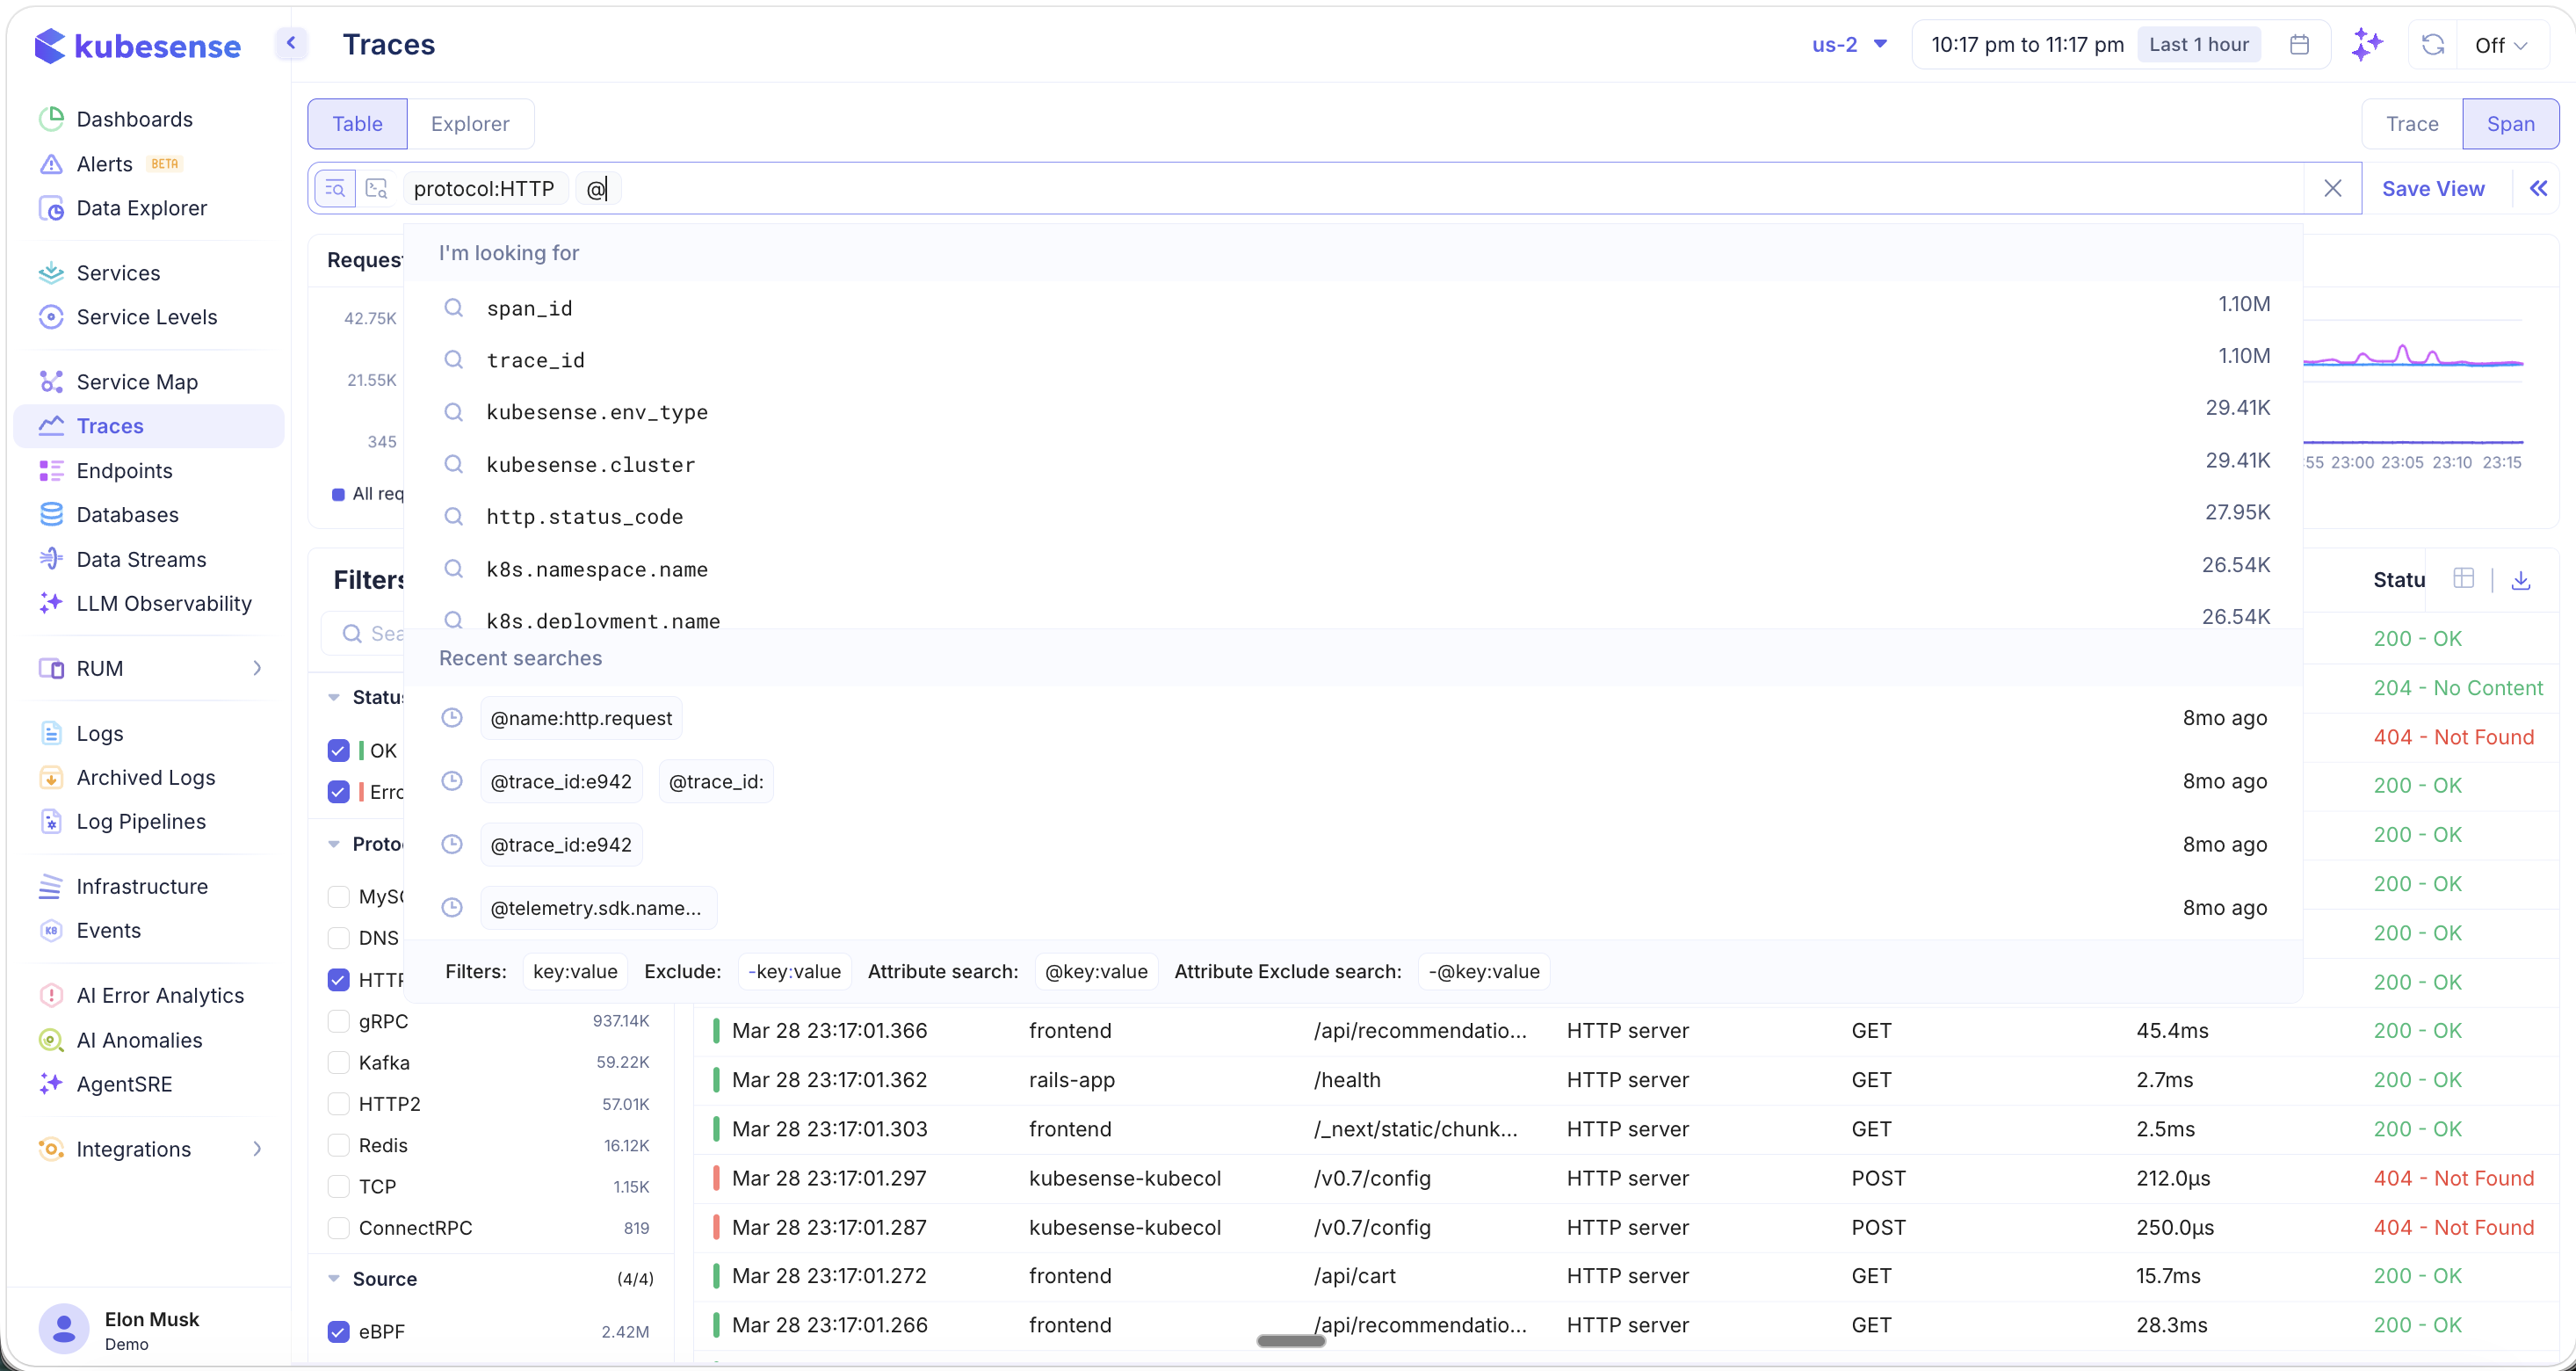
Available attributes include system-level fields like span_id, trace_id, kubesense.env_type, kubesense.cluster, http.status_code, k8s.namespace.name, and k8s.deployment.name.
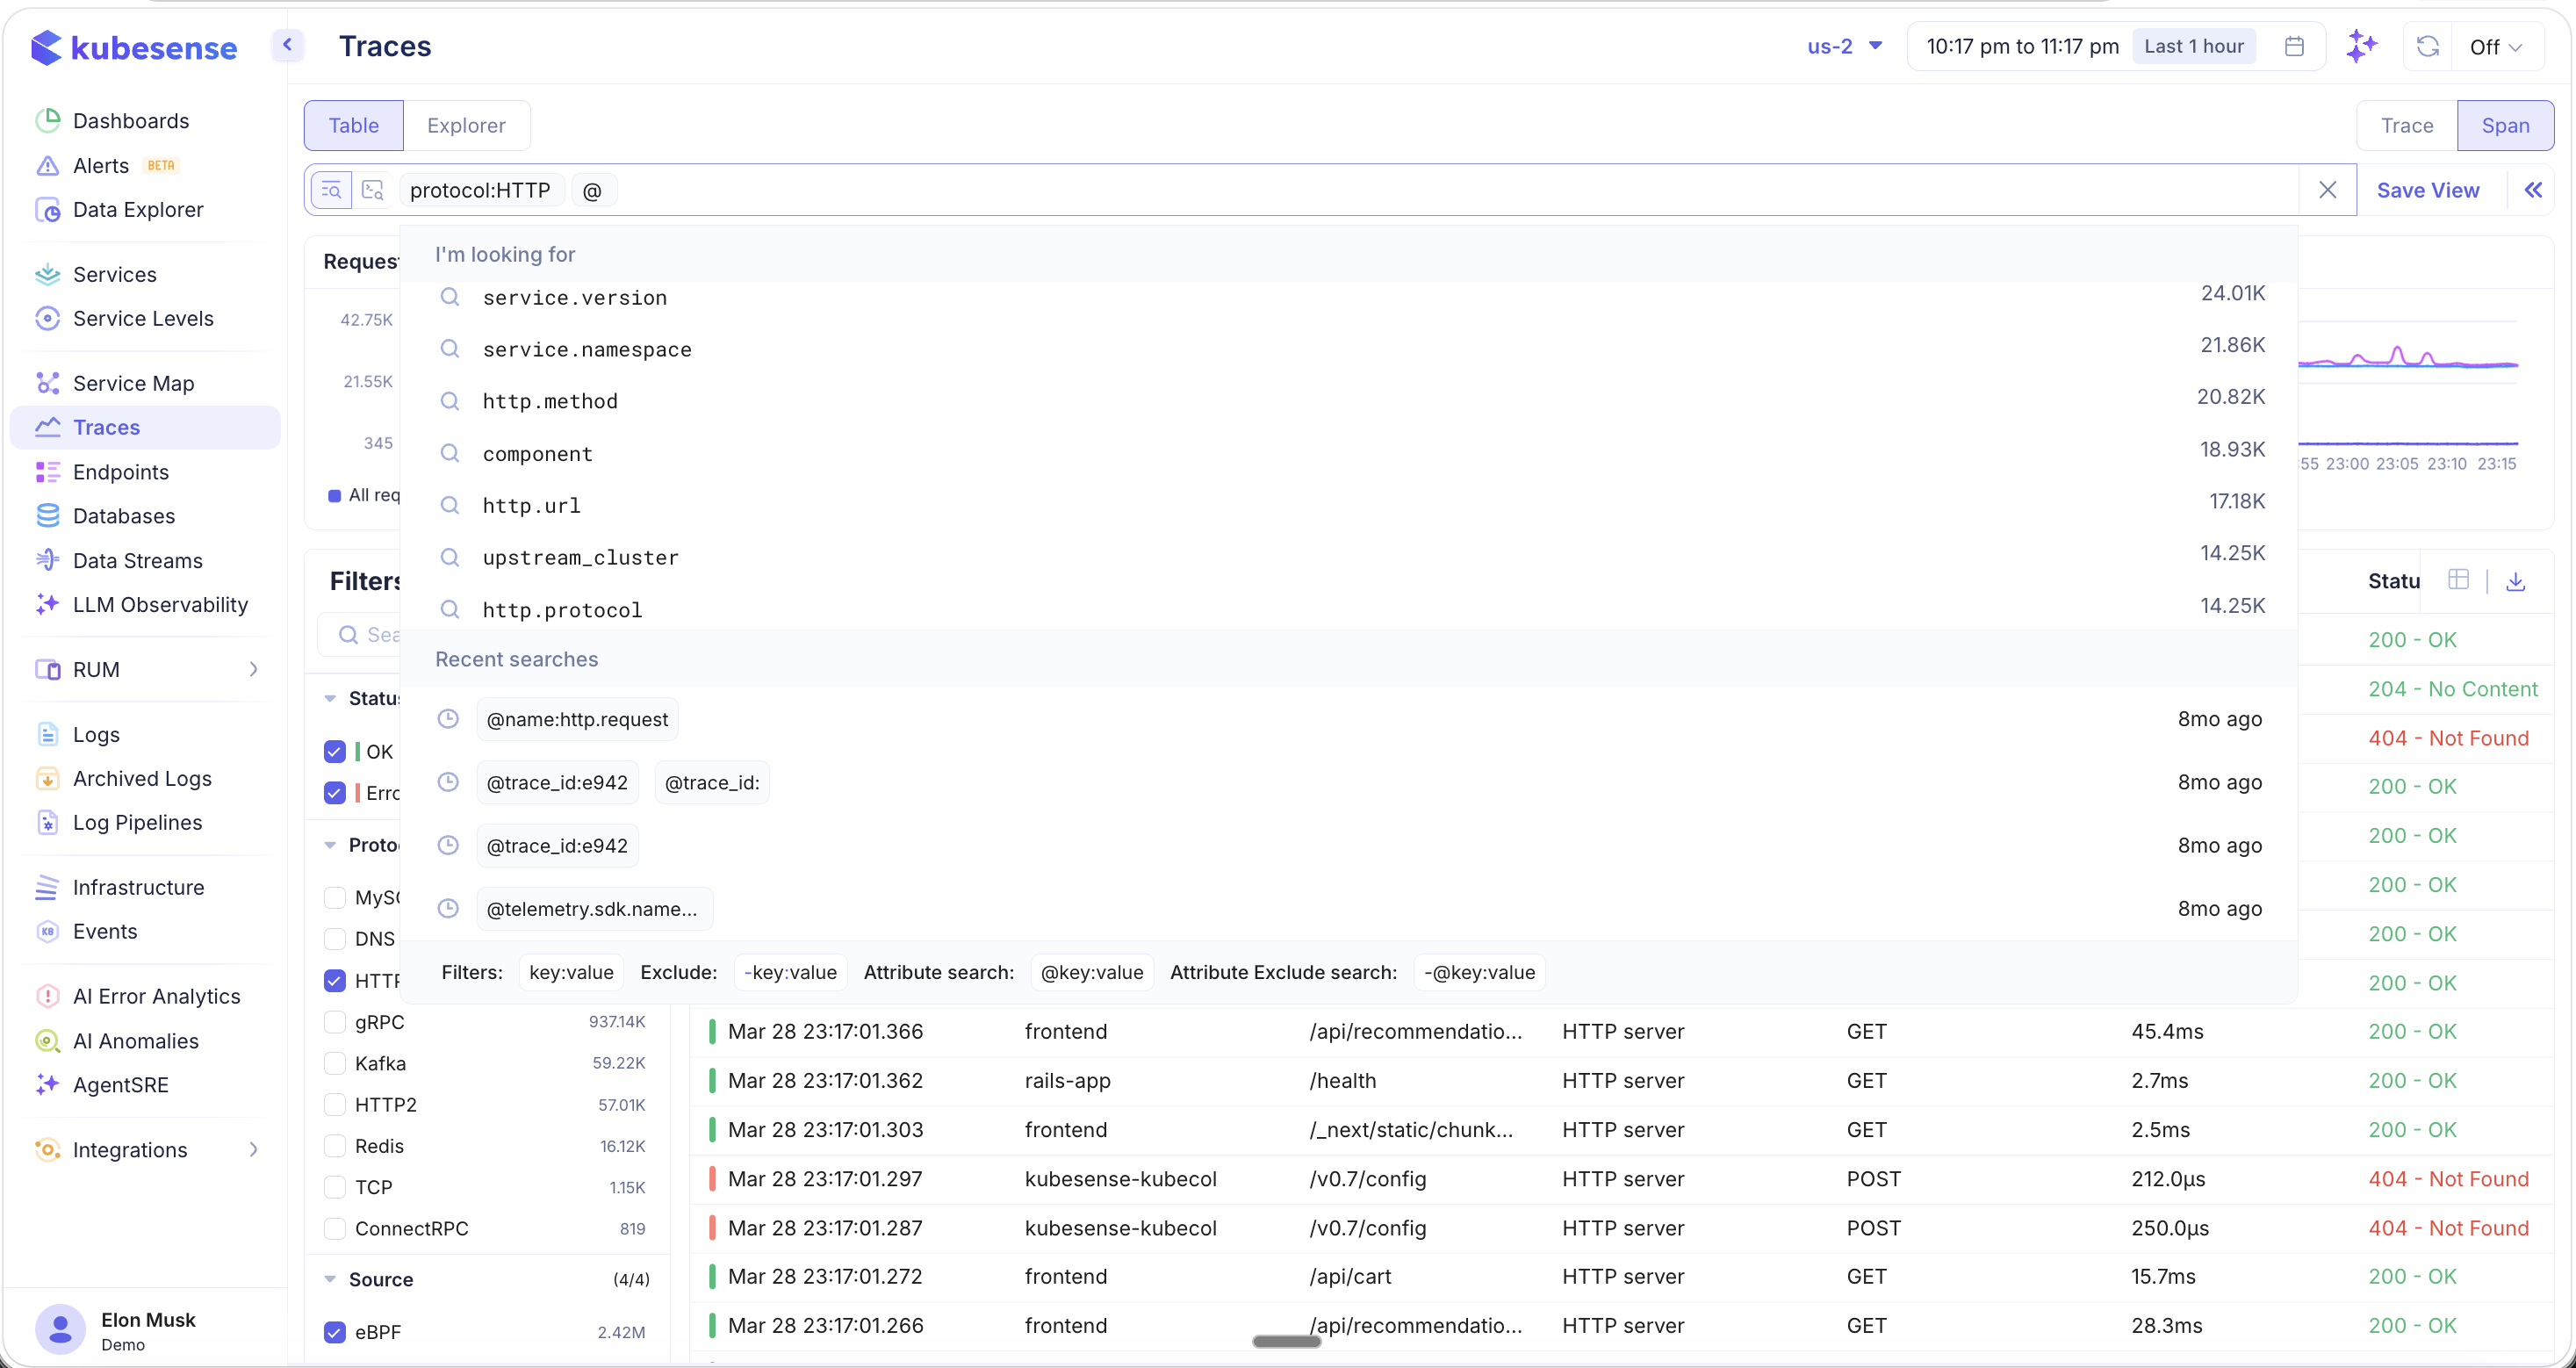
Additional attributes include service.version, service.namespace, http.method, component, http.url, upstream_cluster, and http.protocol — enabling deep, attribute-level filtering across all your trace data.
Saved Views
Click Save View to persist your current search query and filter configuration as a reusable view. Views can be scoped as:
- Global — Visible to all team members
- User — Private to your account
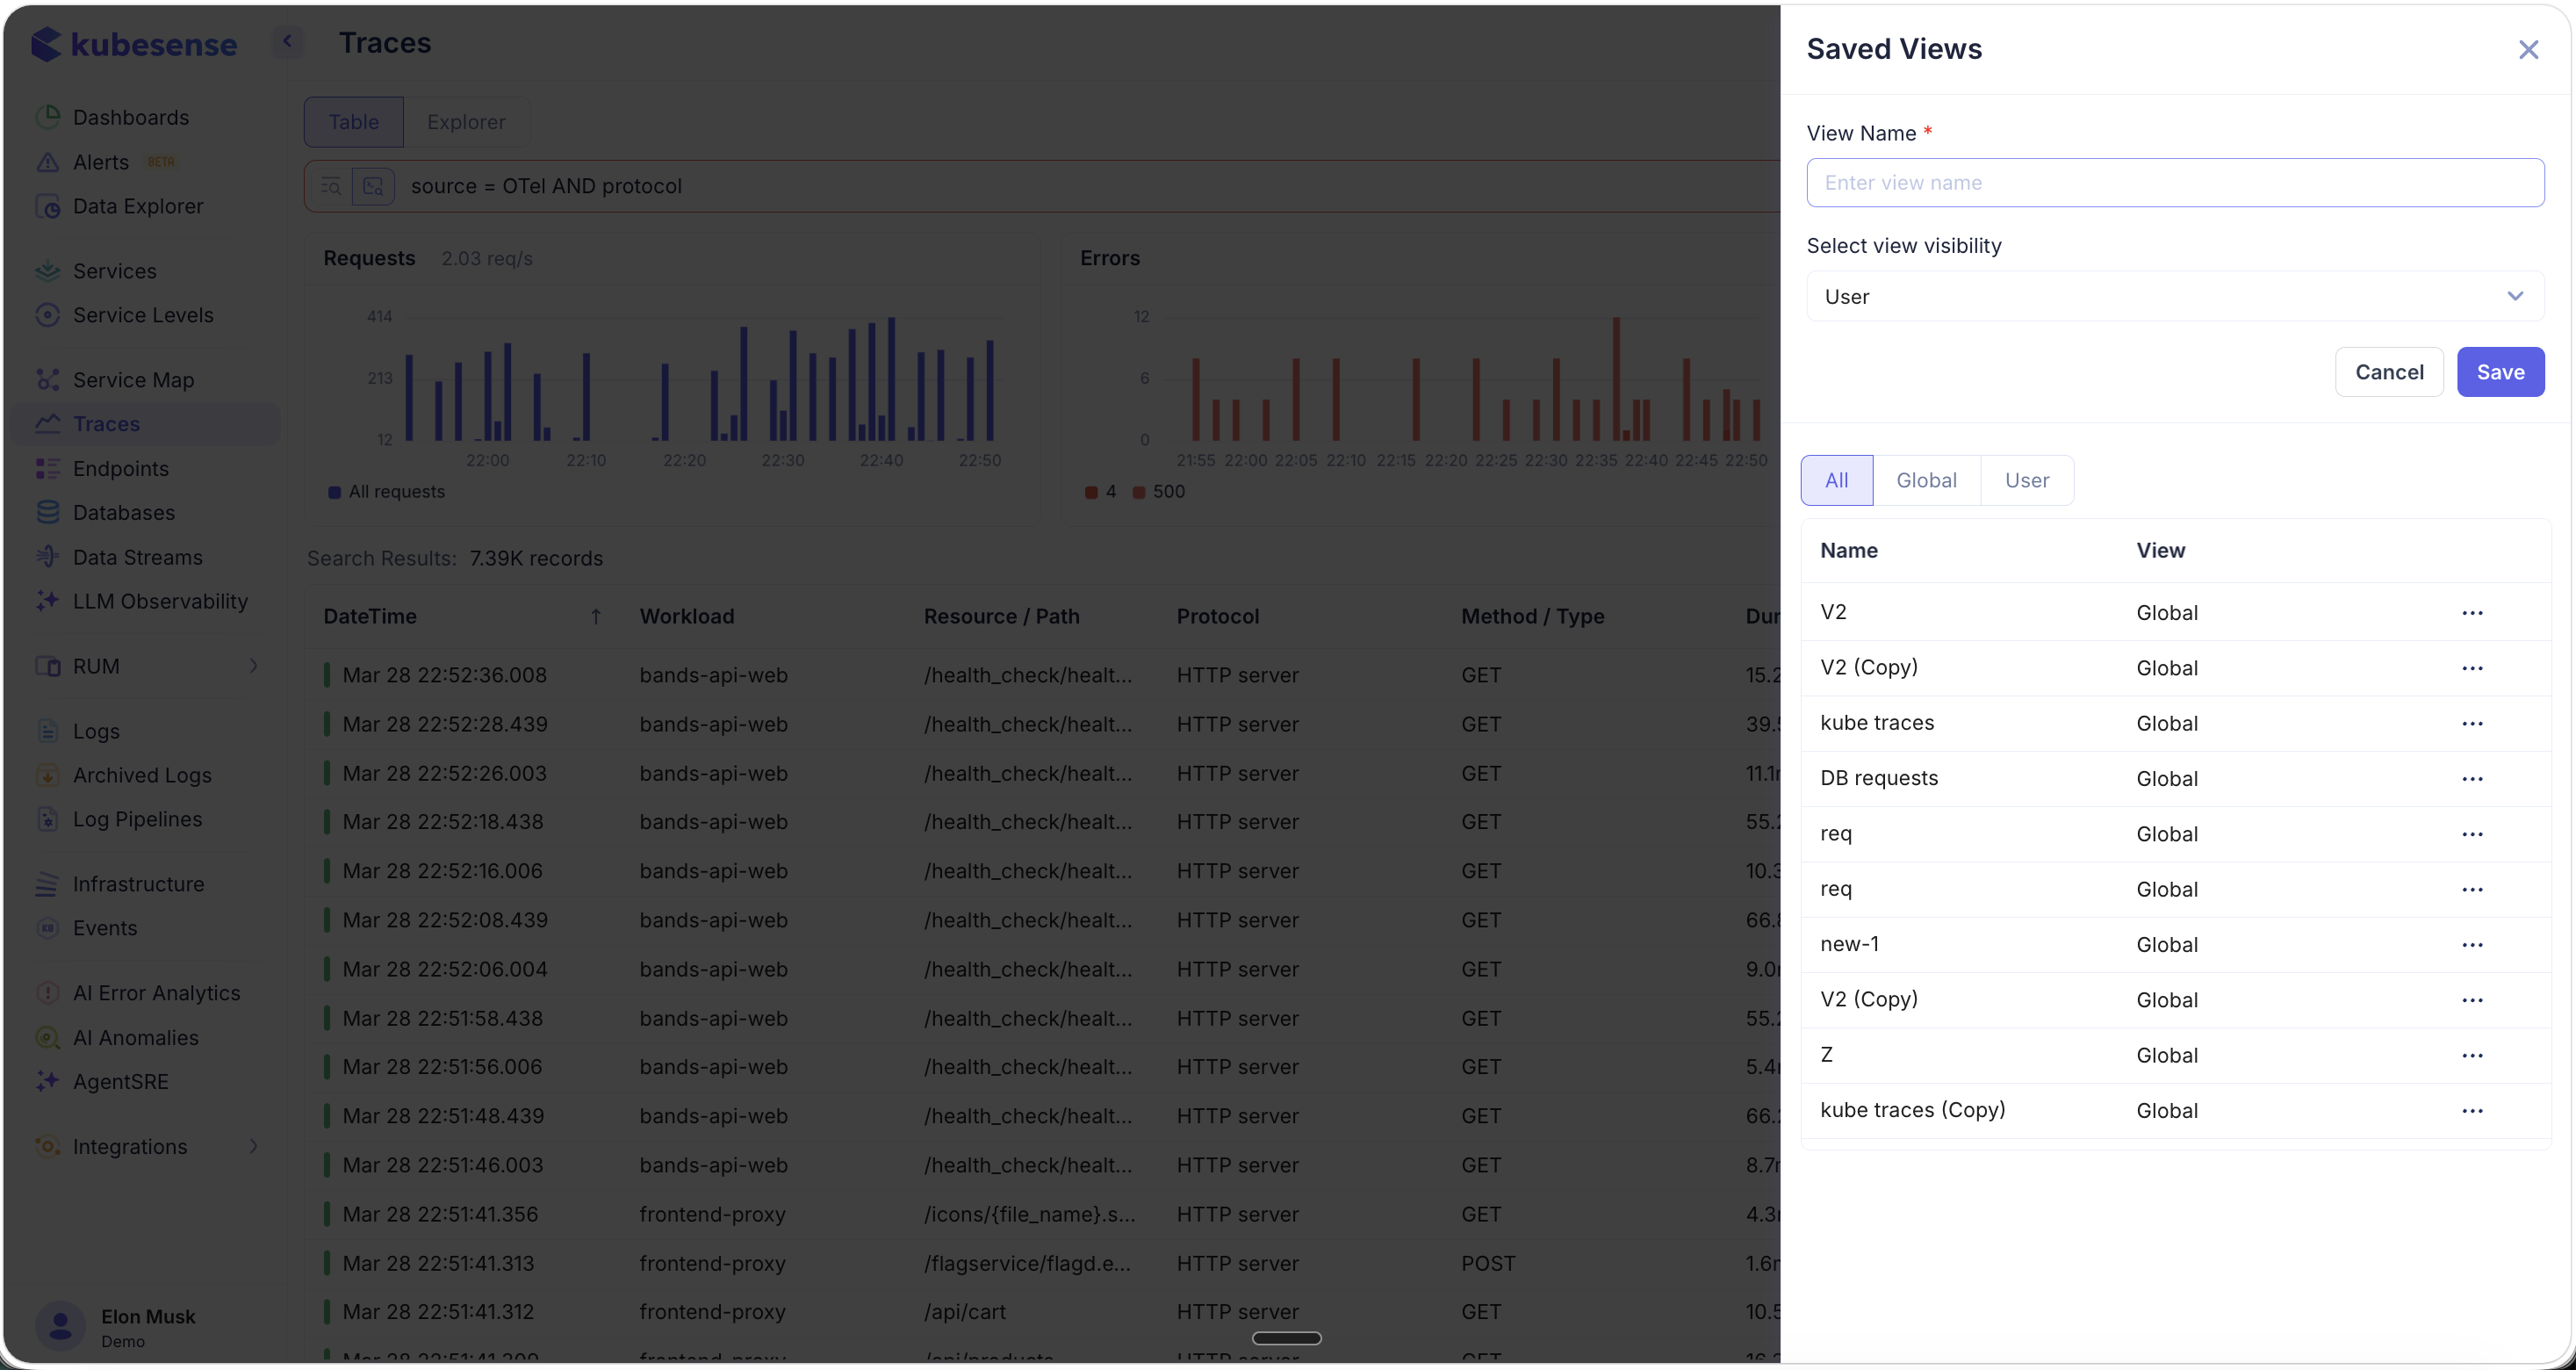
The Saved Views panel lists all existing views with their name, visibility scope, and an options menu for managing them. This is ideal for creating team-wide views like "DB requests", "kube traces", or protocol-specific investigations.
Trace Detail
Click any trace or span row to open the Trace Detail panel. The header shows the protocol, timestamp, total duration, method, resource path, status, and key metadata (server, client, namespace, resource, instance).
Waterfall
The Waterfall tab shows the full distributed trace as a timeline of nested spans across services. Each span displays the service name, operation, status code, and a proportional duration bar.
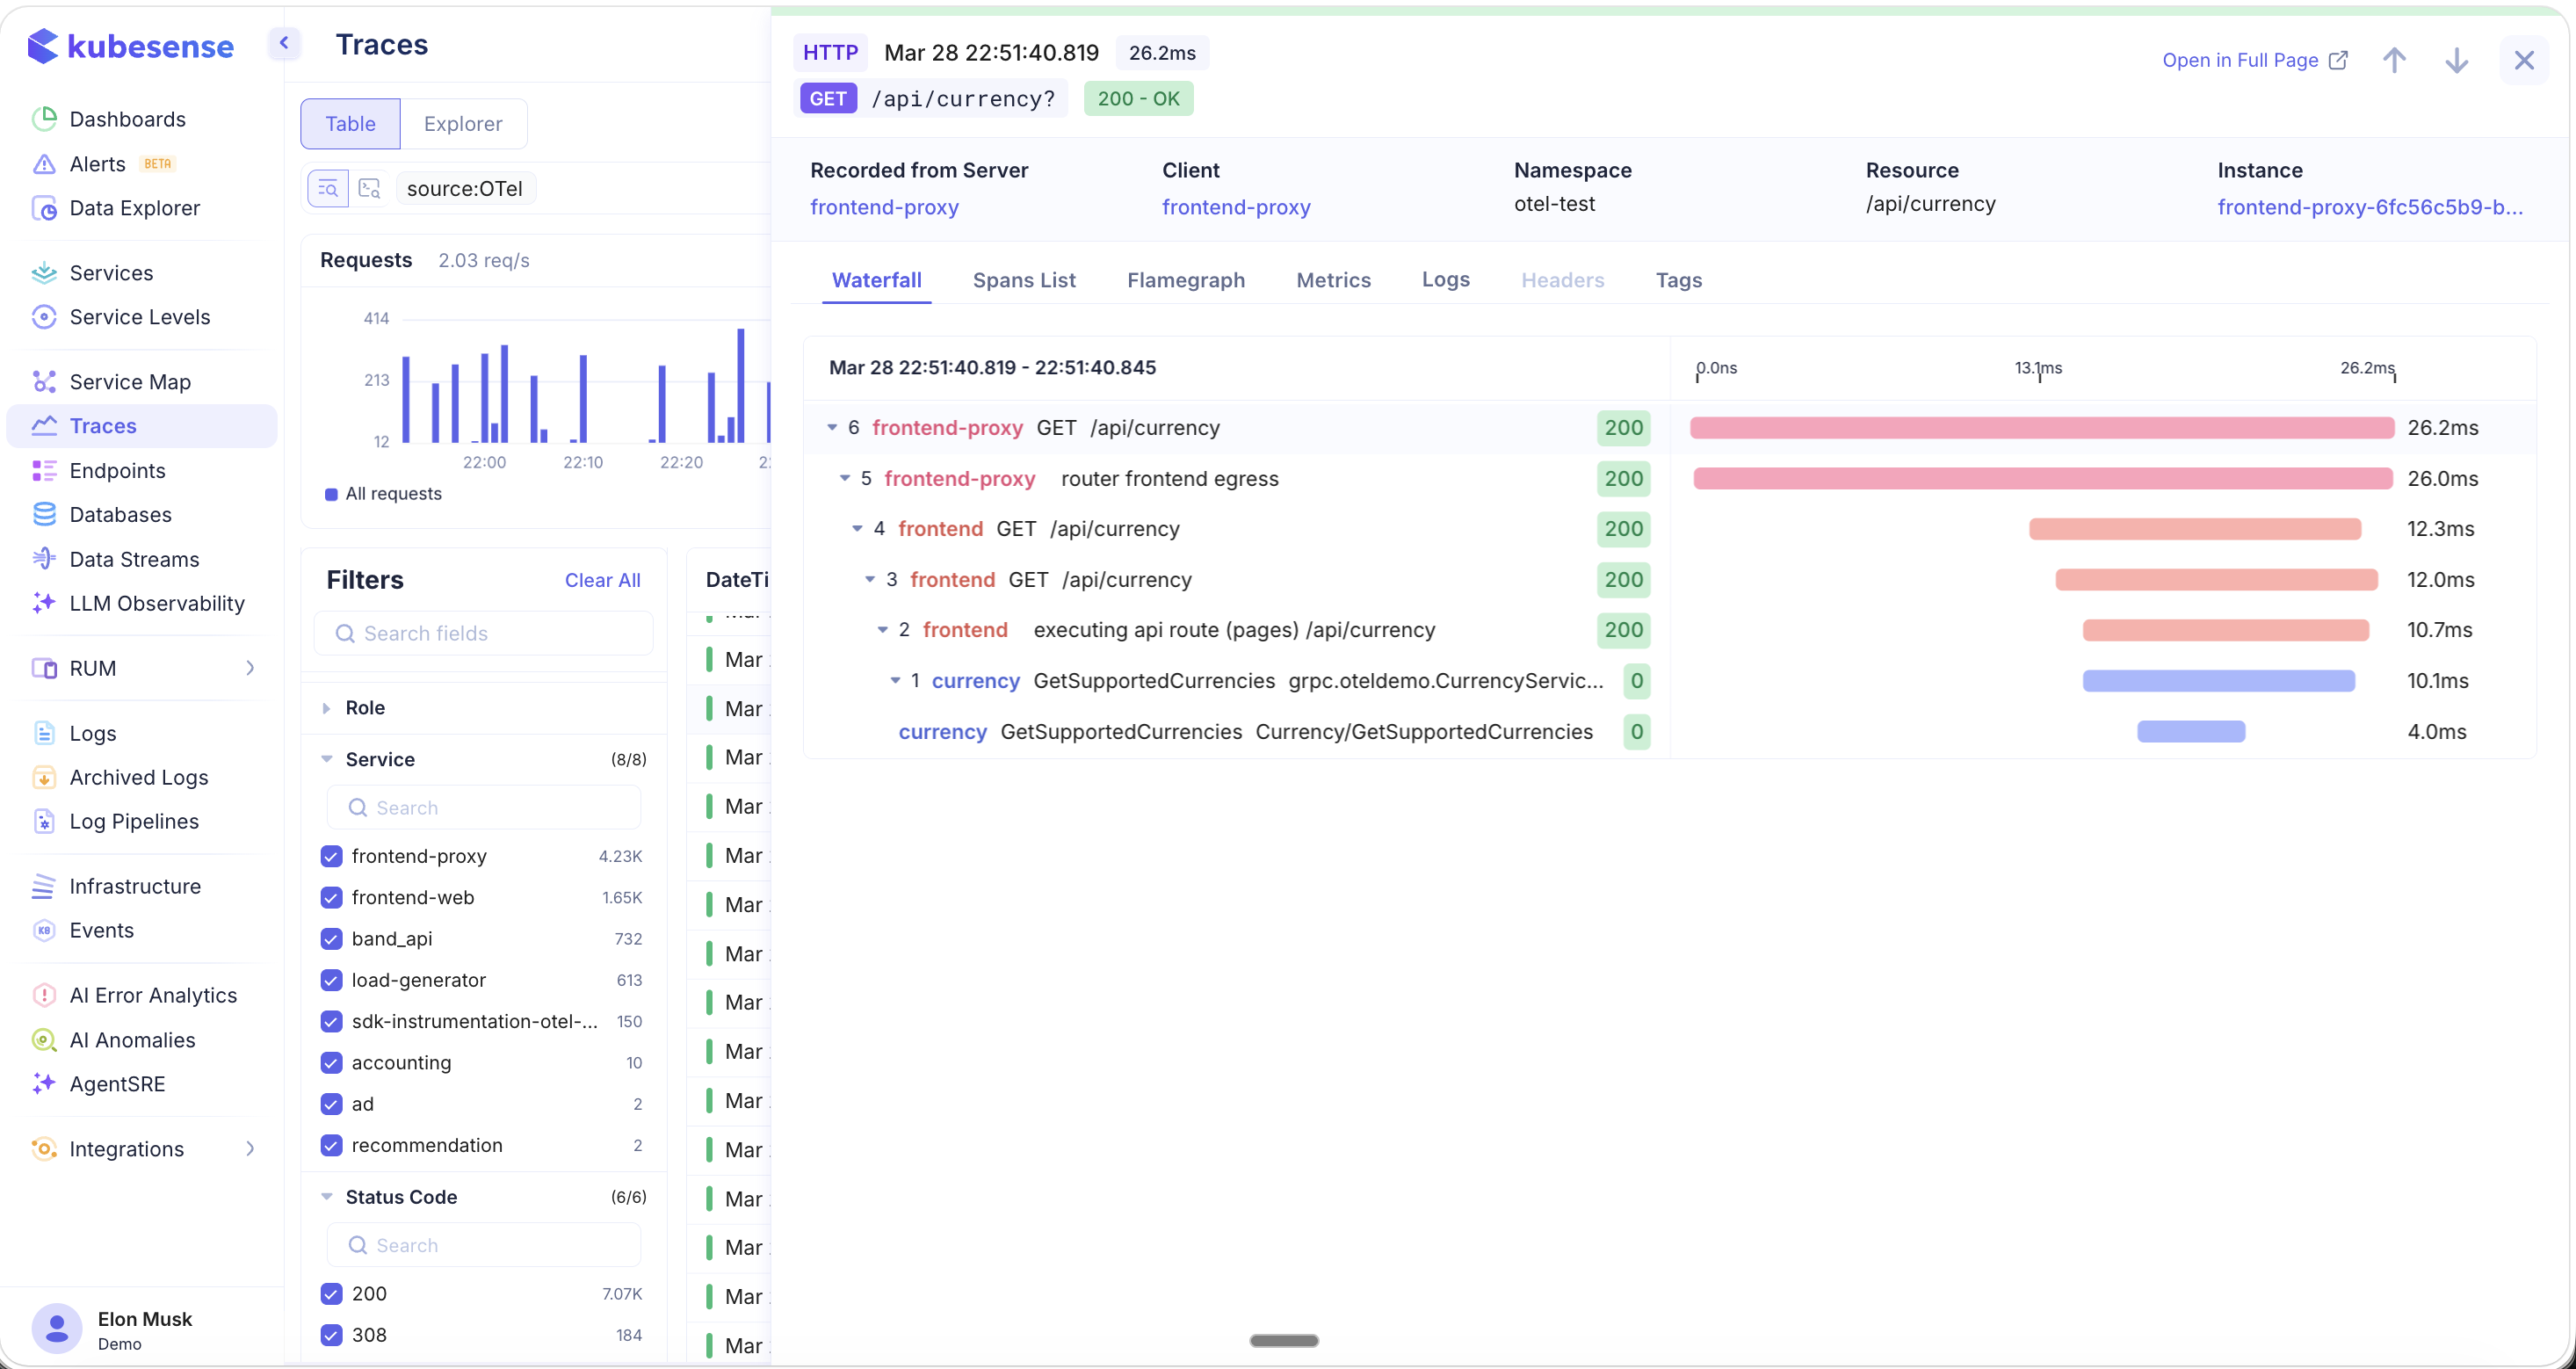
The waterfall makes it easy to see:
- The full request flow from entry point to downstream dependencies
- Which spans are nested within others (parent-child relationships)
- Where time is being spent across services
- Status codes at each hop (green for success, red/orange for errors)
Spans List
The Spans List tab provides a tabular breakdown of all spans grouped by workload. For each workload, you can see:
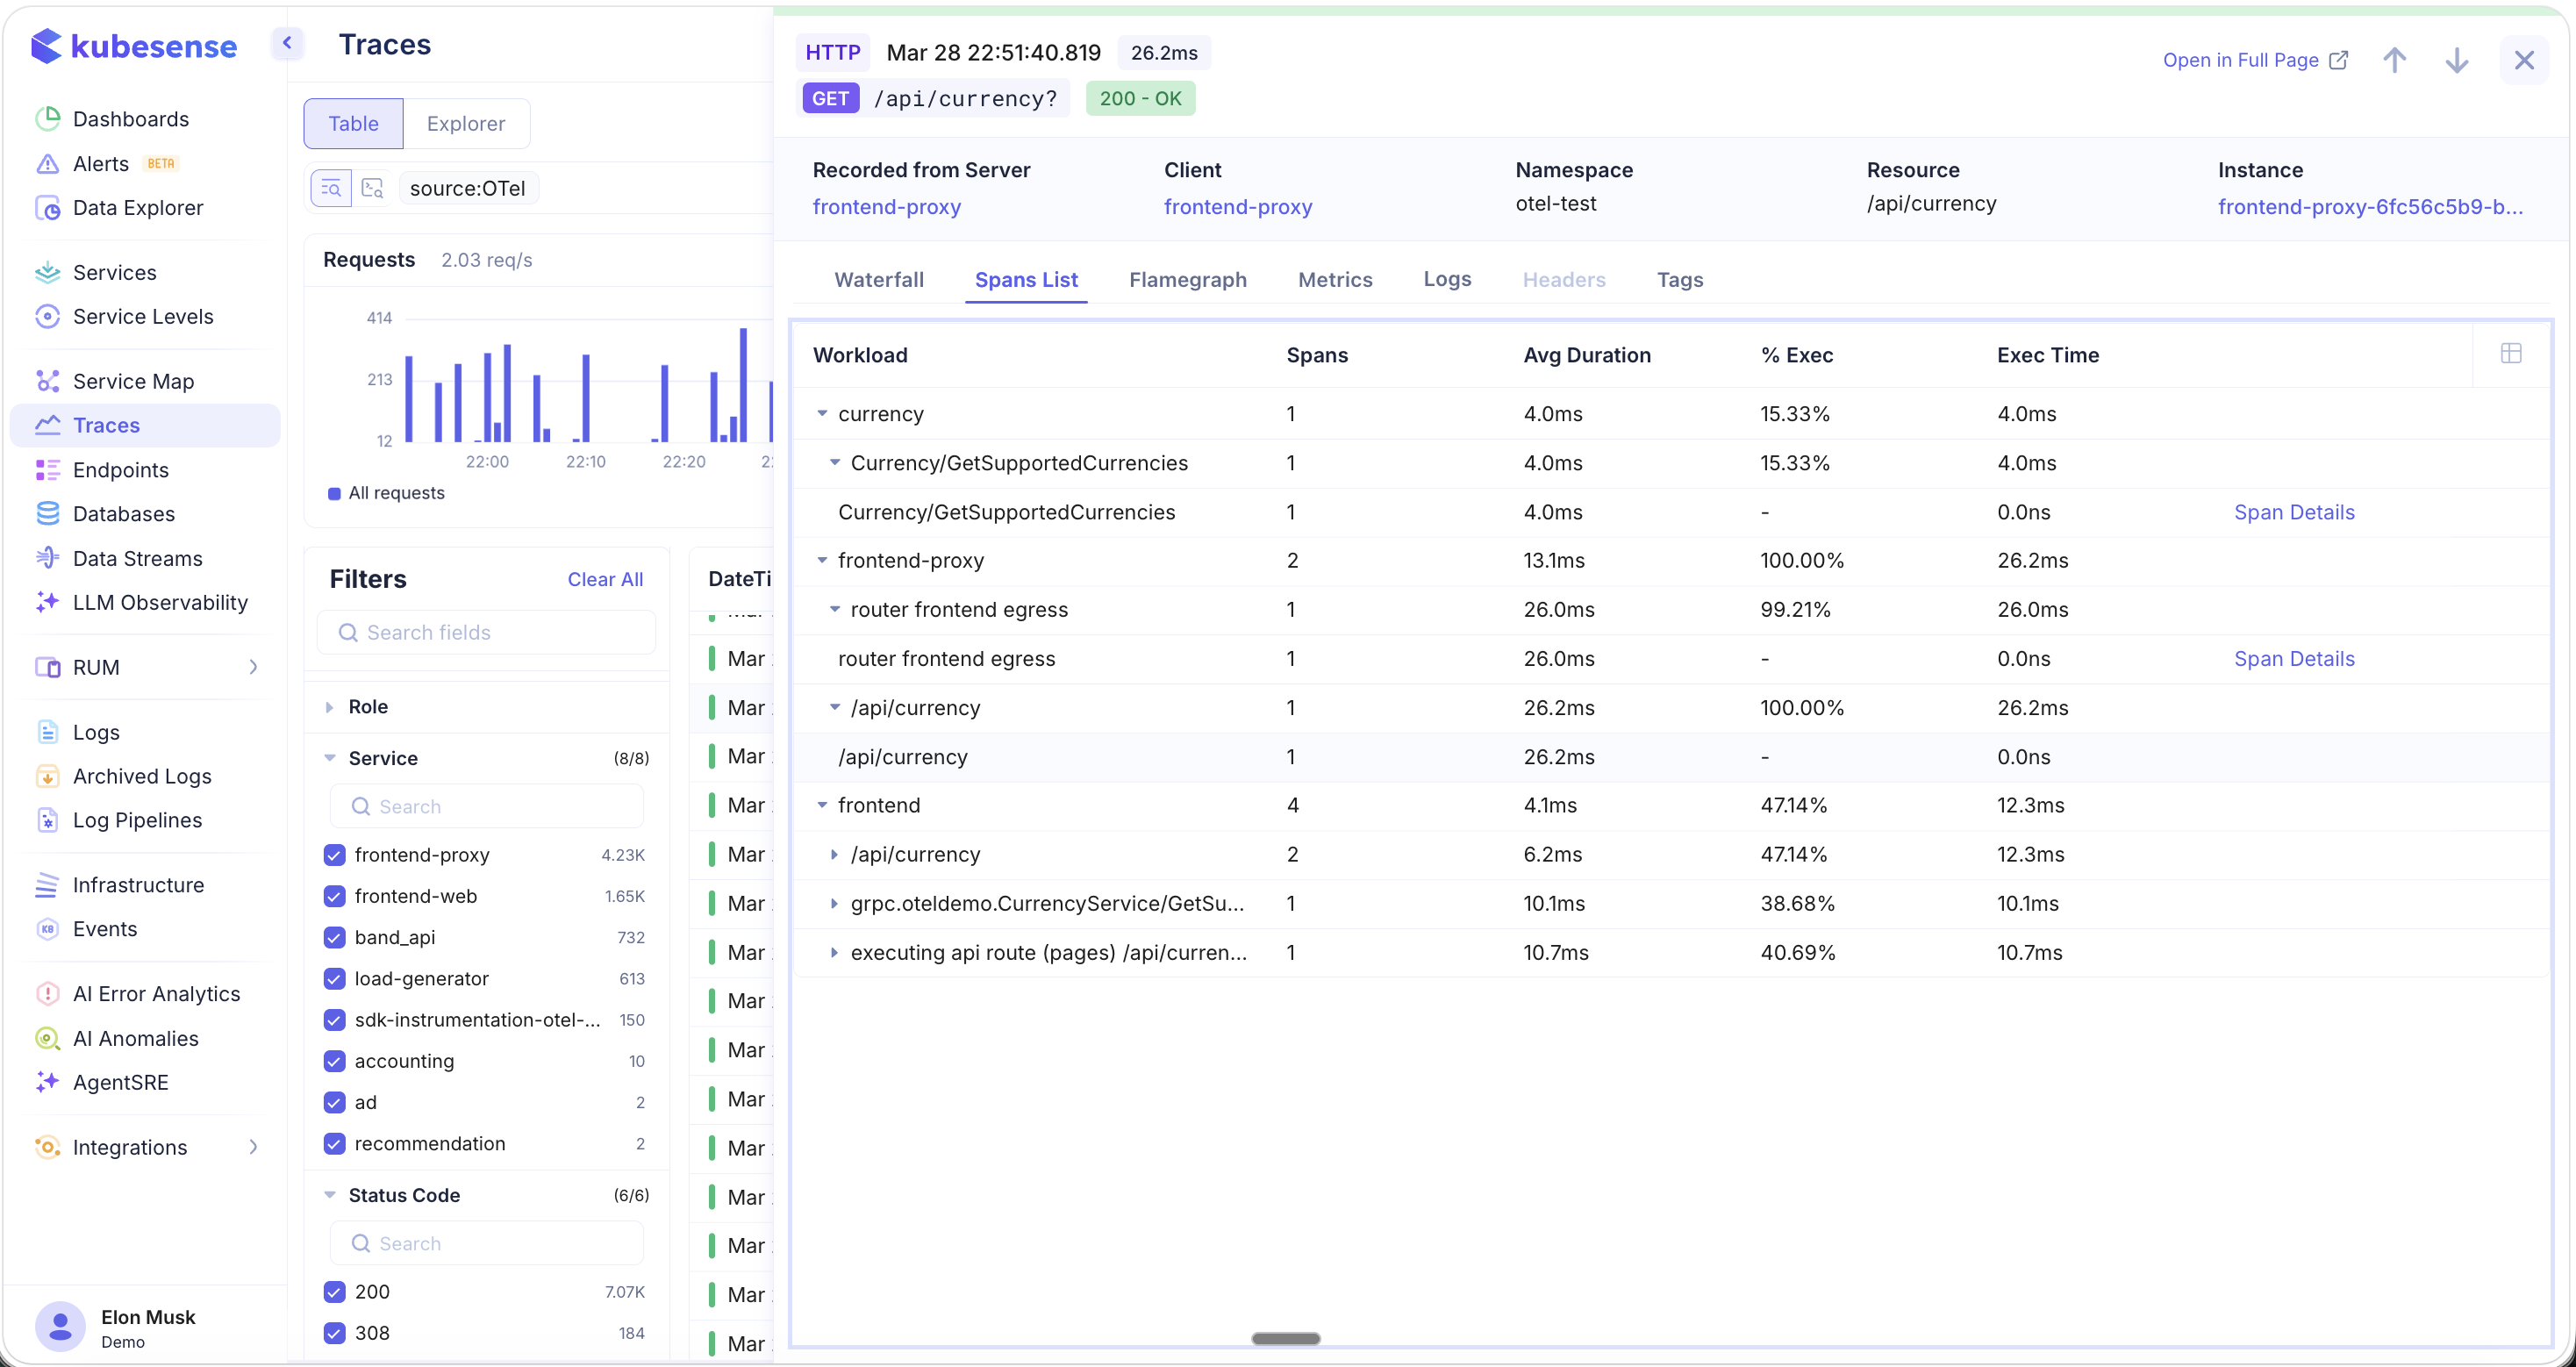
- Workload — The service that produced the span
- Spans — Number of spans from this workload
- Avg Duration — Average span duration
- % Exec — Percentage of total trace execution time
- Exec Time — Absolute execution time
Click Span Details to drill into an individual span's attributes and metadata.
Flamegraph
The Flamegraph tab visualizes the trace as a flame chart, where the width of each block represents the proportion of time spent in that operation. Blocks are color-coded by service.
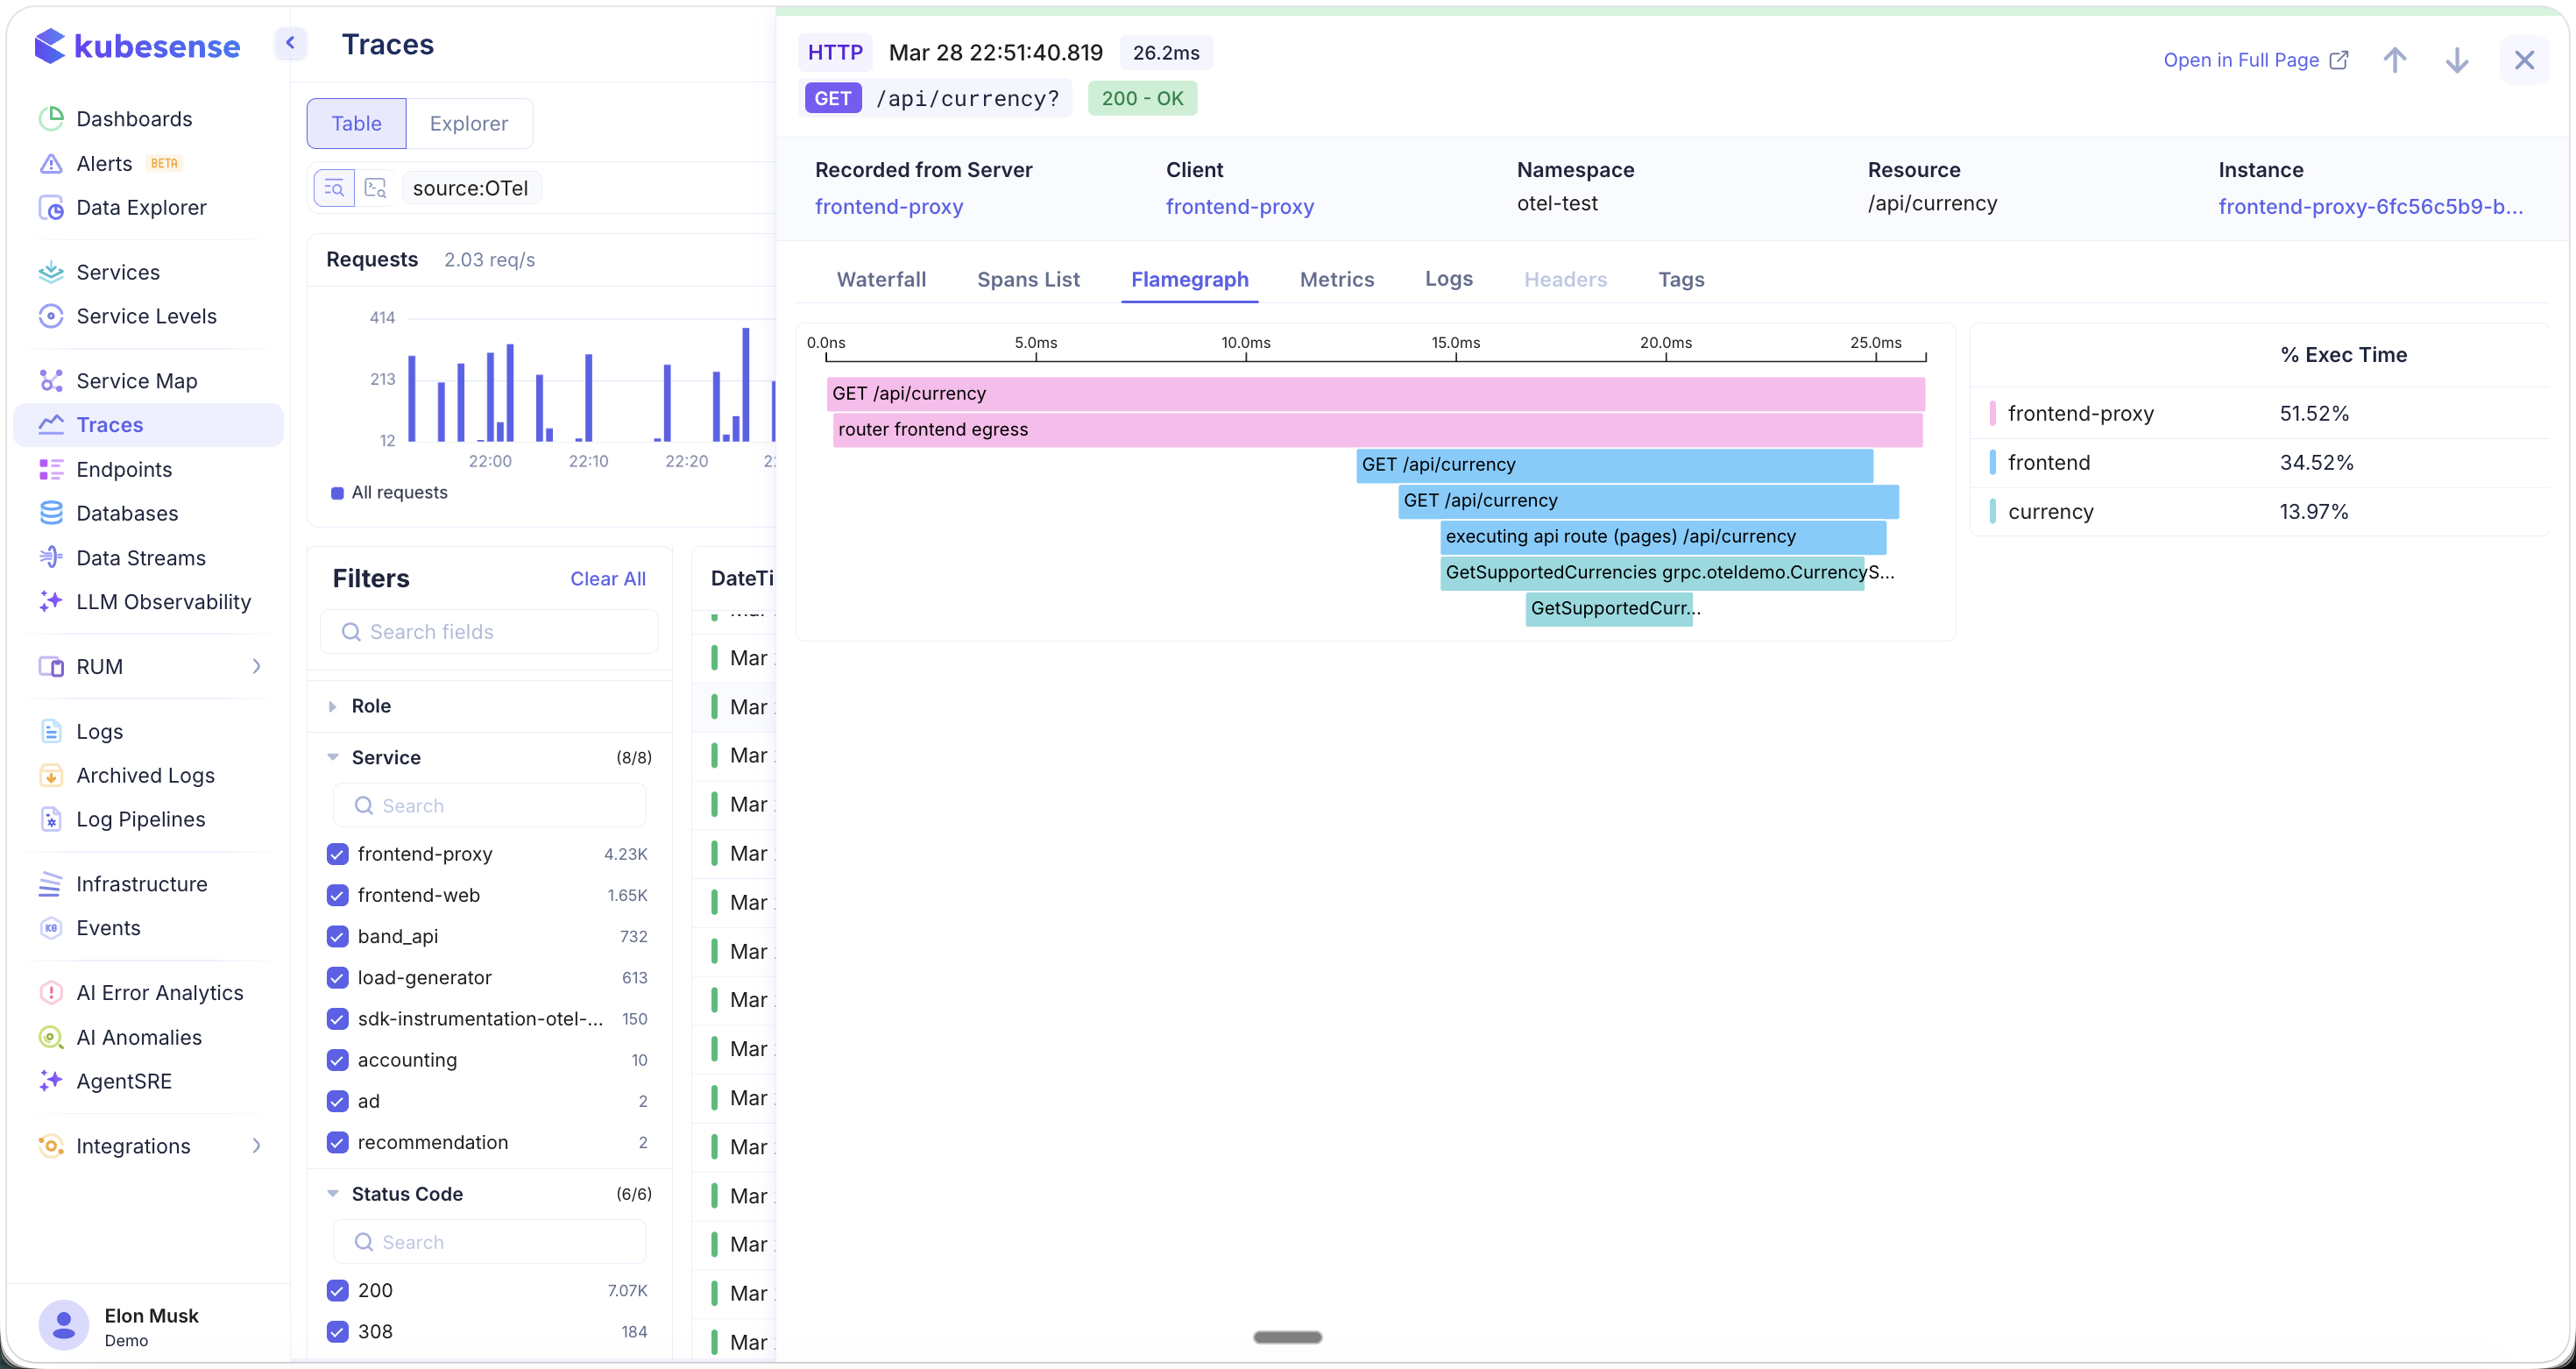
The right-hand legend shows the % Exec Time breakdown by service (e.g., frontend-proxy: 51.52%, frontend: 34.52%, currency: 13.97%), making it immediately clear which services dominate the trace duration.
Metrics
The Metrics tab shows the surrounding infrastructure metrics at the time of the trace, providing context for performance issues:
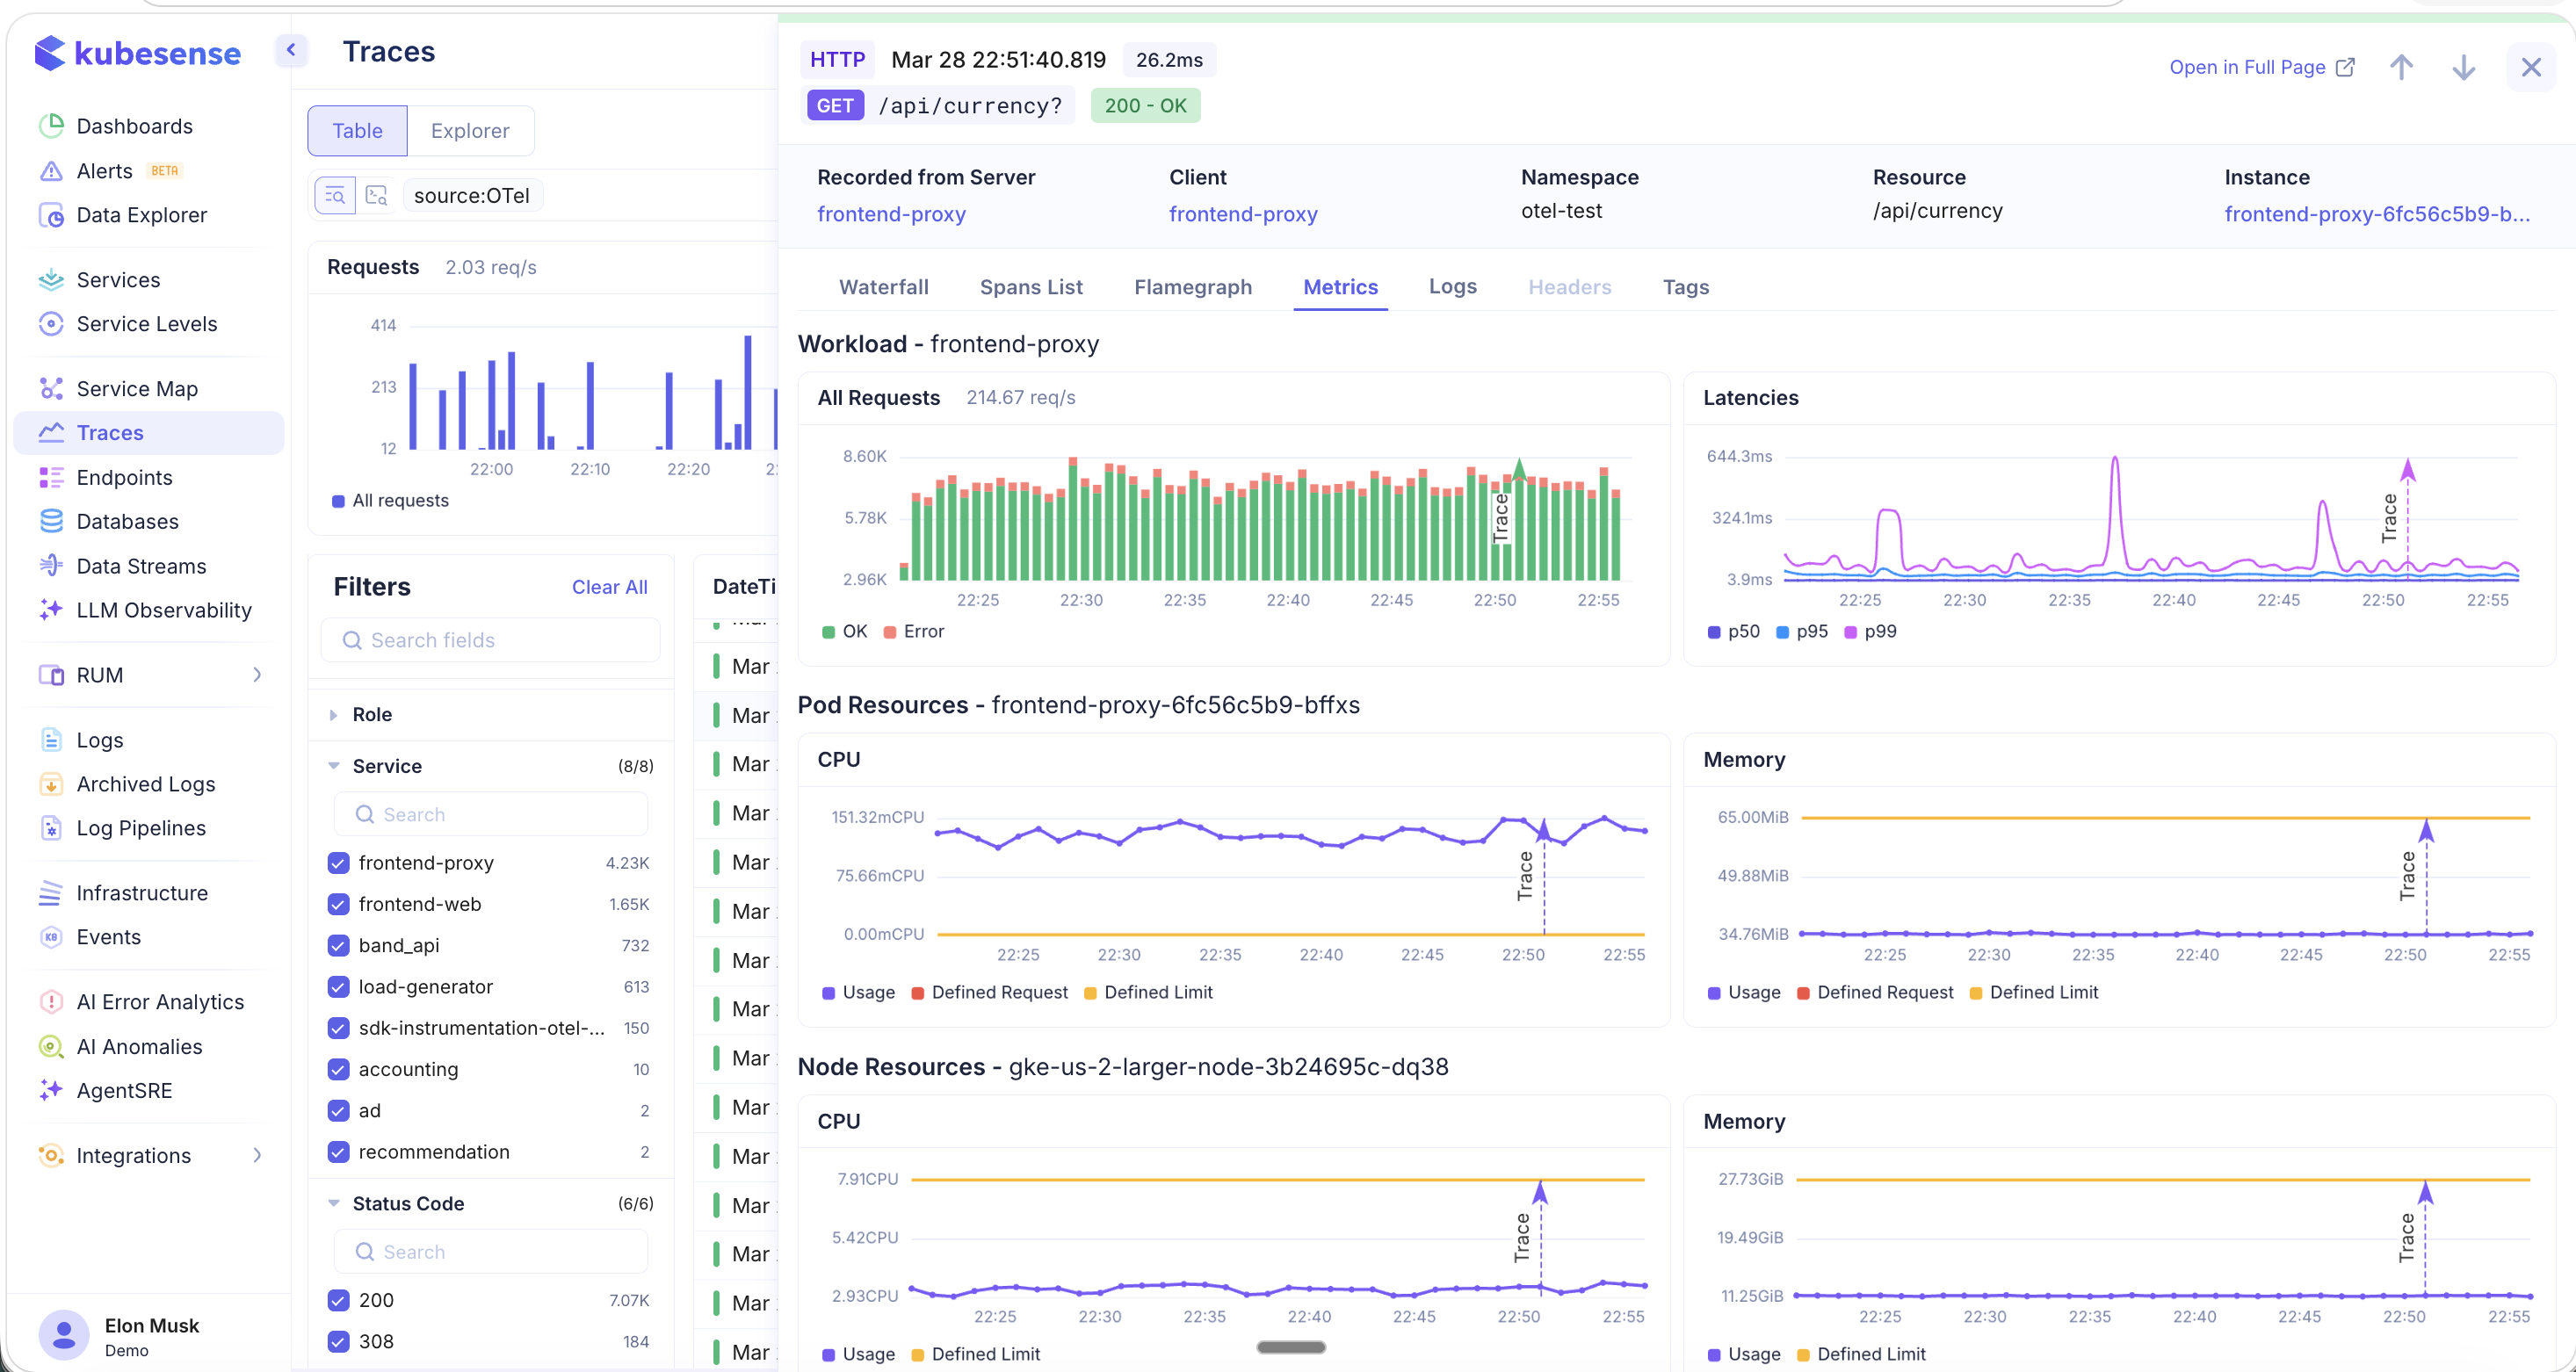
- Workload metrics — All Requests (OK vs. Error bar chart) and Latencies (P50, P95, P99) for the workload. A vertical arrow marks the trace's timestamp on each chart.
- Pod Resources — CPU and memory usage for the specific pod, with Defined Request and Defined Limit lines
- Node Resources — CPU and memory for the underlying node, useful for detecting noisy neighbor issues
Logs
The Logs tab shows all logs correlated with this trace:
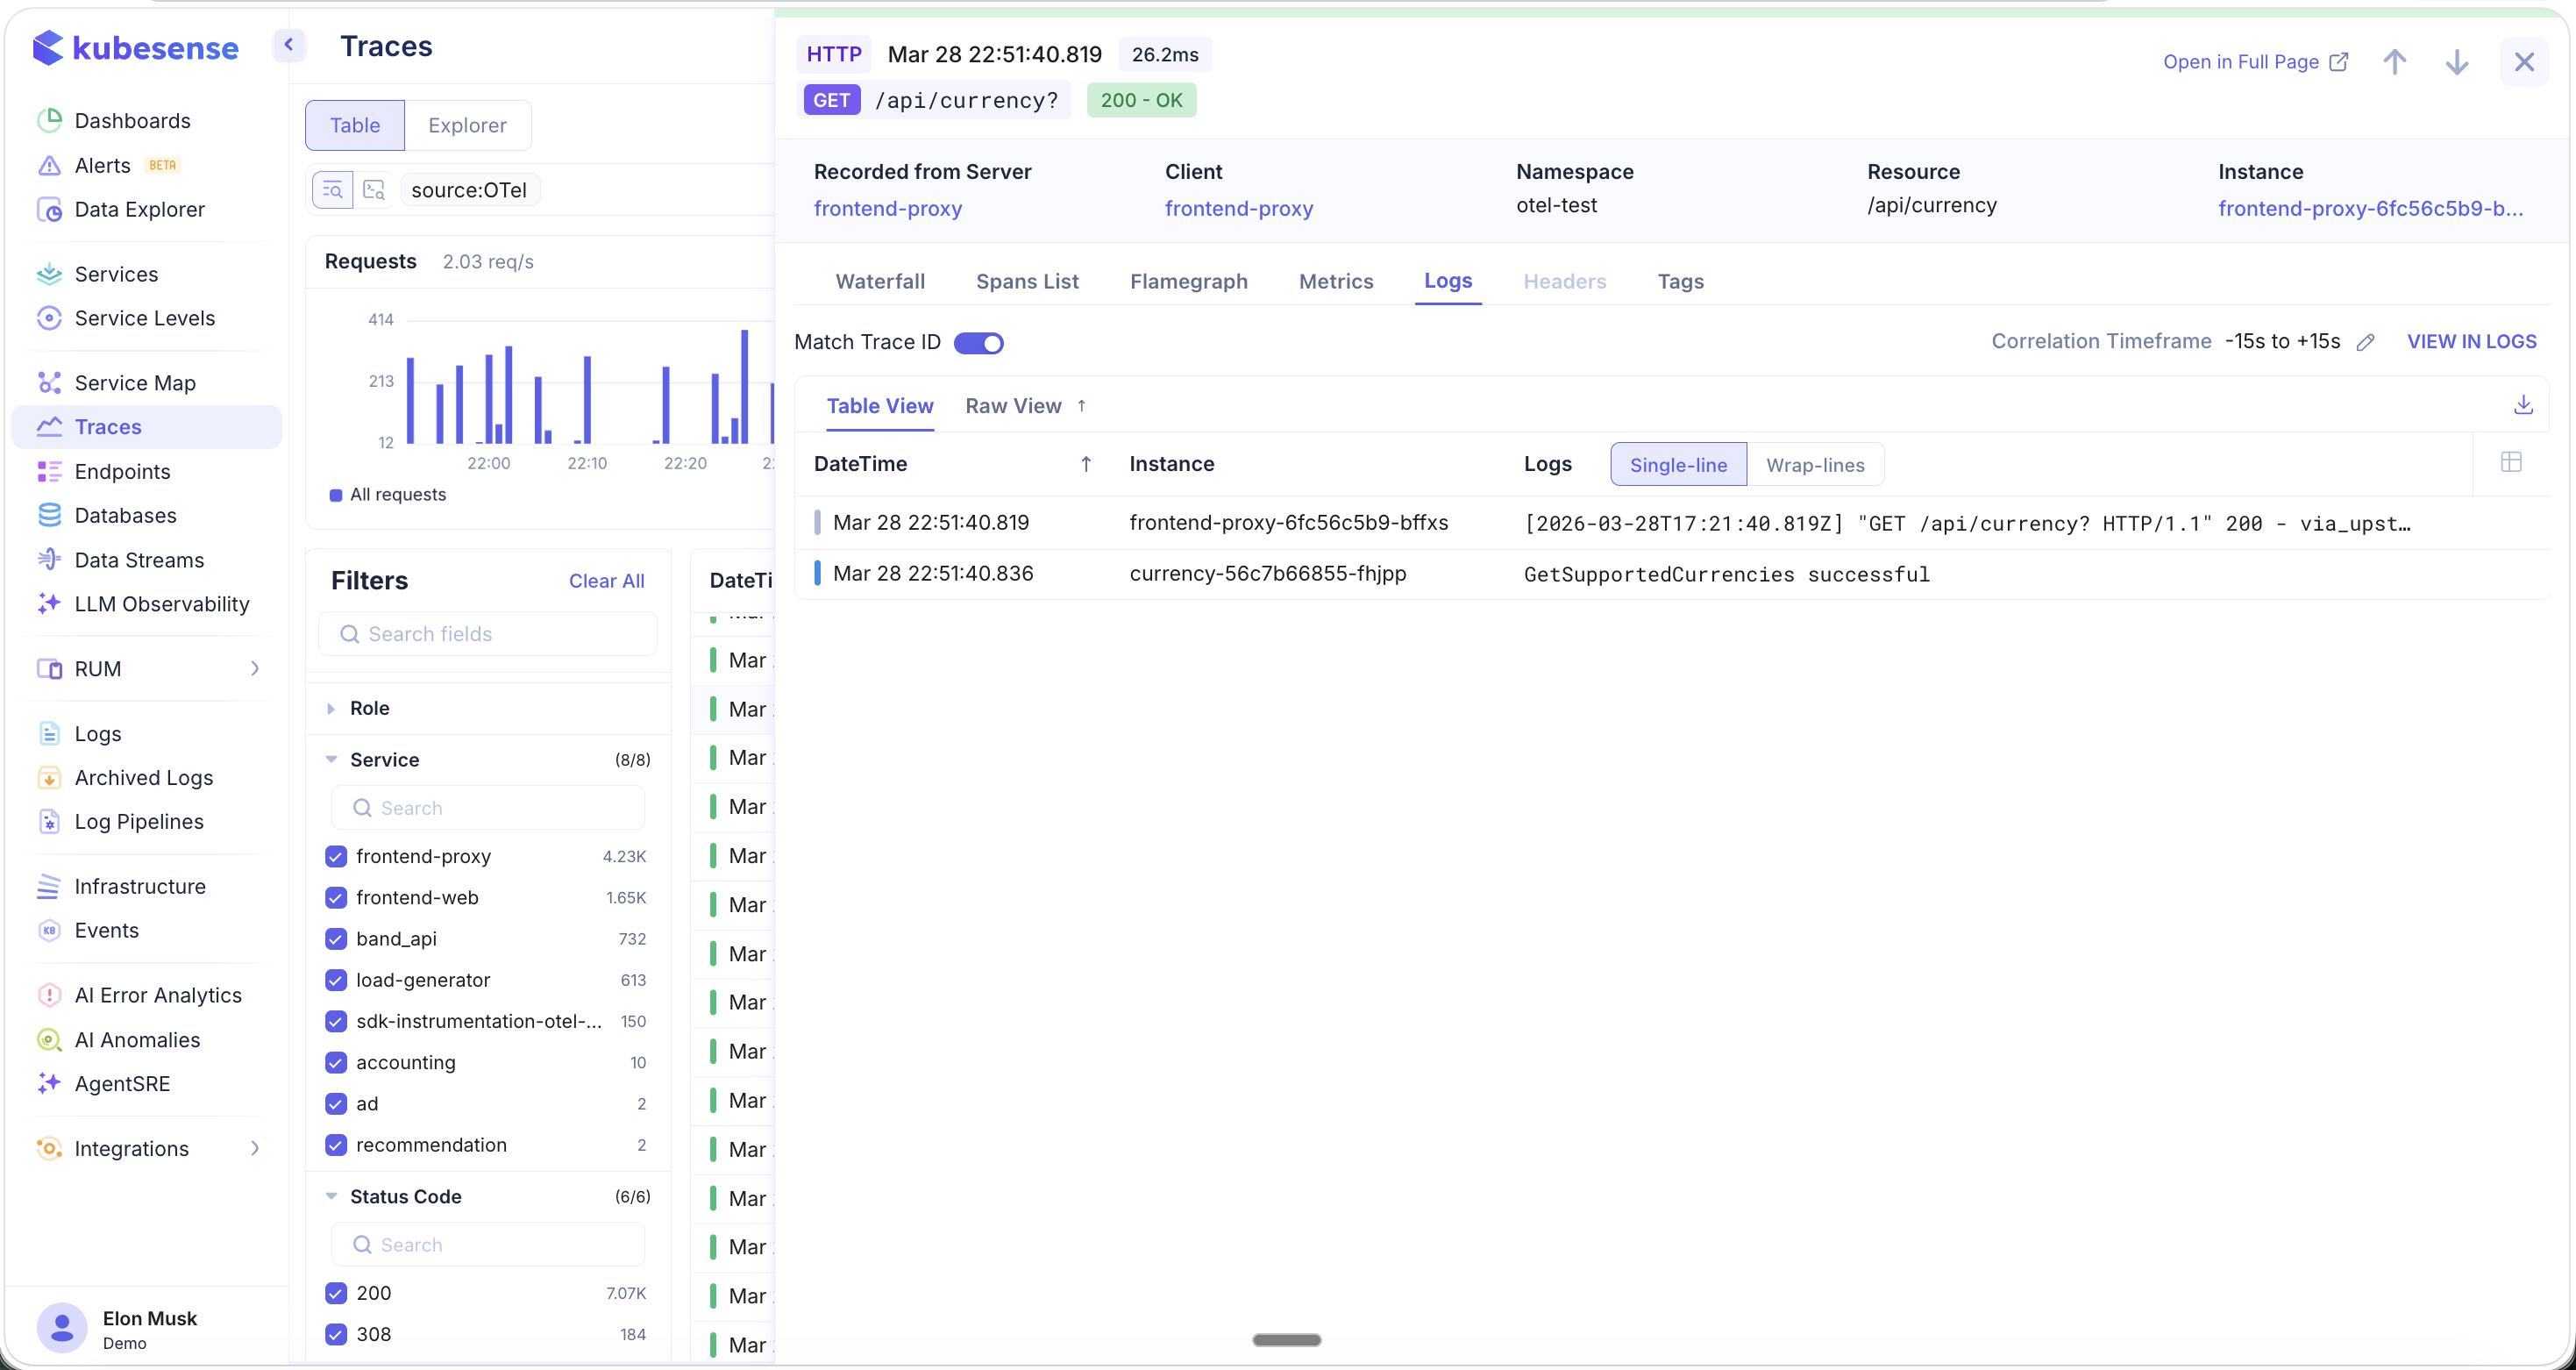
- Match Trace ID toggle — When enabled, logs are correlated by trace ID for precise matching. If the trace ID is being printed in your application logs, this provides exact log-to-trace correlation.
- Correlation Timeframe — Configurable time window around the trace (default: -15s to +15s) for time-based correlation
- Table View / Raw View — Toggle between structured table and raw log output
- Single-line / Wrap-lines — Control log display density
- VIEW IN LOGS — Open the full Log Explorer with the same correlation filters applied
Tags
The Tags tab displays all attributes and metadata extracted from the trace in a JSON-formatted view:
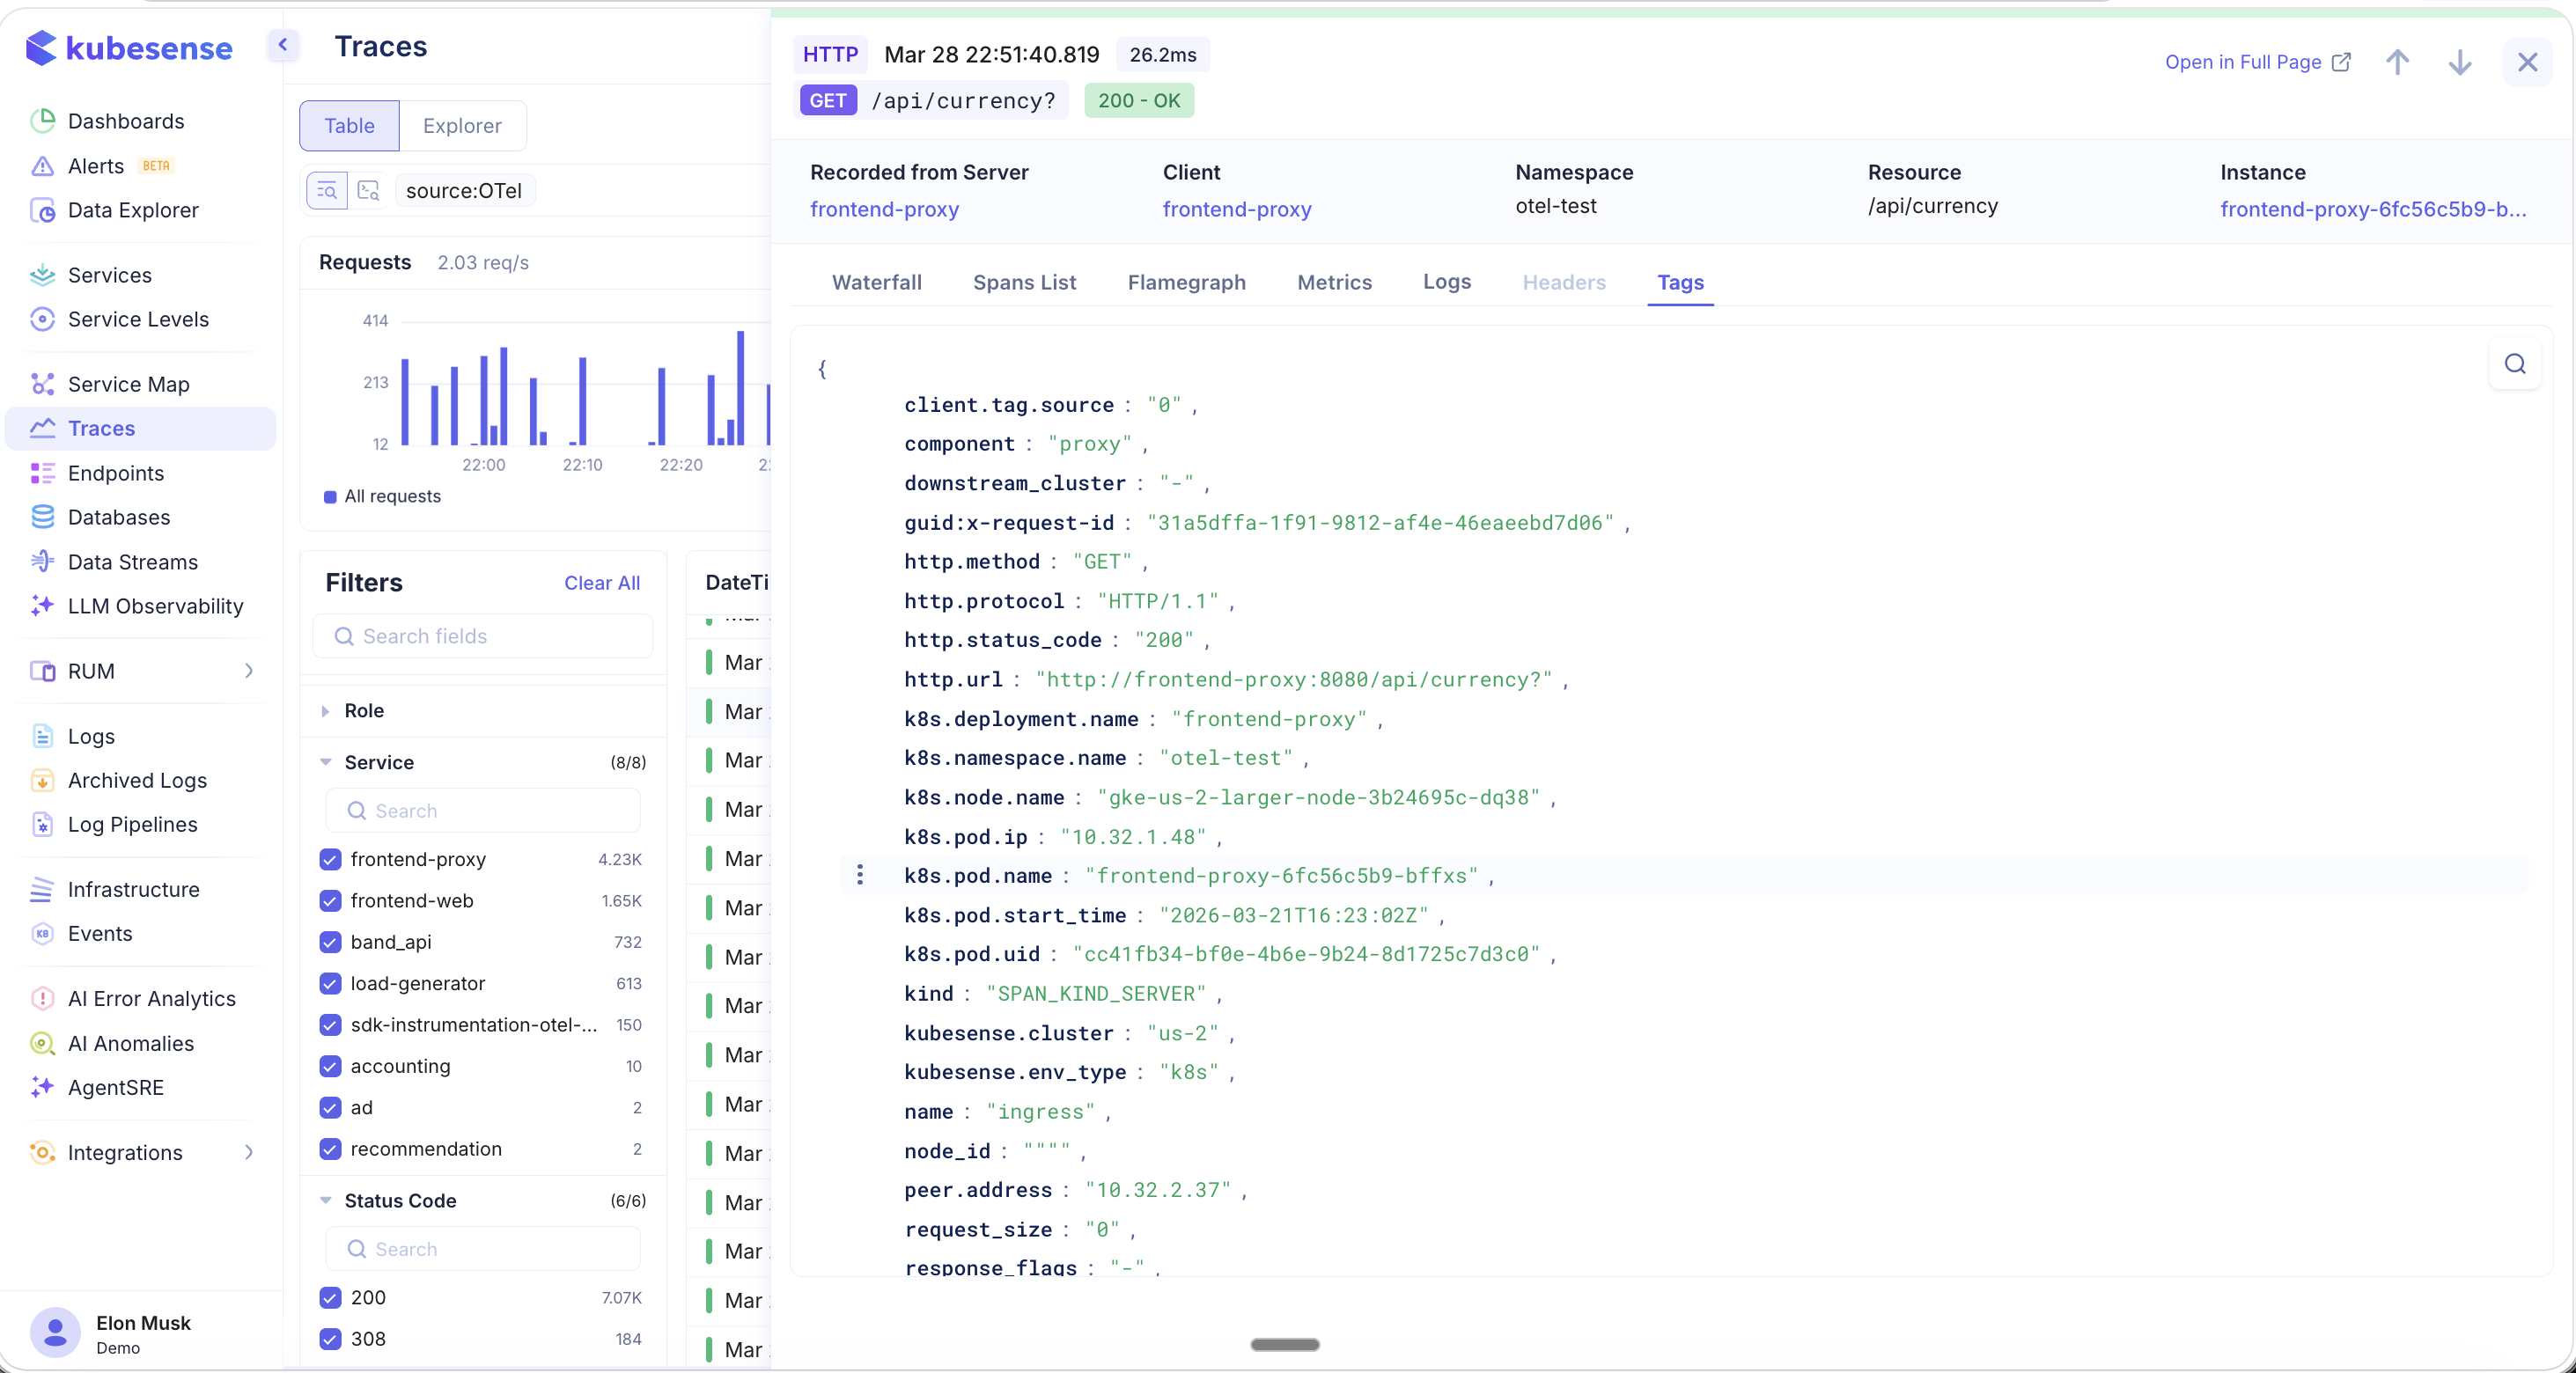
Attributes include HTTP details (http.method, http.protocol, http.status_code, http.url), Kubernetes metadata (k8s.deployment.name, k8s.namespace.name, k8s.node.name, k8s.pod.ip, k8s.pod.name), KubeSense metadata (kubesense.cluster, kubesense.env_type), and span metadata (kind, peer.address, request_size, response_flags).
Use the search icon to filter tags by key name.
Smart Filters
Right-click on any trace attribute in the header (such as Resource, Namespace, or Client) to access smart filter options:
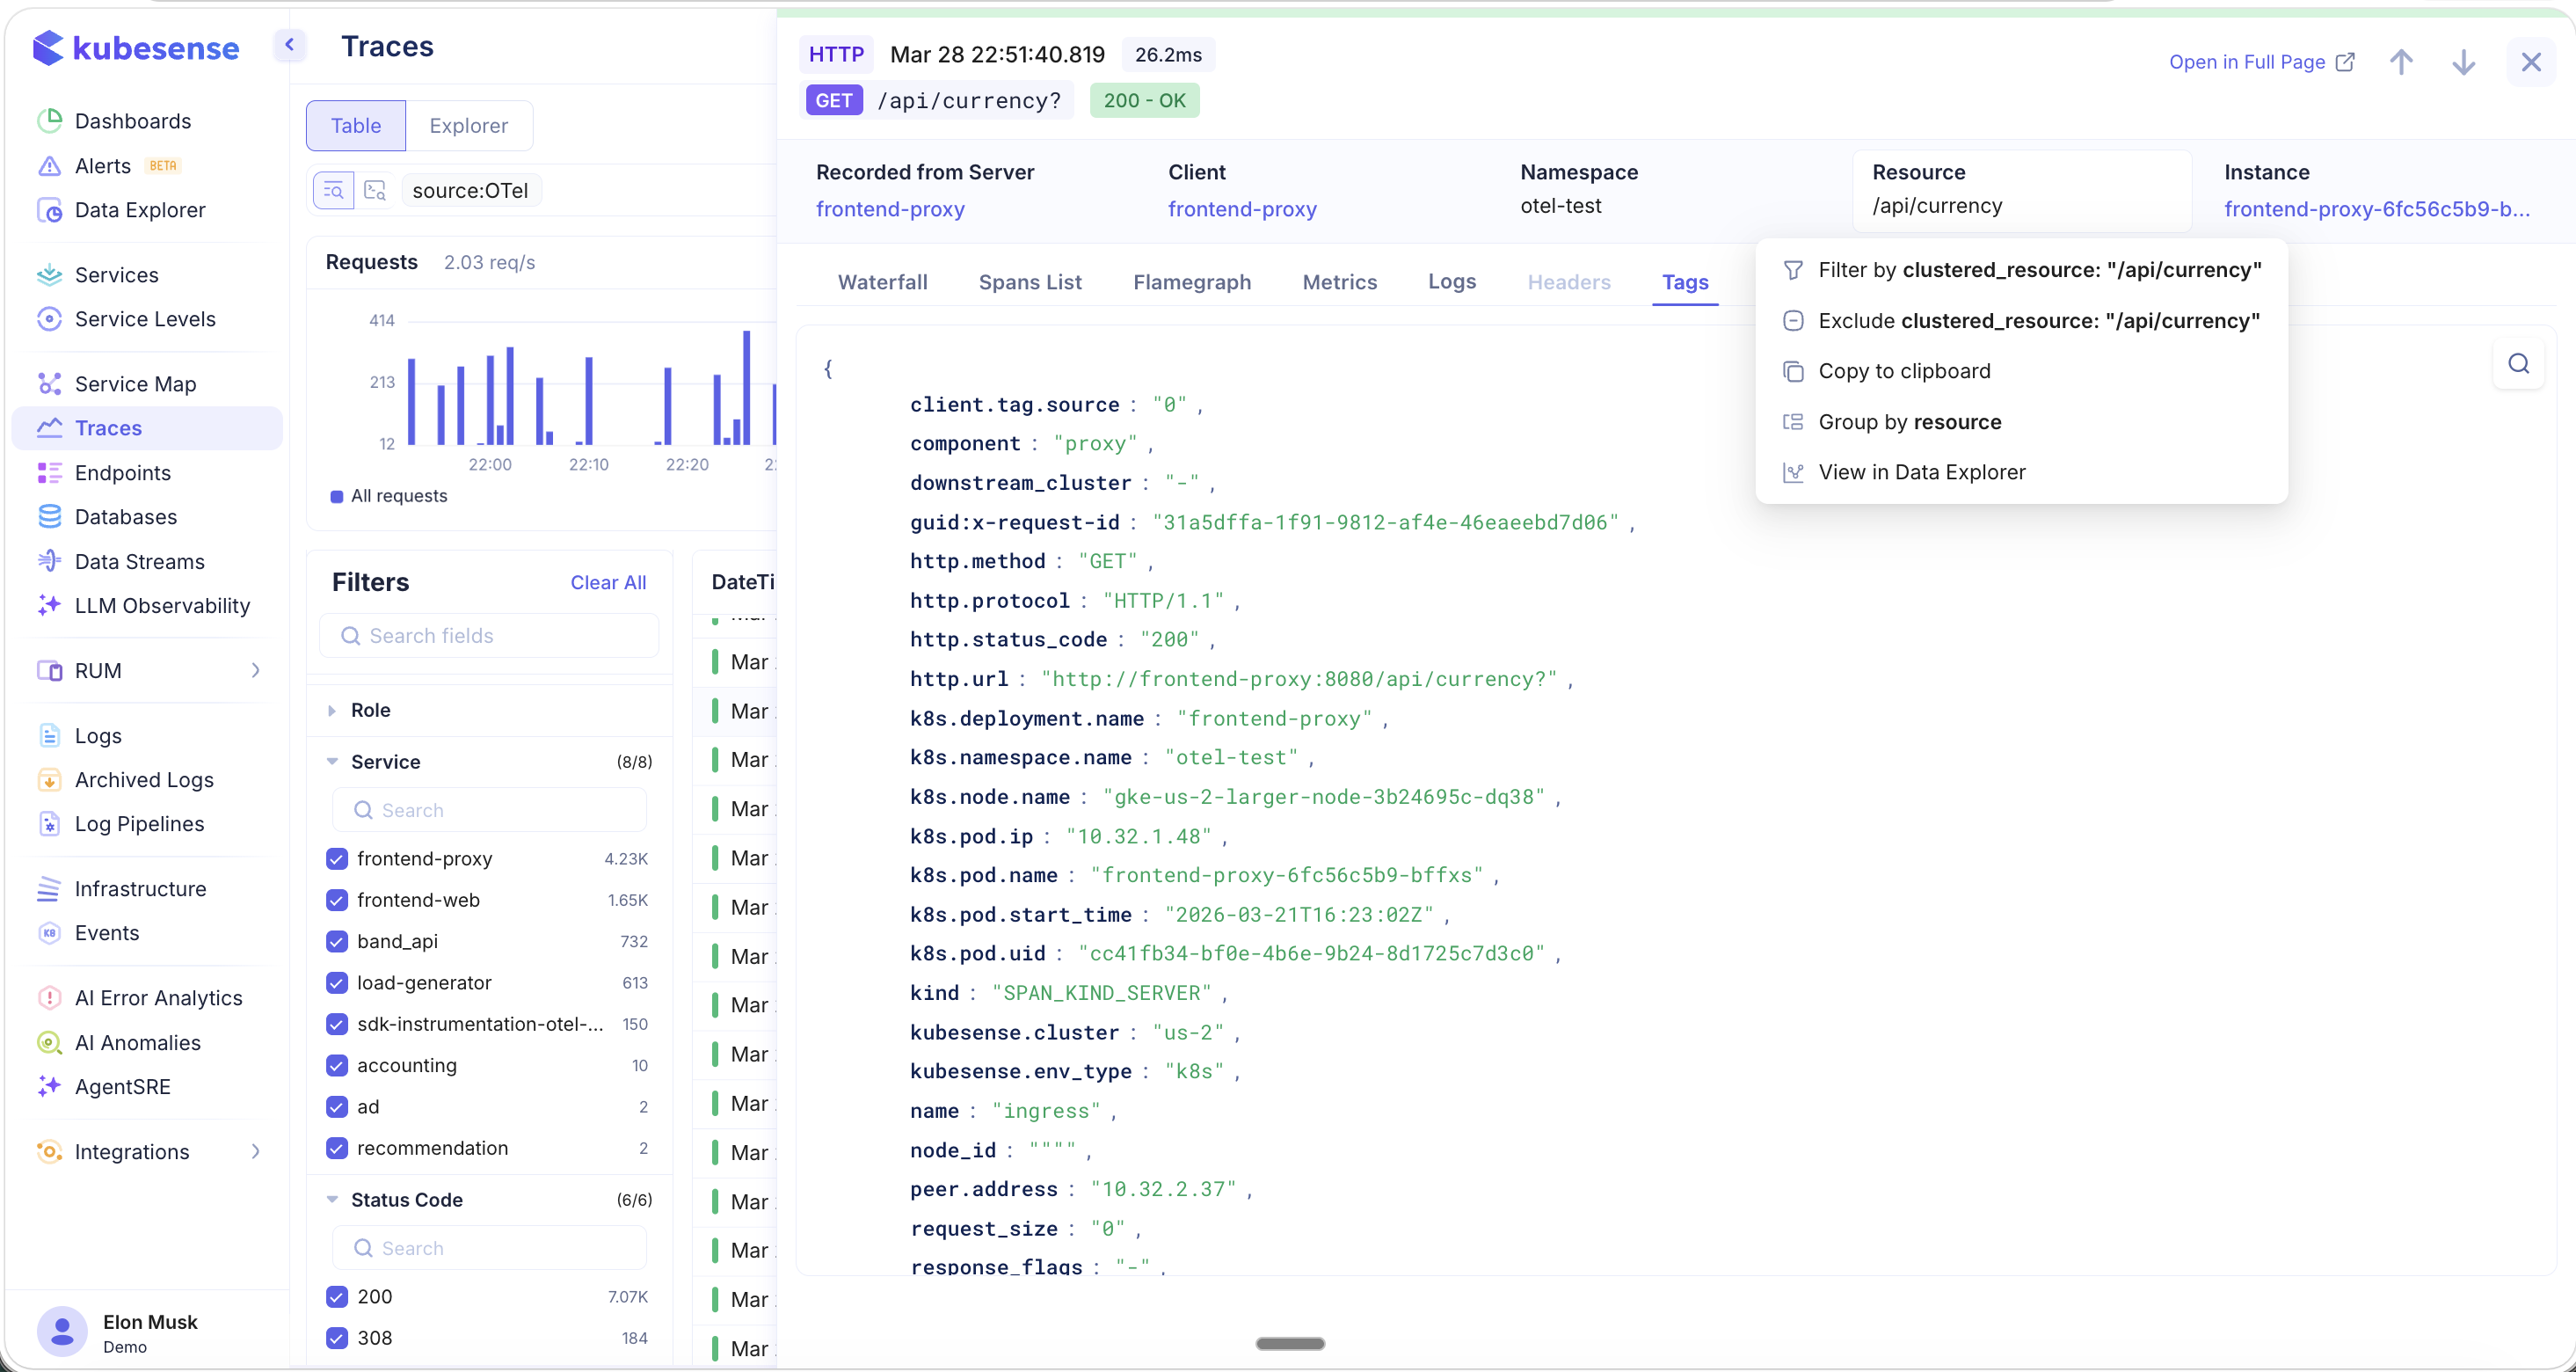
- Filter by — Add this value as a filter to the trace list
- Exclude — Exclude traces with this value
- Copy to clipboard — Copy the value
- Group by — Group traces by this attribute
- View in Data Explorer — Open Data Explorer with this attribute as the focus
Trace Explorer
Switch to the Explorer tab at the top of the page to build visual analytics and dashboards from your trace data.
Time Series
Build time-series charts from trace data with configurable aggregations, grouping, sorting, and limits:
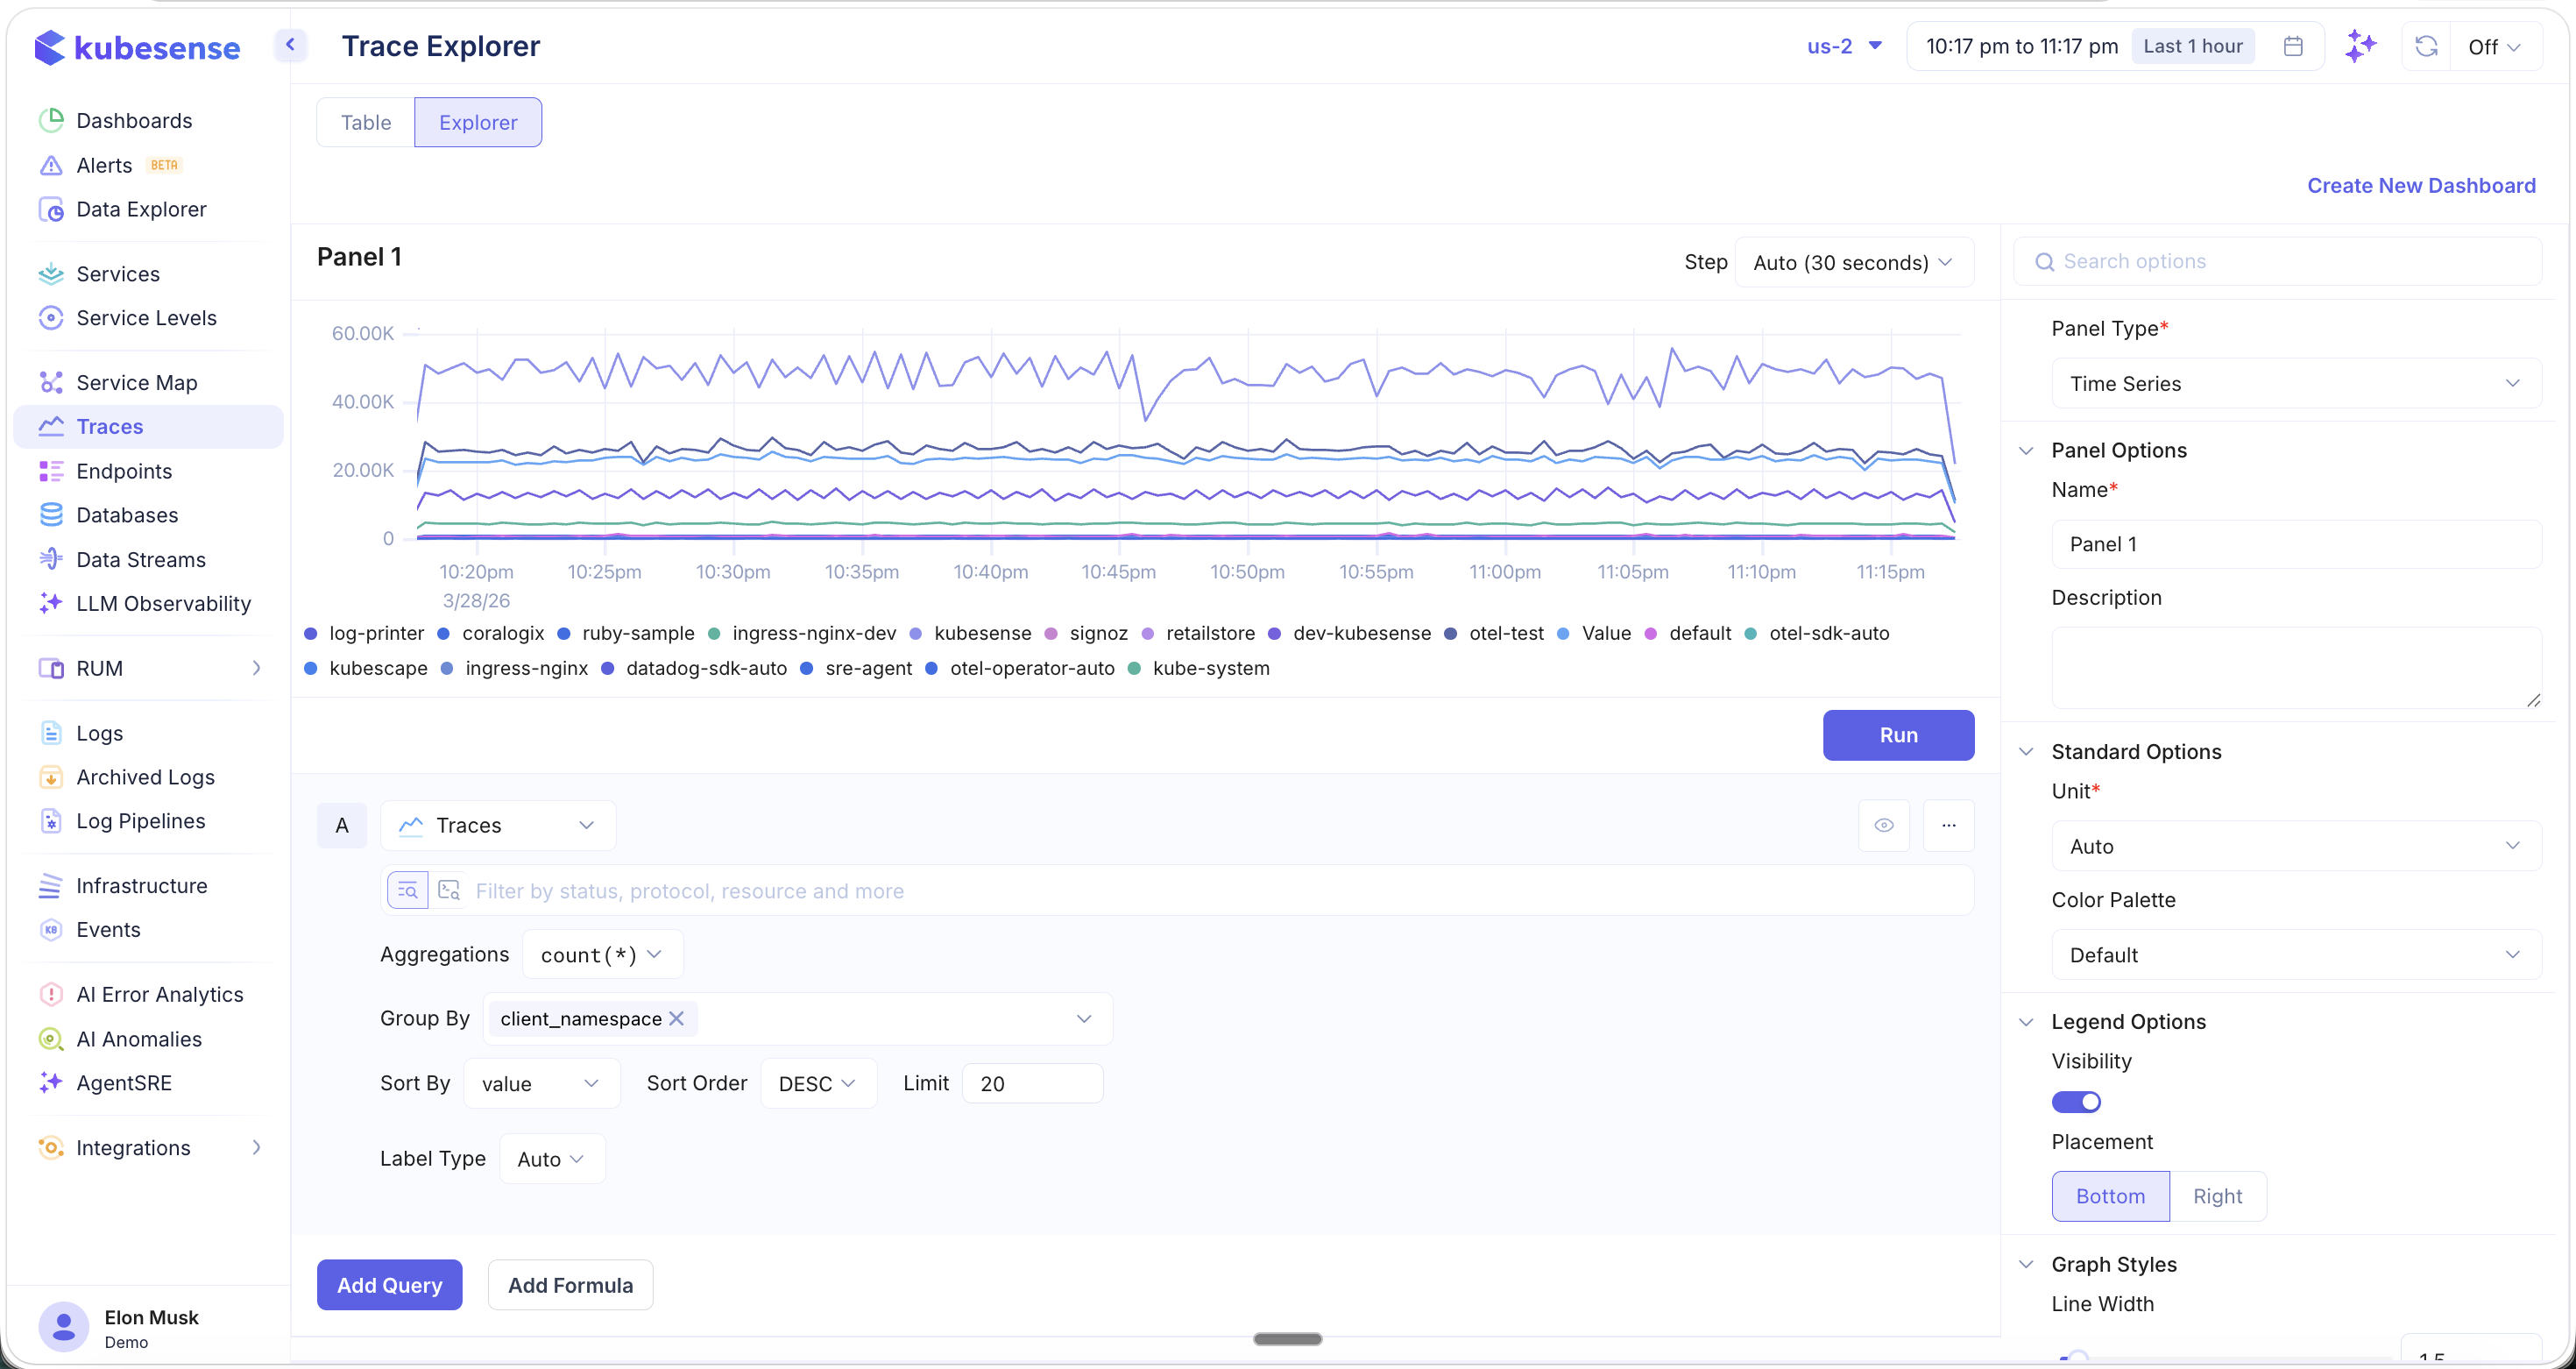
- Aggregations — Choose from count, avg, sum, min, max, p50, p95, p99, and more
- Group By — Group by any trace attribute (e.g.,
client_namespace) - Sort By / Sort Order — Control the ordering of results
- Panel Type — Time Series, Top List, Table, and more
- Panel Options — Name, description, unit, color palette, legend placement, graph styles
Click "Create New Dashboard" to save your explorer panels as a reusable dashboard.
Top List
Switch the Panel Type to Top List for ranked bar charts:
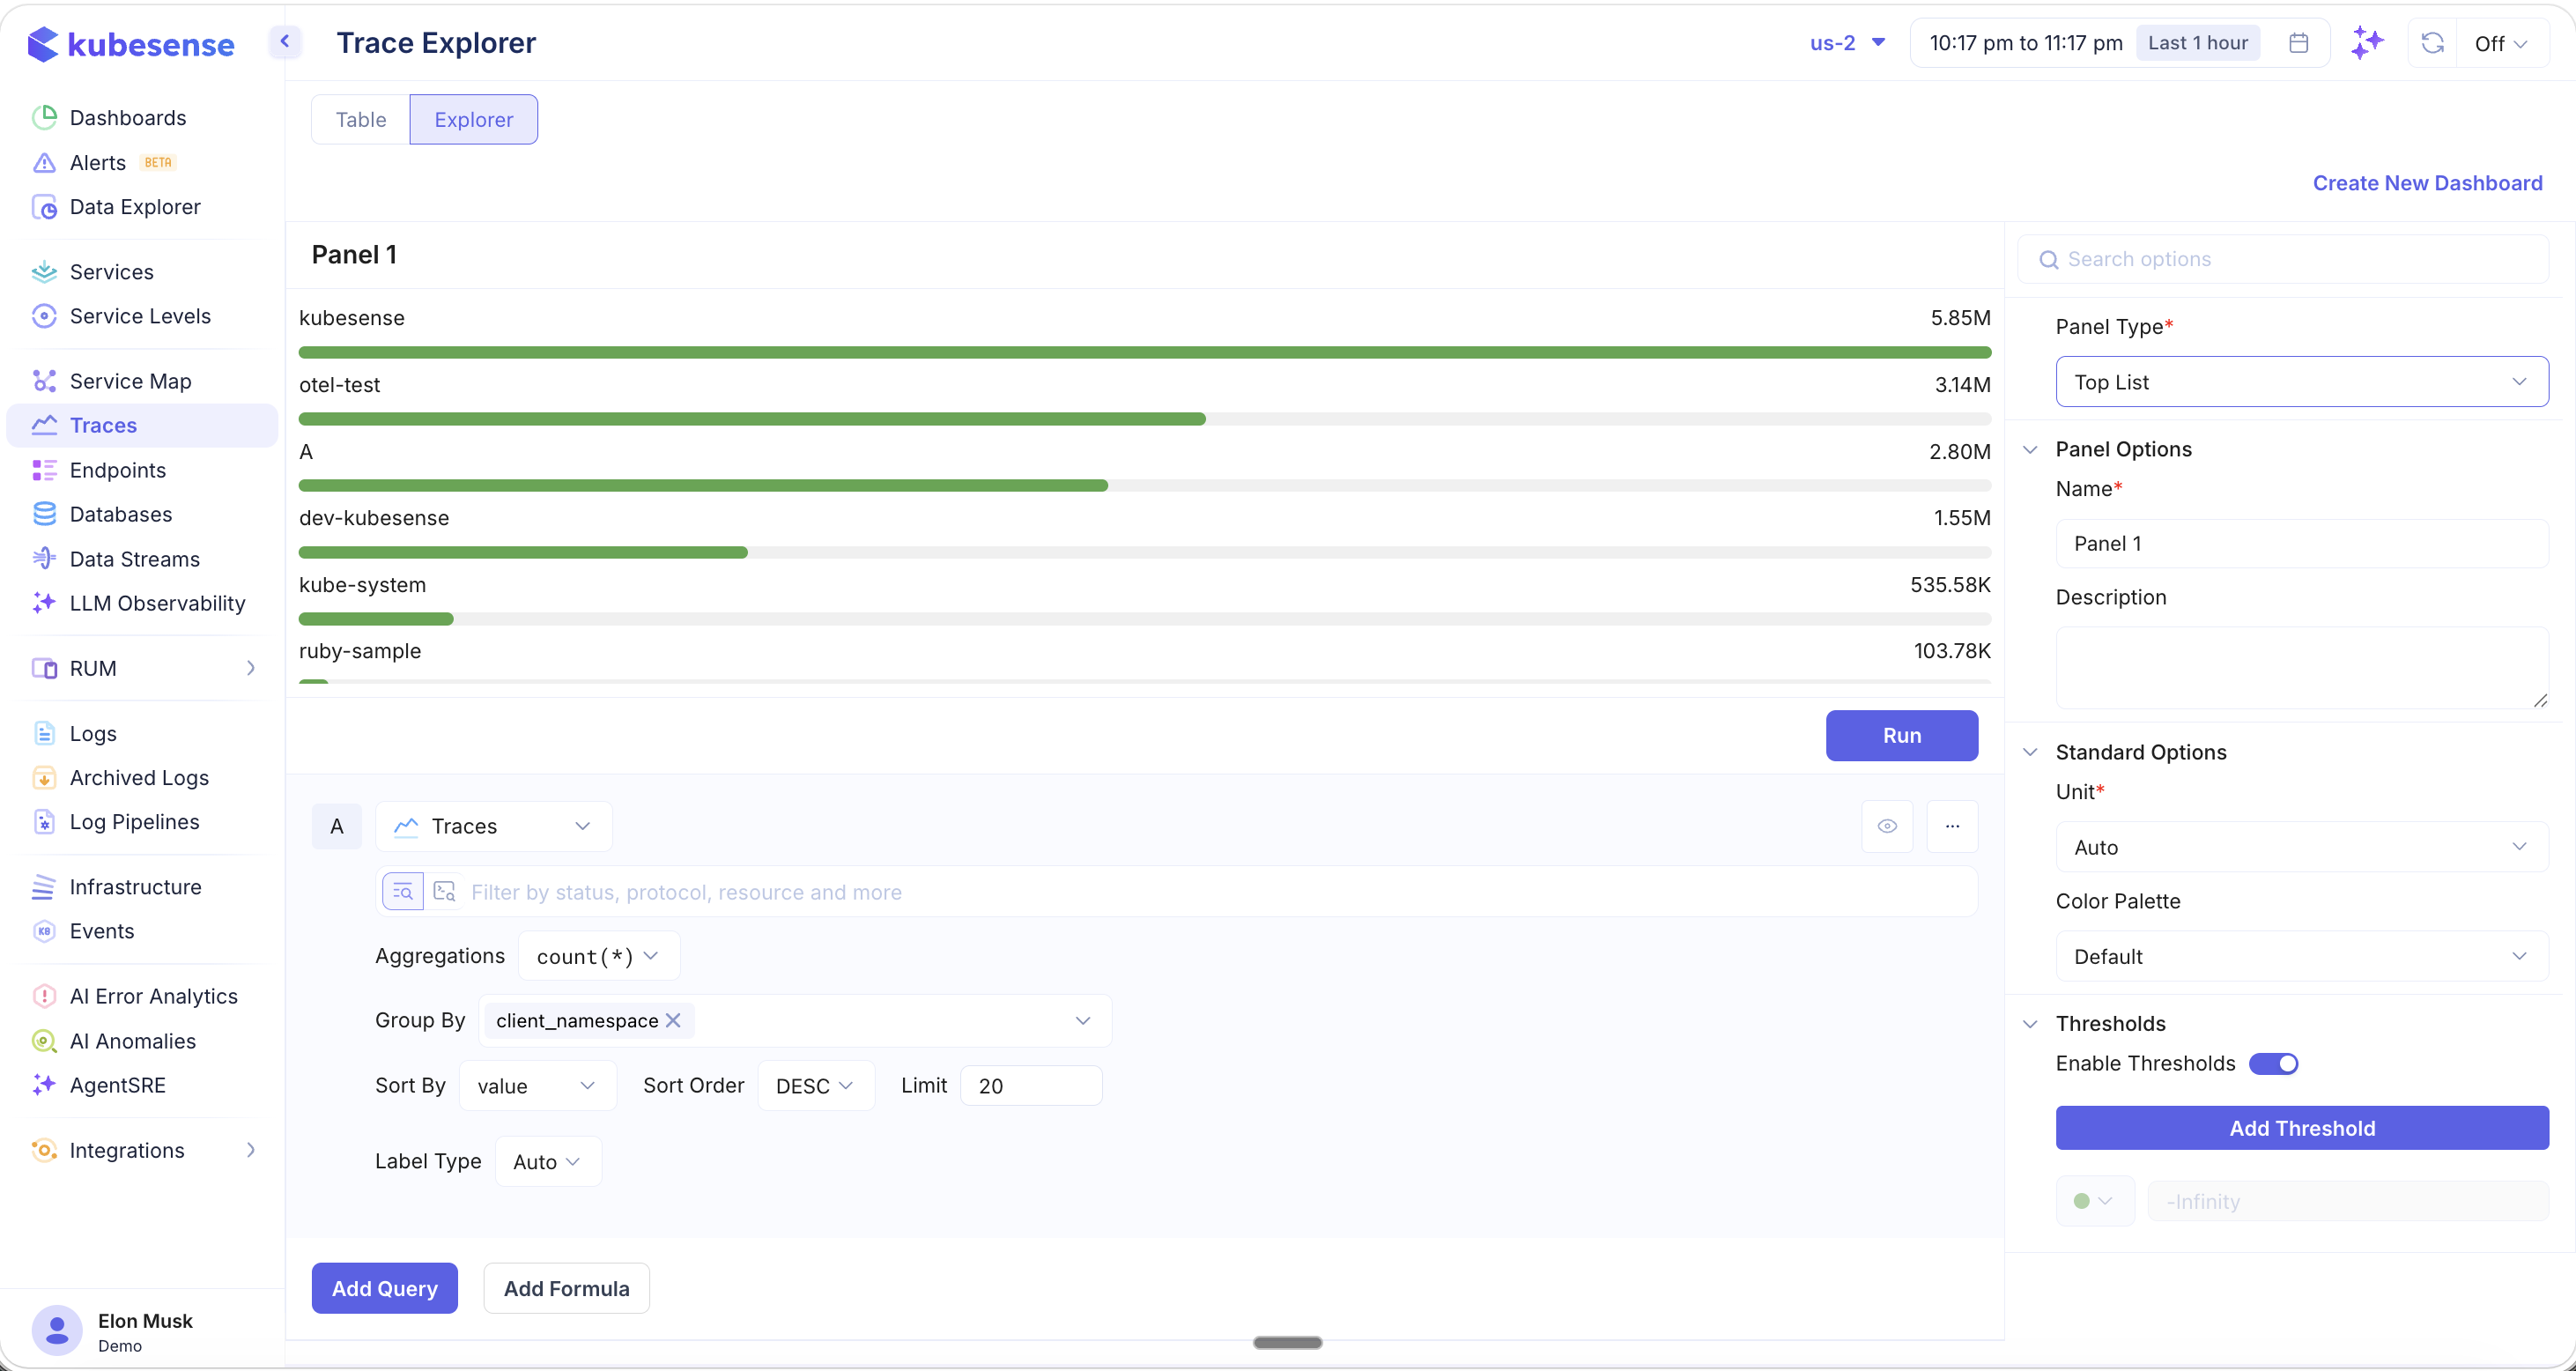
This view shows ranked results (e.g., top namespaces by trace count) with configurable thresholds. Use Add Query to layer multiple data sources, or Add Formula for computed metrics.
Exporting Traces
Click the download icon in the table header to export trace data:
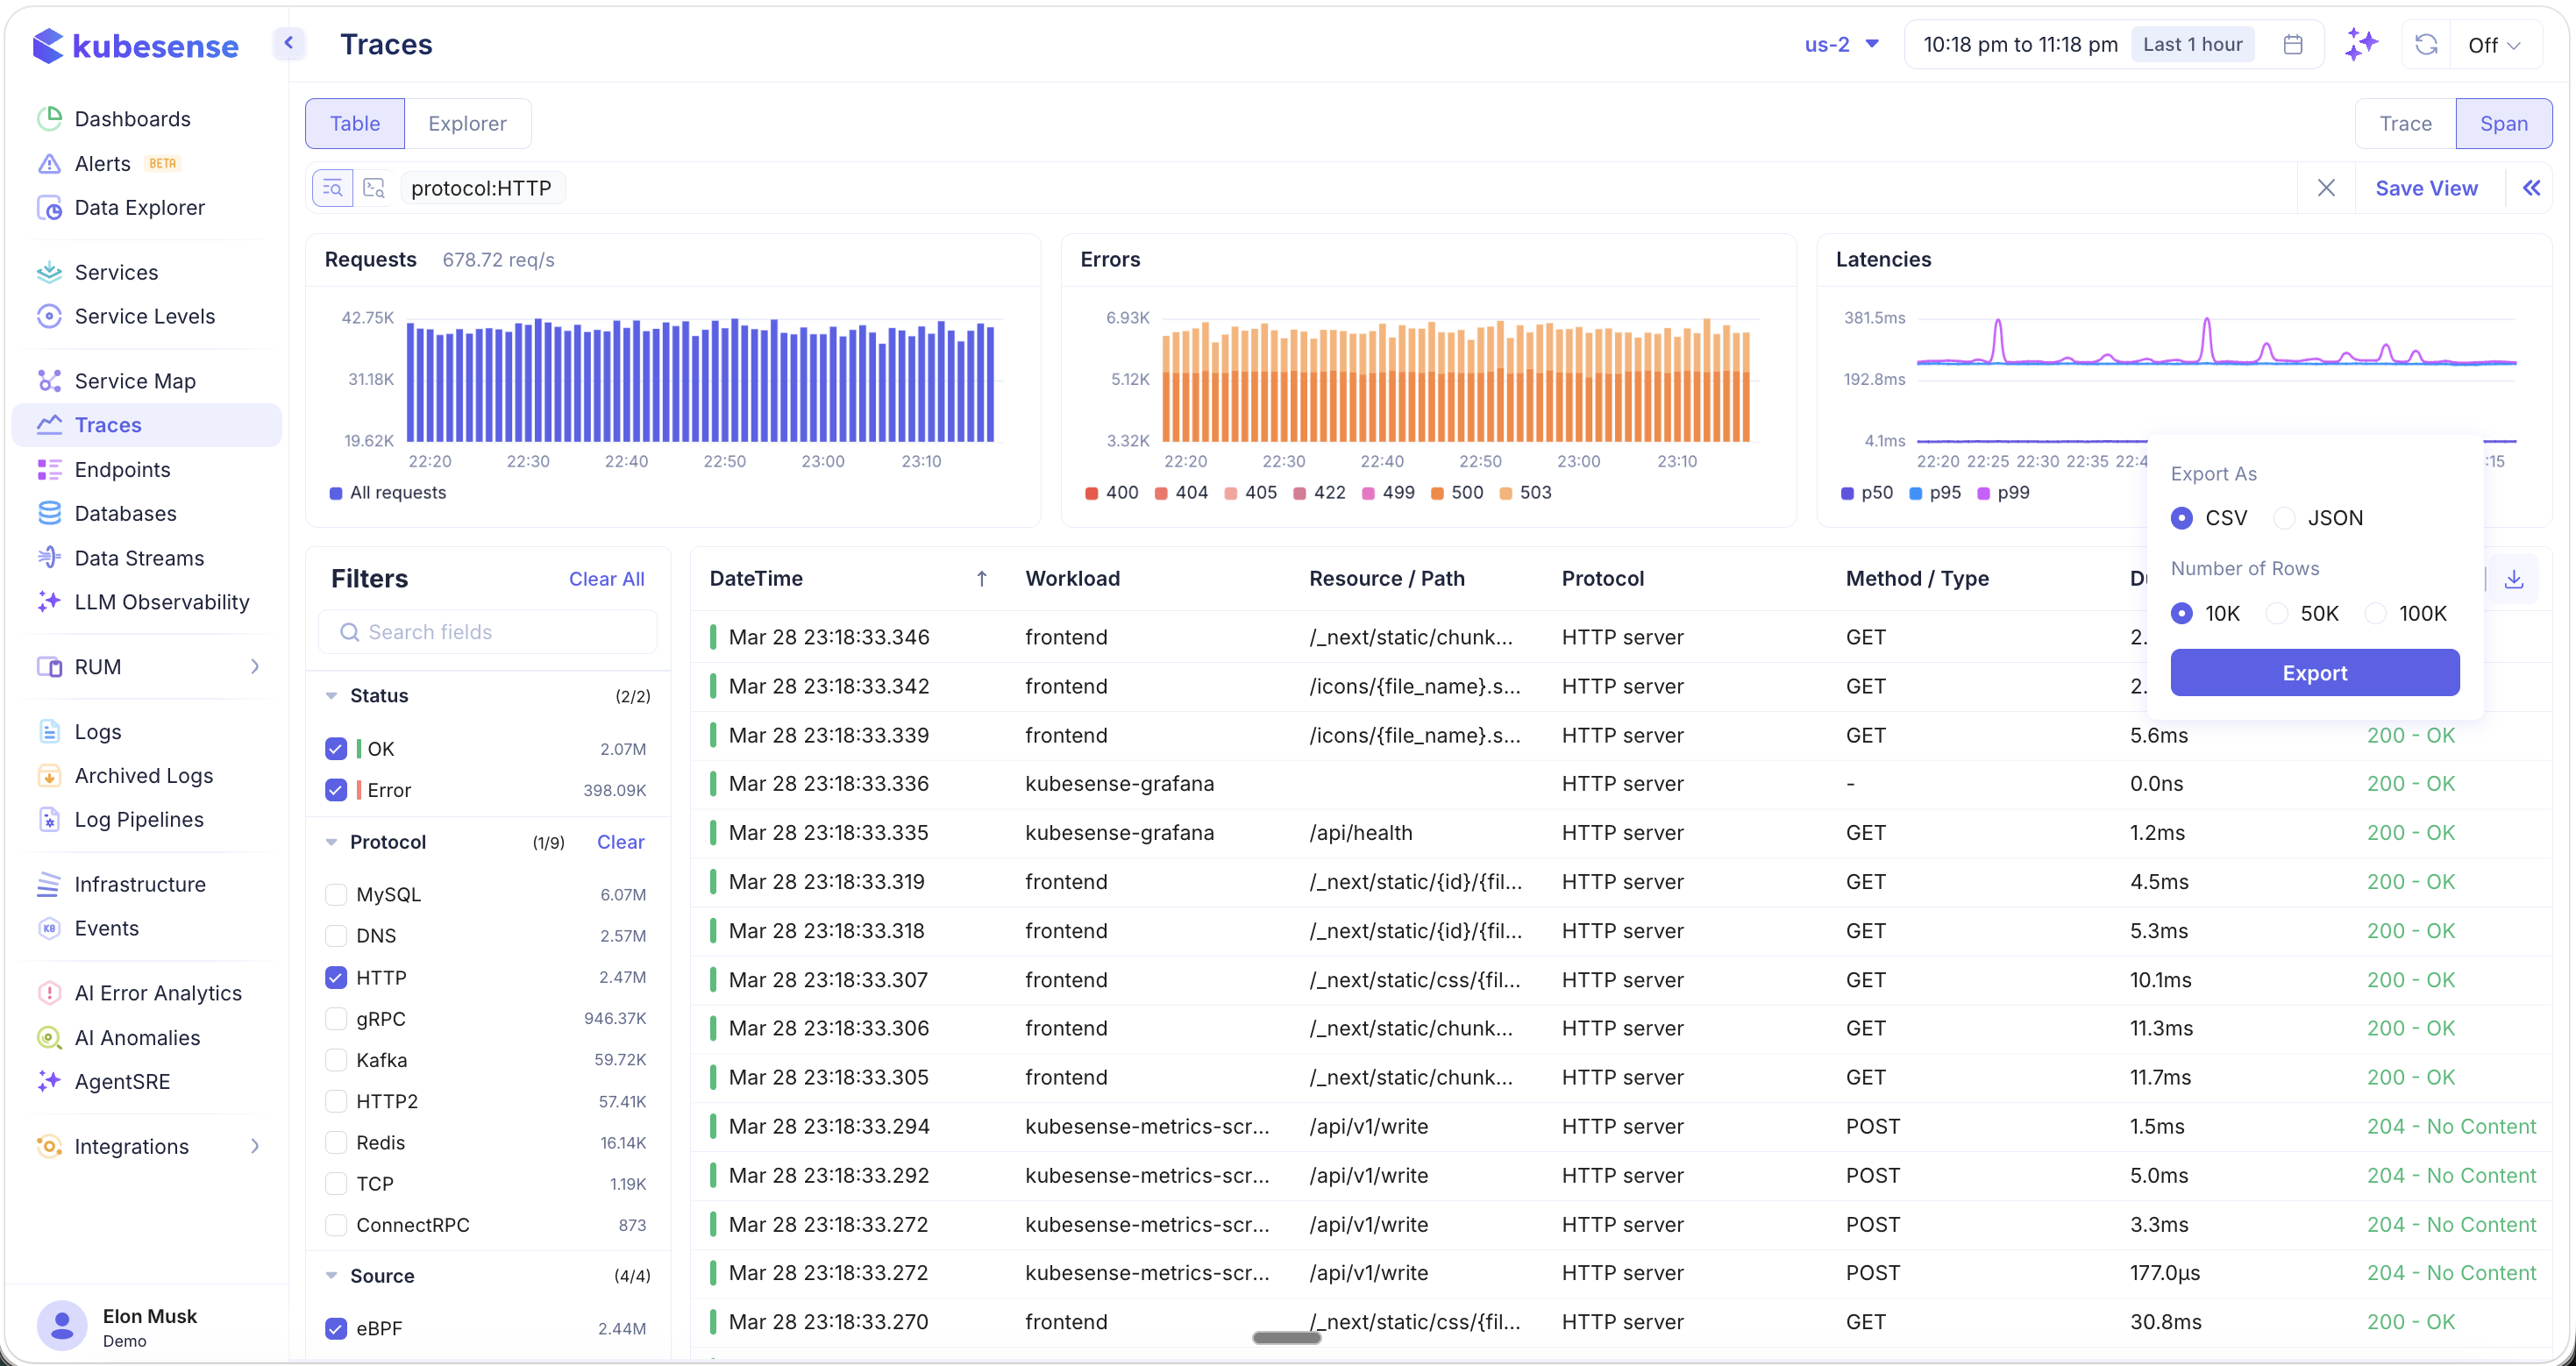
- Format — CSV or JSON
- Number of Rows — 10K, 50K, or 100K rows
Exported data respects your current filters and search query, making it useful for offline analysis, compliance, or sharing with team members.