Database Monitoring
The Databases page provides unified performance monitoring for all databases detected across your infrastructure — including MySQL, Redis, MongoDB, and PostgreSQL. KubeSense automatically discovers database instances by analyzing network traffic at the kernel level using eBPF, requiring no database agents, plugins, or code changes.
Database List
The database list shows every discovered database instance with real-time performance metrics for quick health assessment.
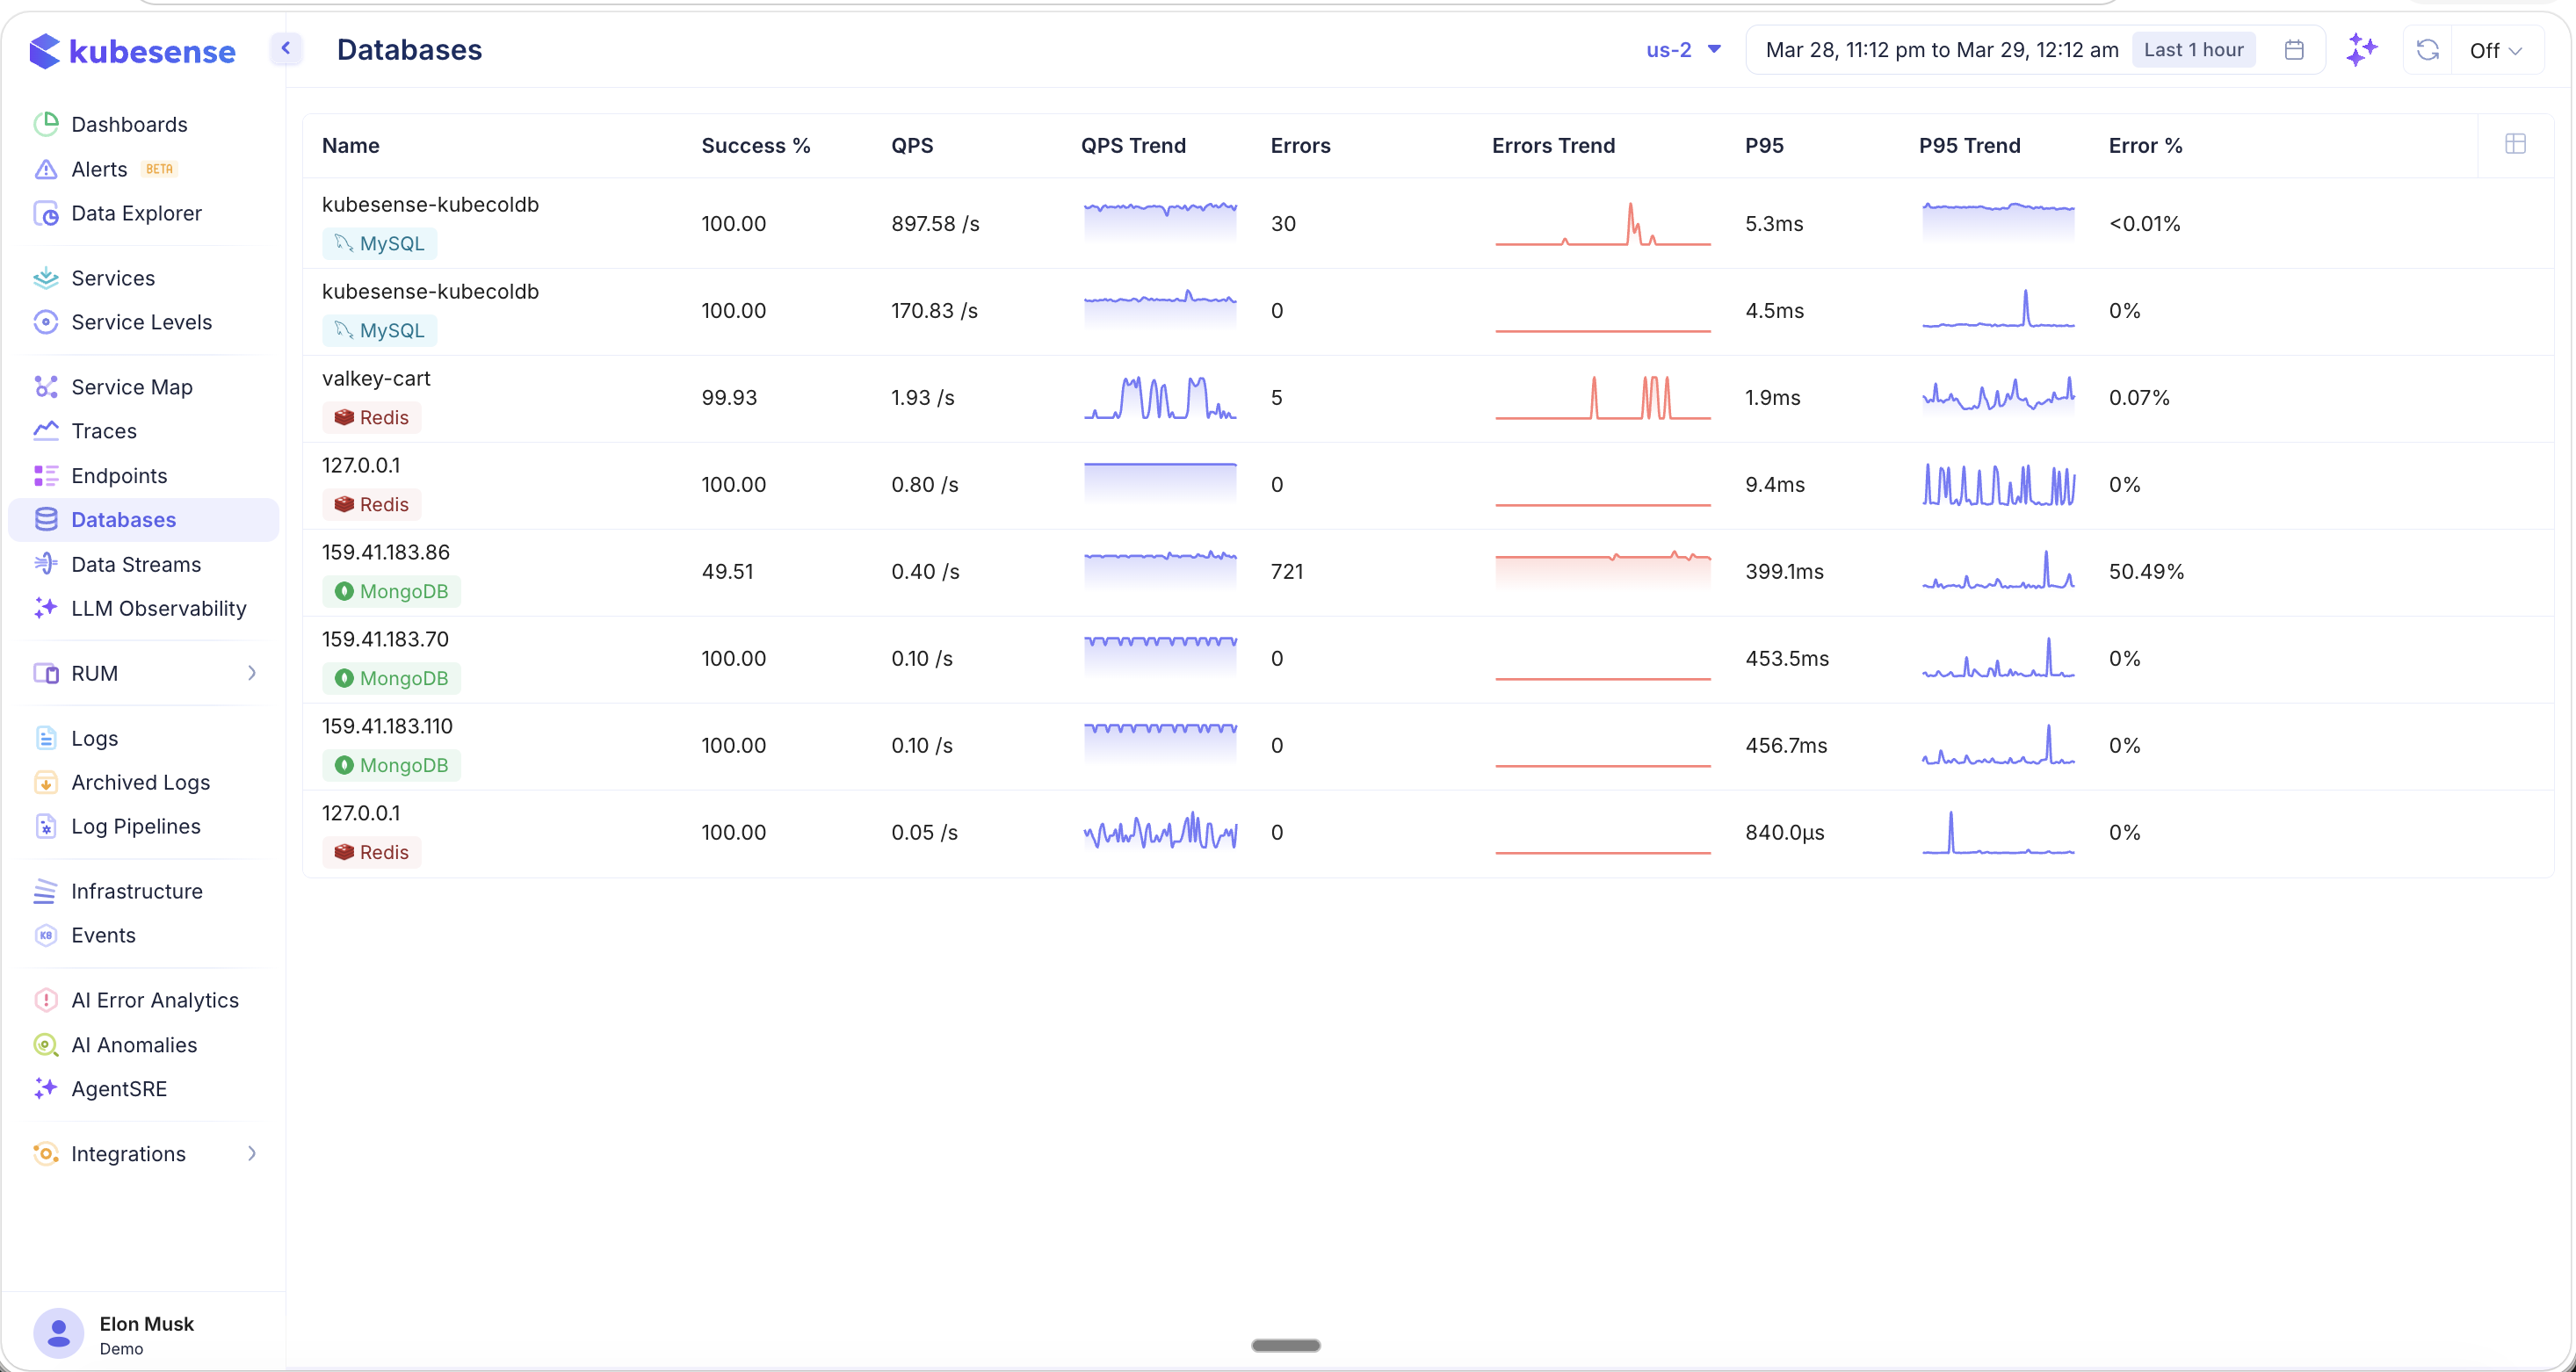
Each database row displays:
| Column | Description |
|---|---|
| Name | Database hostname or IP address |
| Type | Database type badge (MySQL, Redis, MongoDB) |
| Success % | Percentage of successful queries |
| QPS | Queries per second — current throughput |
| QPS Trend | Sparkline showing query rate over the selected time window |
| Errors | Total error count |
| Errors Trend | Sparkline showing error count over time |
| P95 | 95th percentile query latency |
| P95 Trend | Sparkline showing P95 latency over time |
| Error % | Error rate as a percentage of total queries |
All data is scoped to the selected cluster and time period.
Database Detail — Dashboard
Click any database row to open the detail view. The Dashboard tab provides out-of-the-box analytics for the selected database.
MySQL
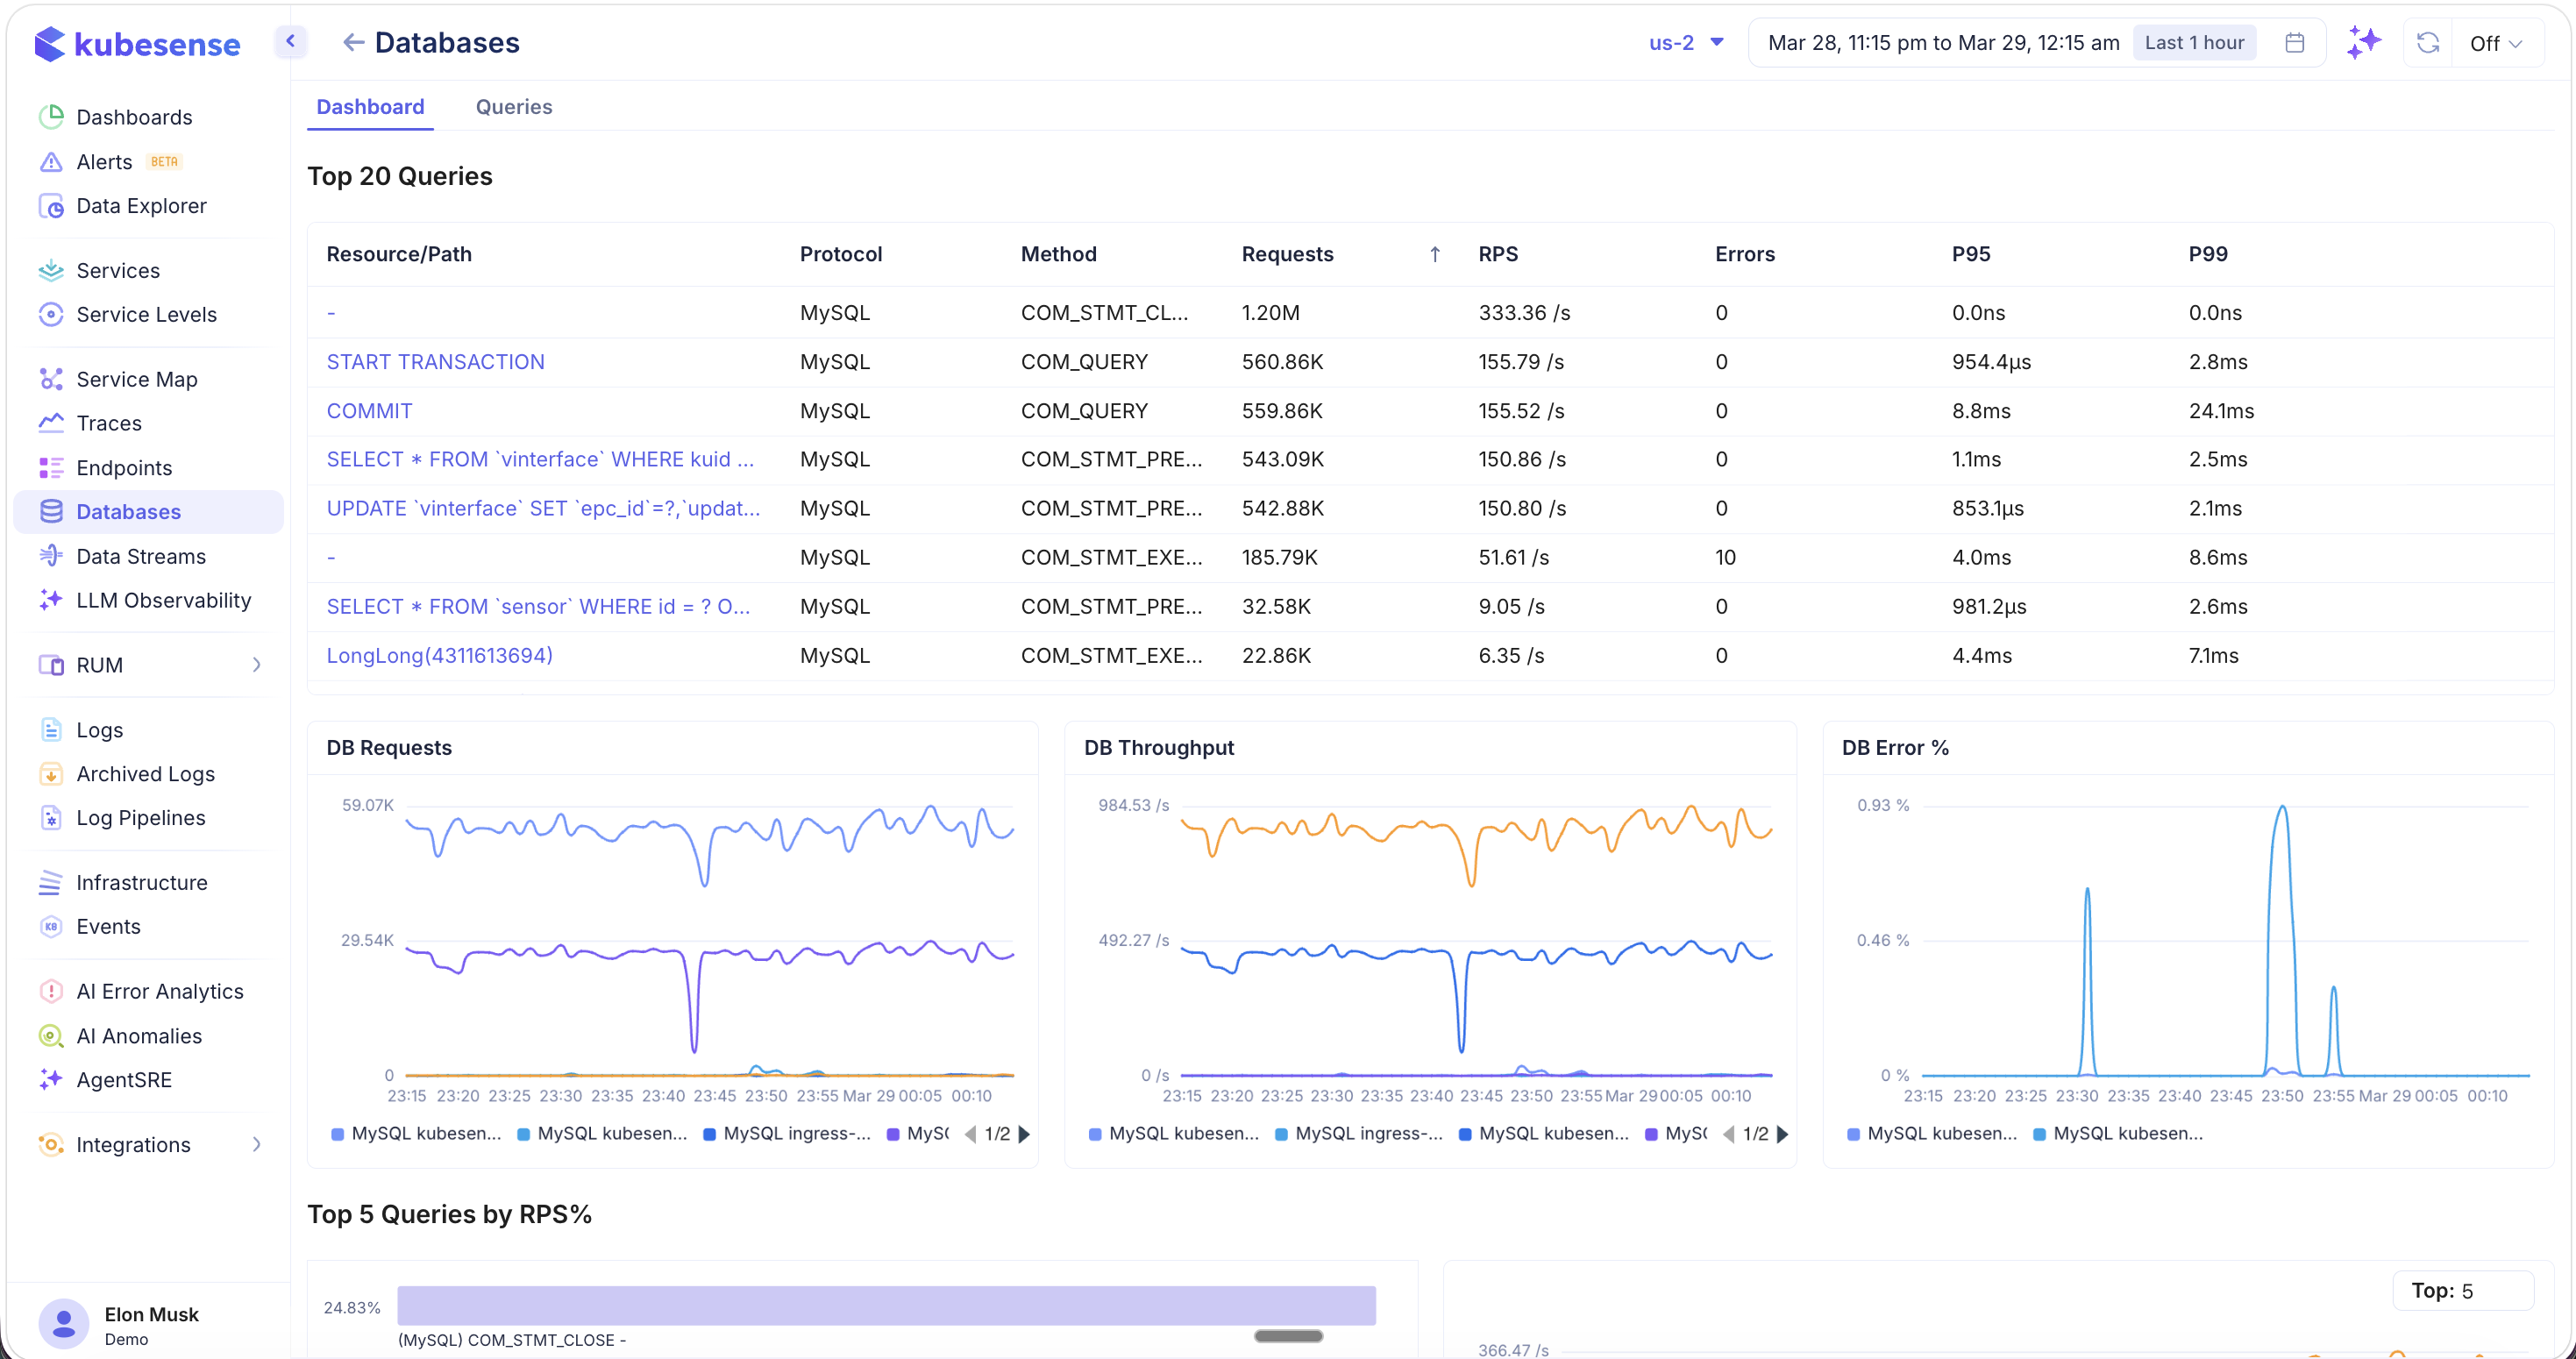
The dashboard includes:
Top 20 Queries — A table listing the most active queries with:
- Resource/Path — The SQL query or operation (e.g.,
START TRANSACTION,COMMIT,SELECT * FROM ...,UPDATE ...) - Protocol — Database protocol (MySQL)
- Method — Operation type (COM_STMT_CLOSE, COM_QUERY, COM_STMT_PREPARE, COM_STMT_EXECUTE)
- Requests — Total query count
- RPS — Queries per second
- Errors — Error count
- P95 / P99 — Latency percentiles
Time-Series Charts:
- DB Requests — Query volume over time
- DB Throughput — Queries per second over time
- DB Error % — Error rate percentage over time
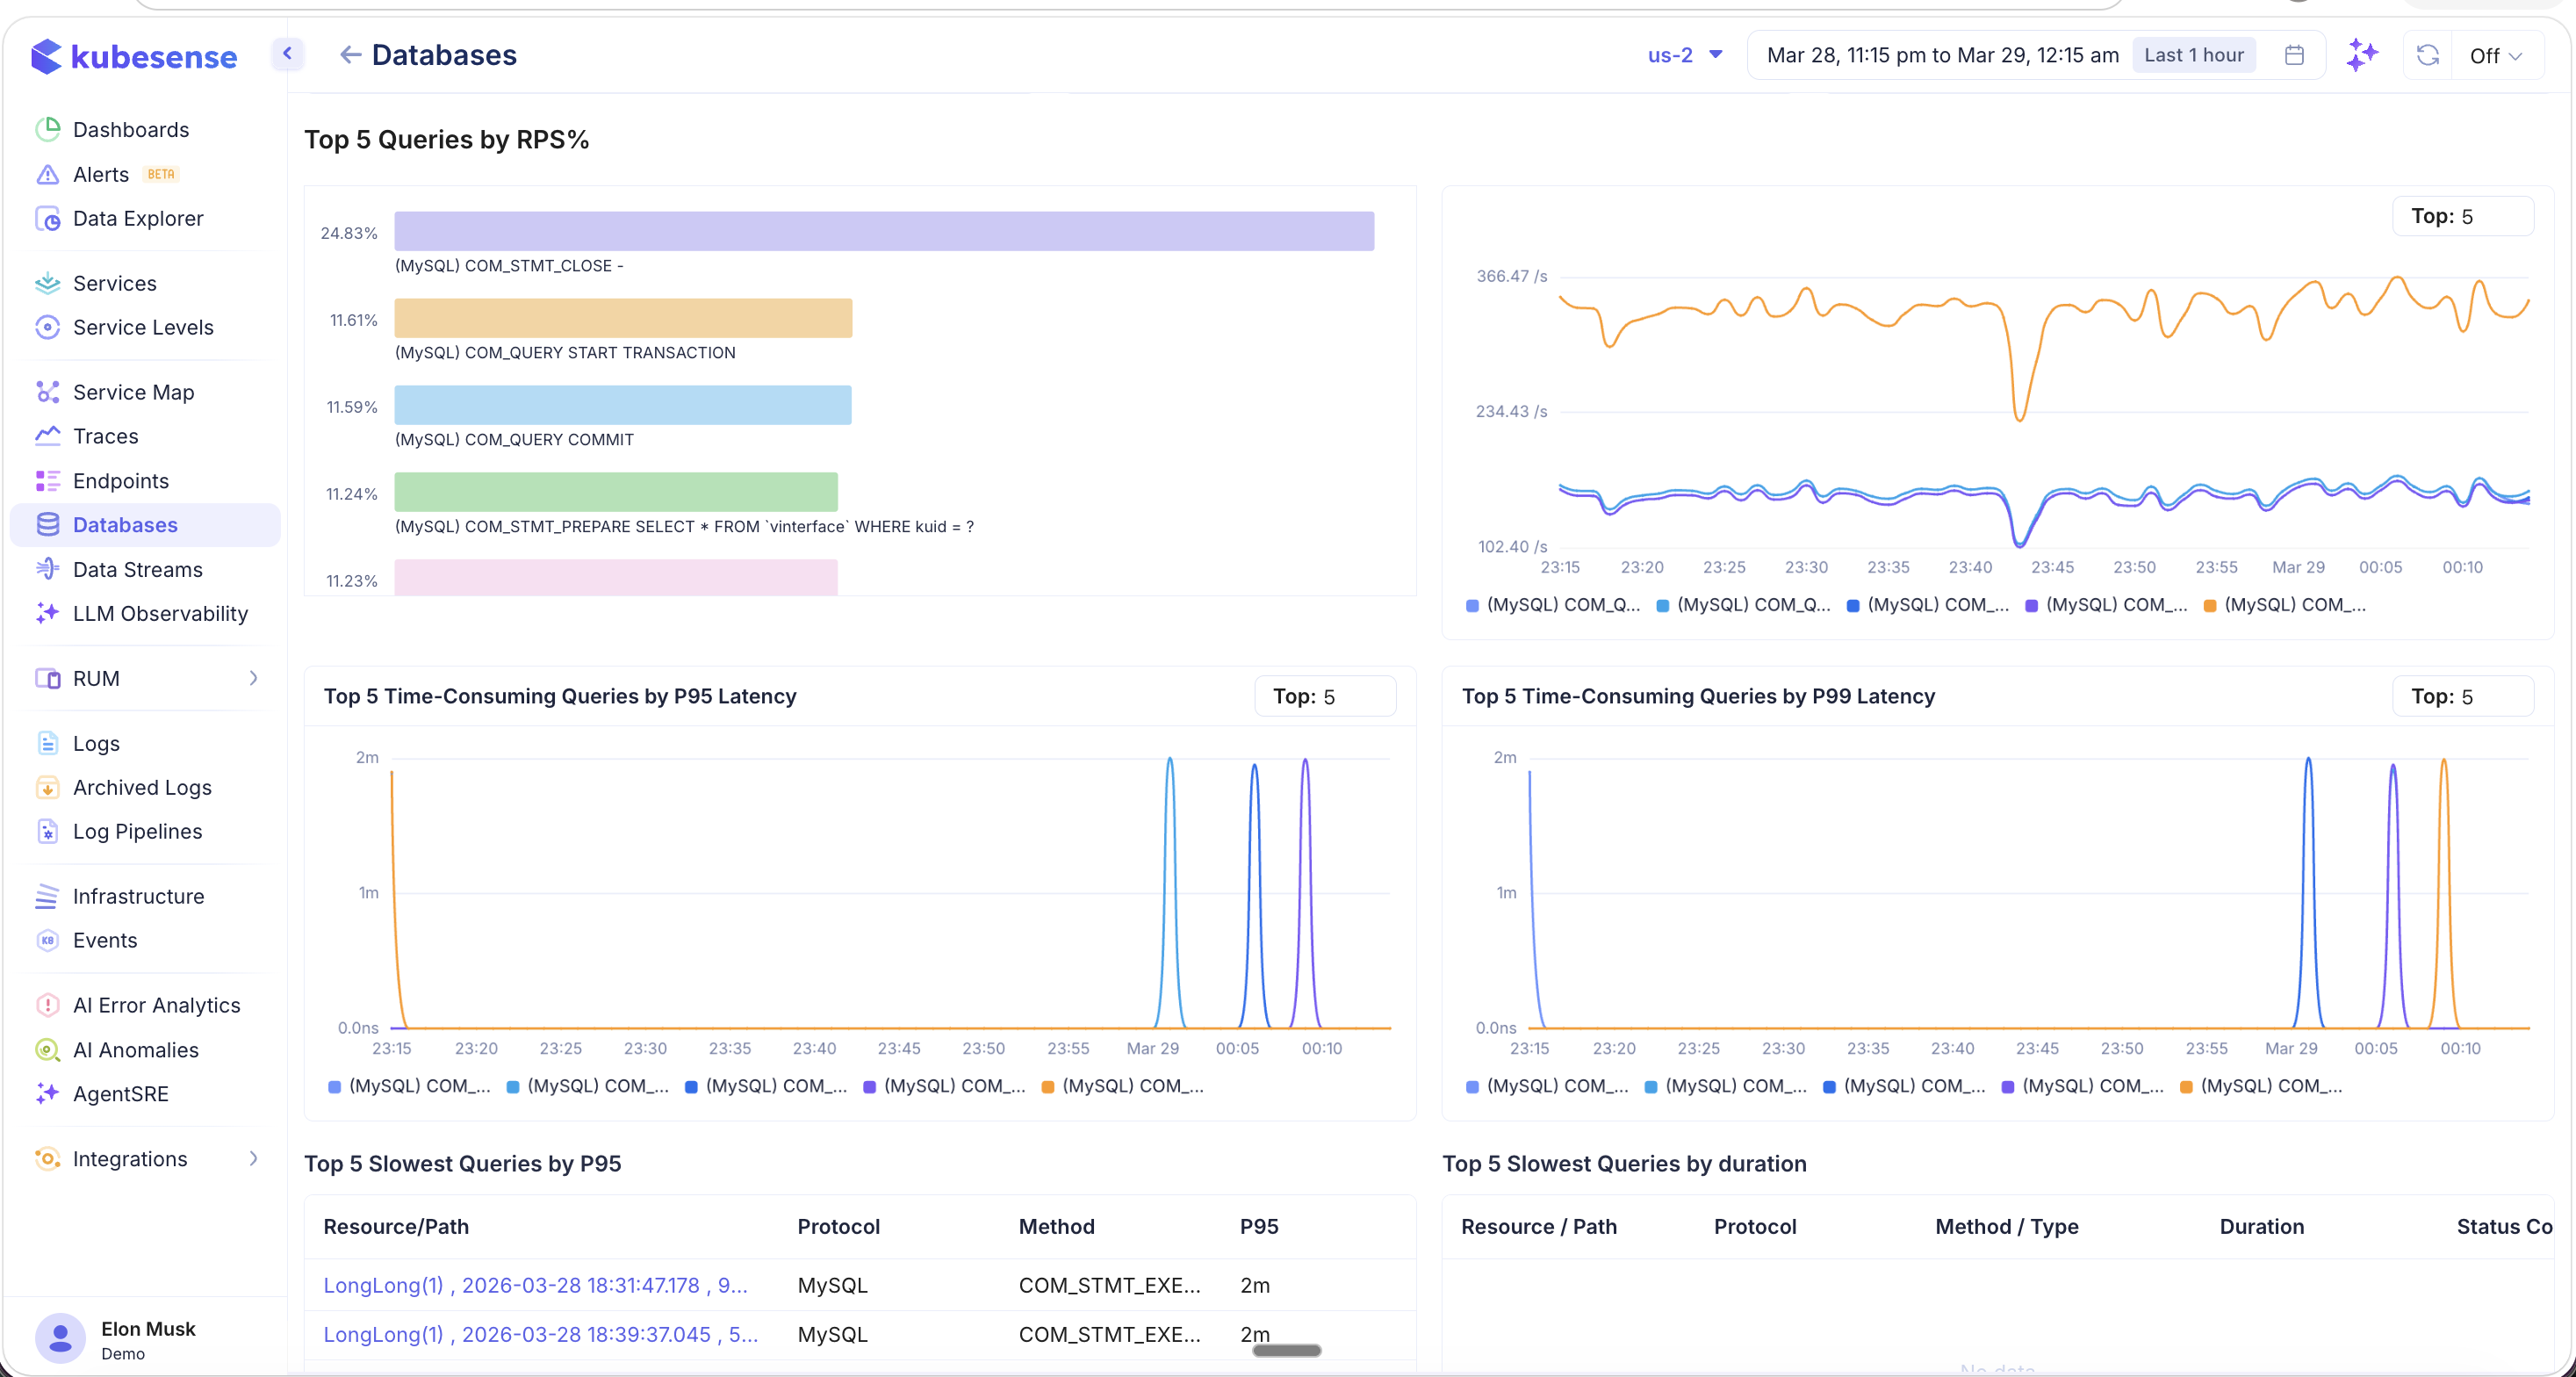
Top 5 Analytics:
- Top 5 Queries by RPS% — Bar chart showing which queries consume the most throughput, with a time-series trend
- Top 5 Time-Consuming Queries by P95 Latency — Latency trend for the slowest queries by P95
- Top 5 Time-Consuming Queries by P99 Latency — Latency trend for the slowest queries by P99
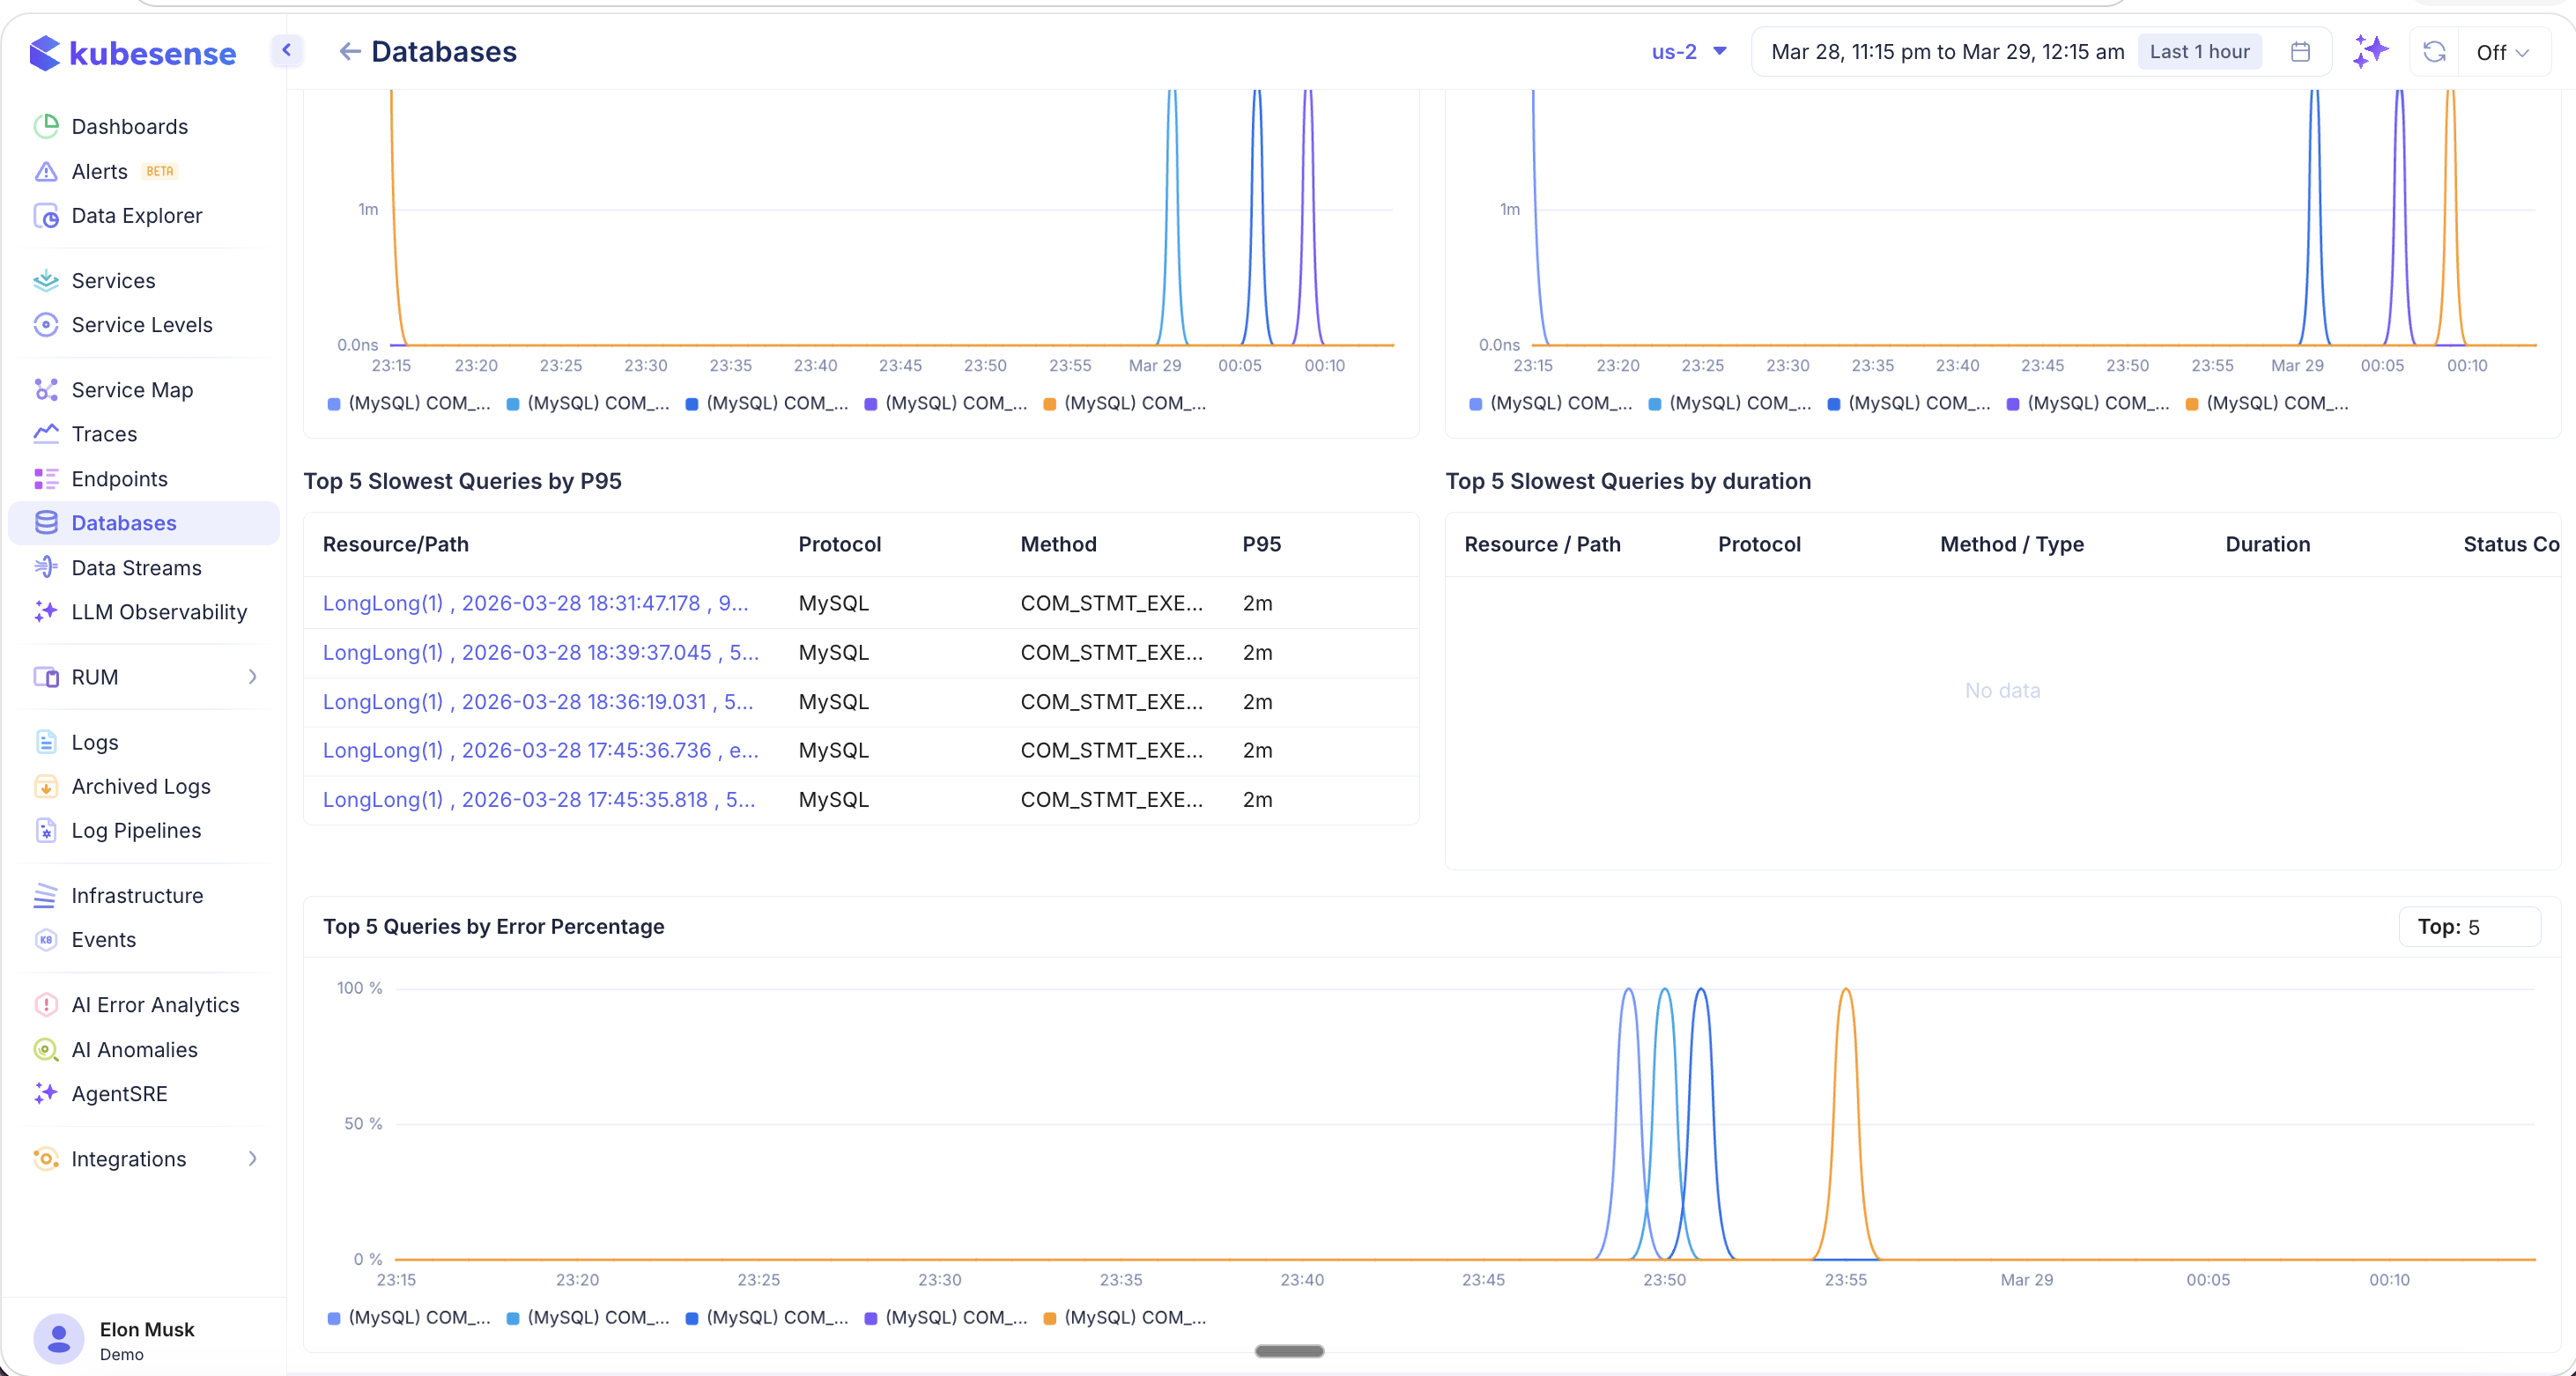
- Top 5 Slowest Queries by P95 — Table listing the slowest individual queries with Resource/Path, Protocol, Method, and P95
- Top 5 Slowest Queries by Duration — Table with Resource/Path, Protocol, Method/Type, Duration, and Status Code
- Top 5 Queries by Error Percentage — Time-series chart showing which queries have the highest error rates
MongoDB
The same dashboard layout applies to MongoDB databases, showing MongoDB-specific queries and operations:
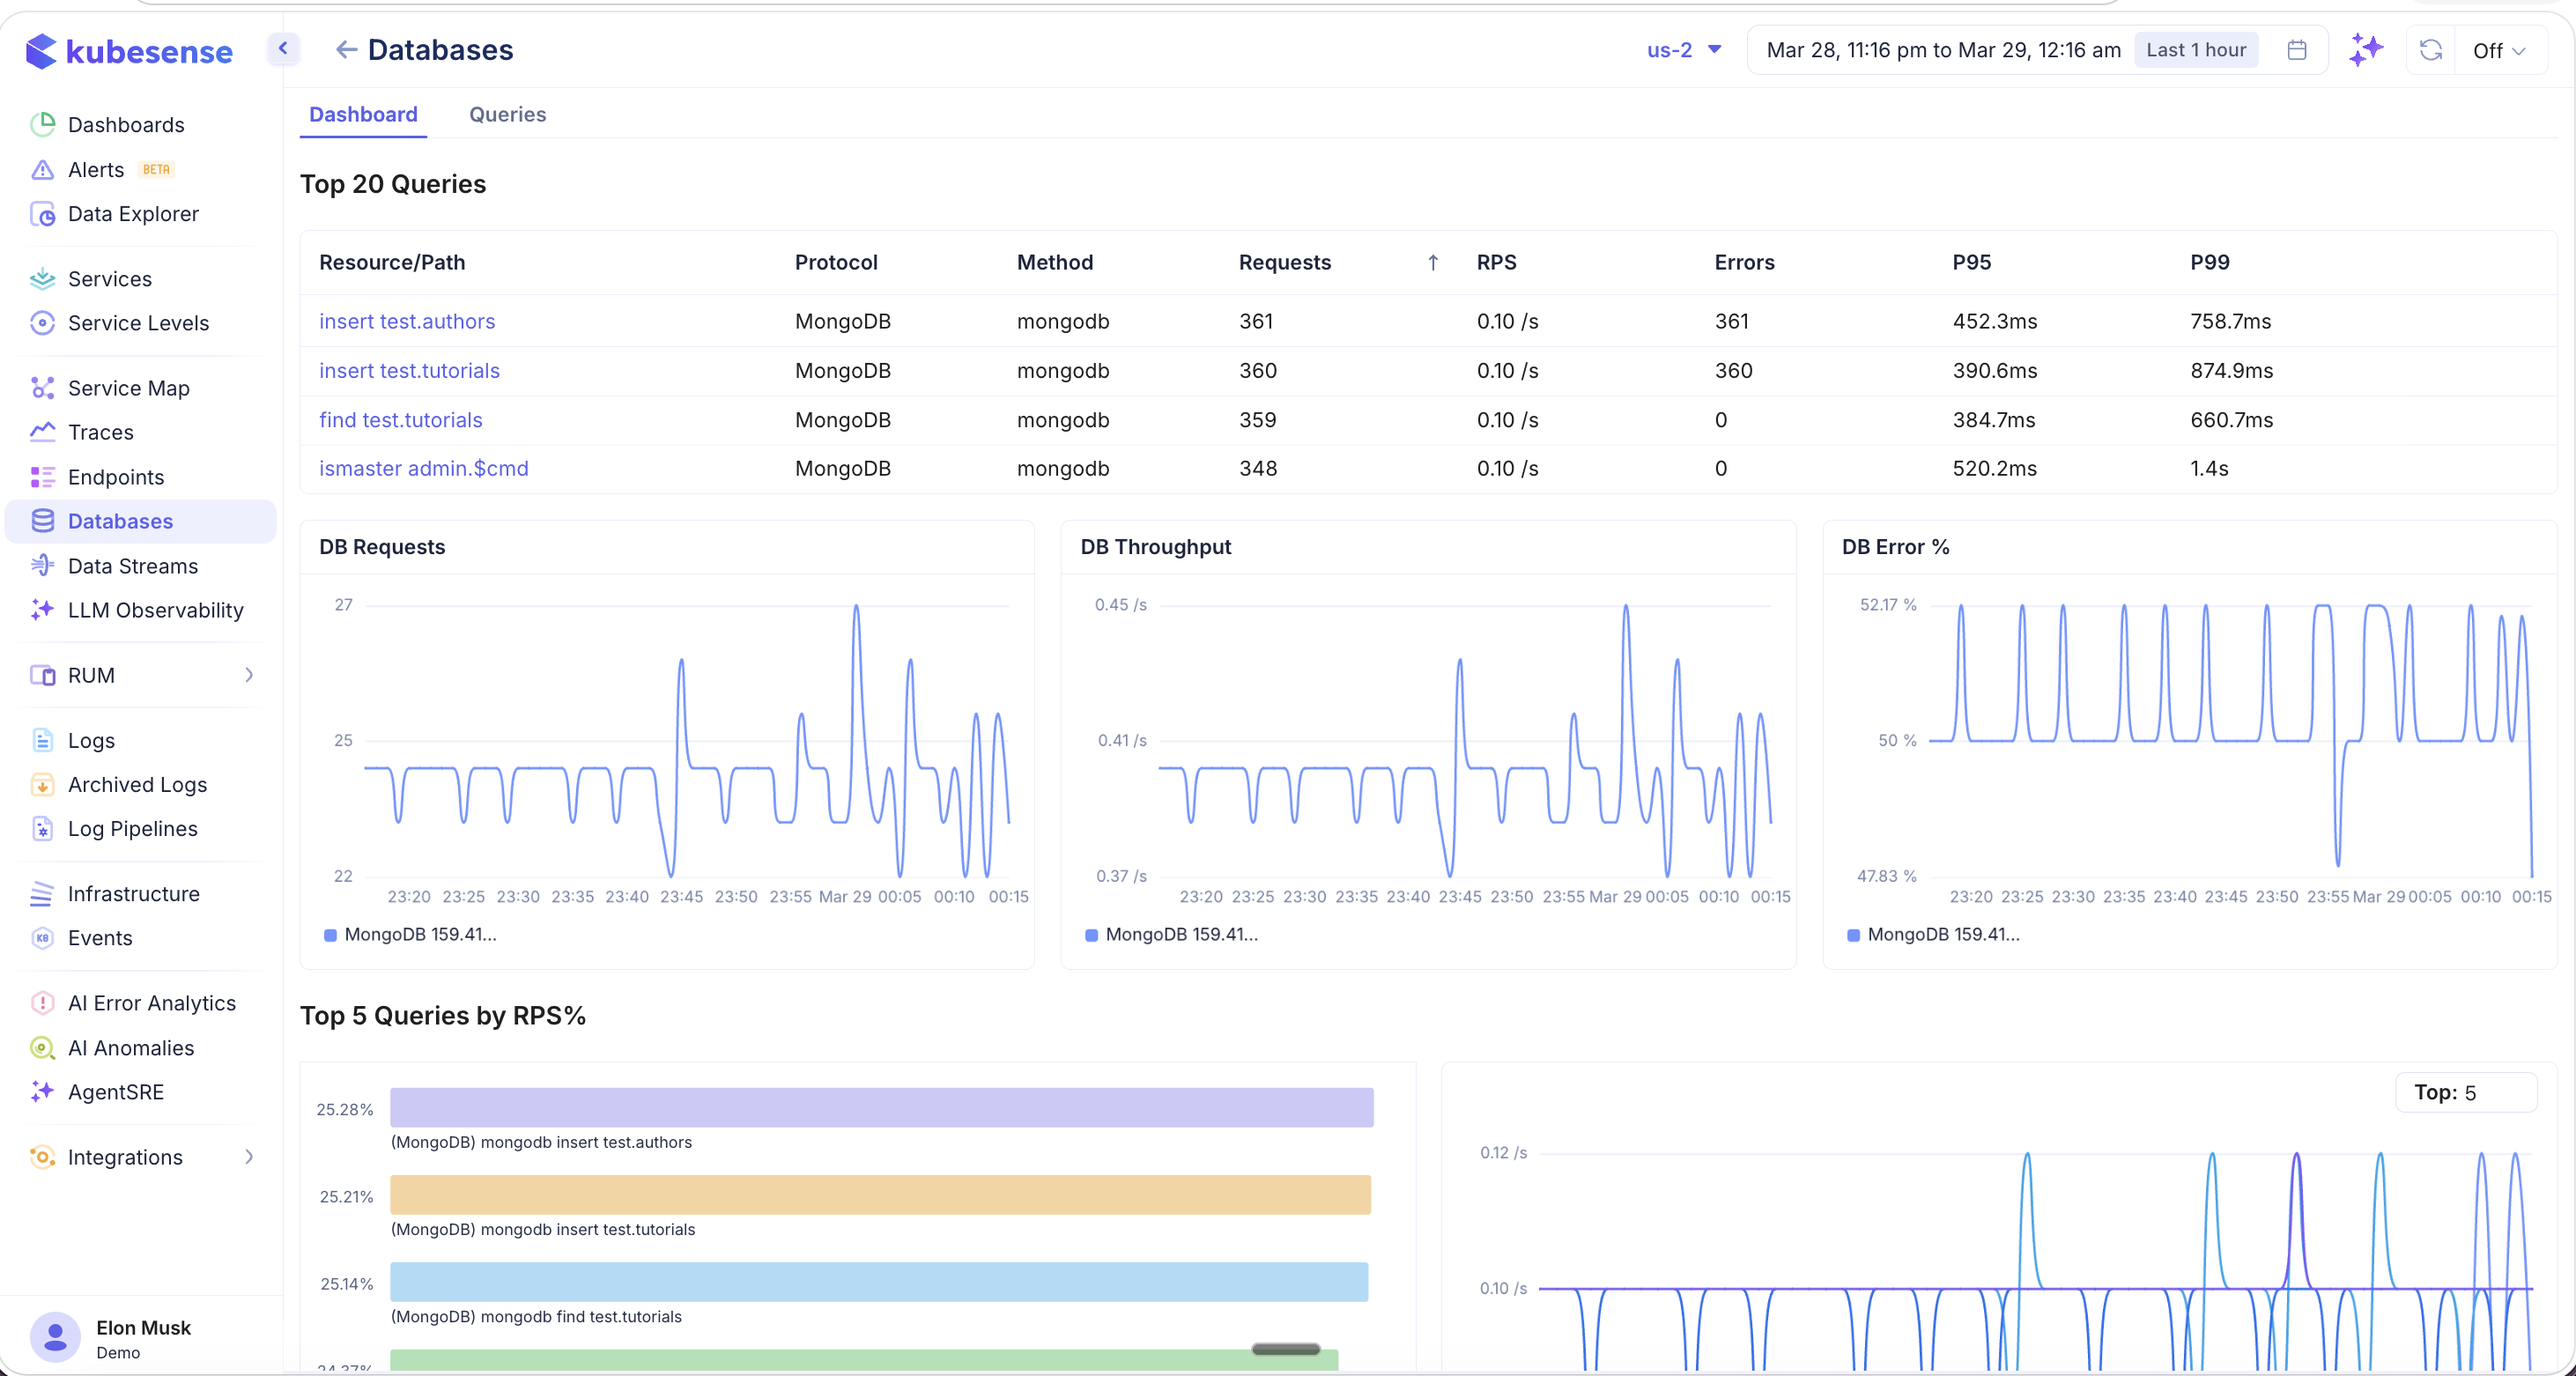
MongoDB operations like insert, find, and ismaster are listed with their collection names (e.g., insert test.authors, find test.tutorials, ismaster admin.$cmd). The DB Requests, DB Throughput, and DB Error % charts show MongoDB-specific traffic patterns.
Redis
Redis databases display commands and their performance metrics:
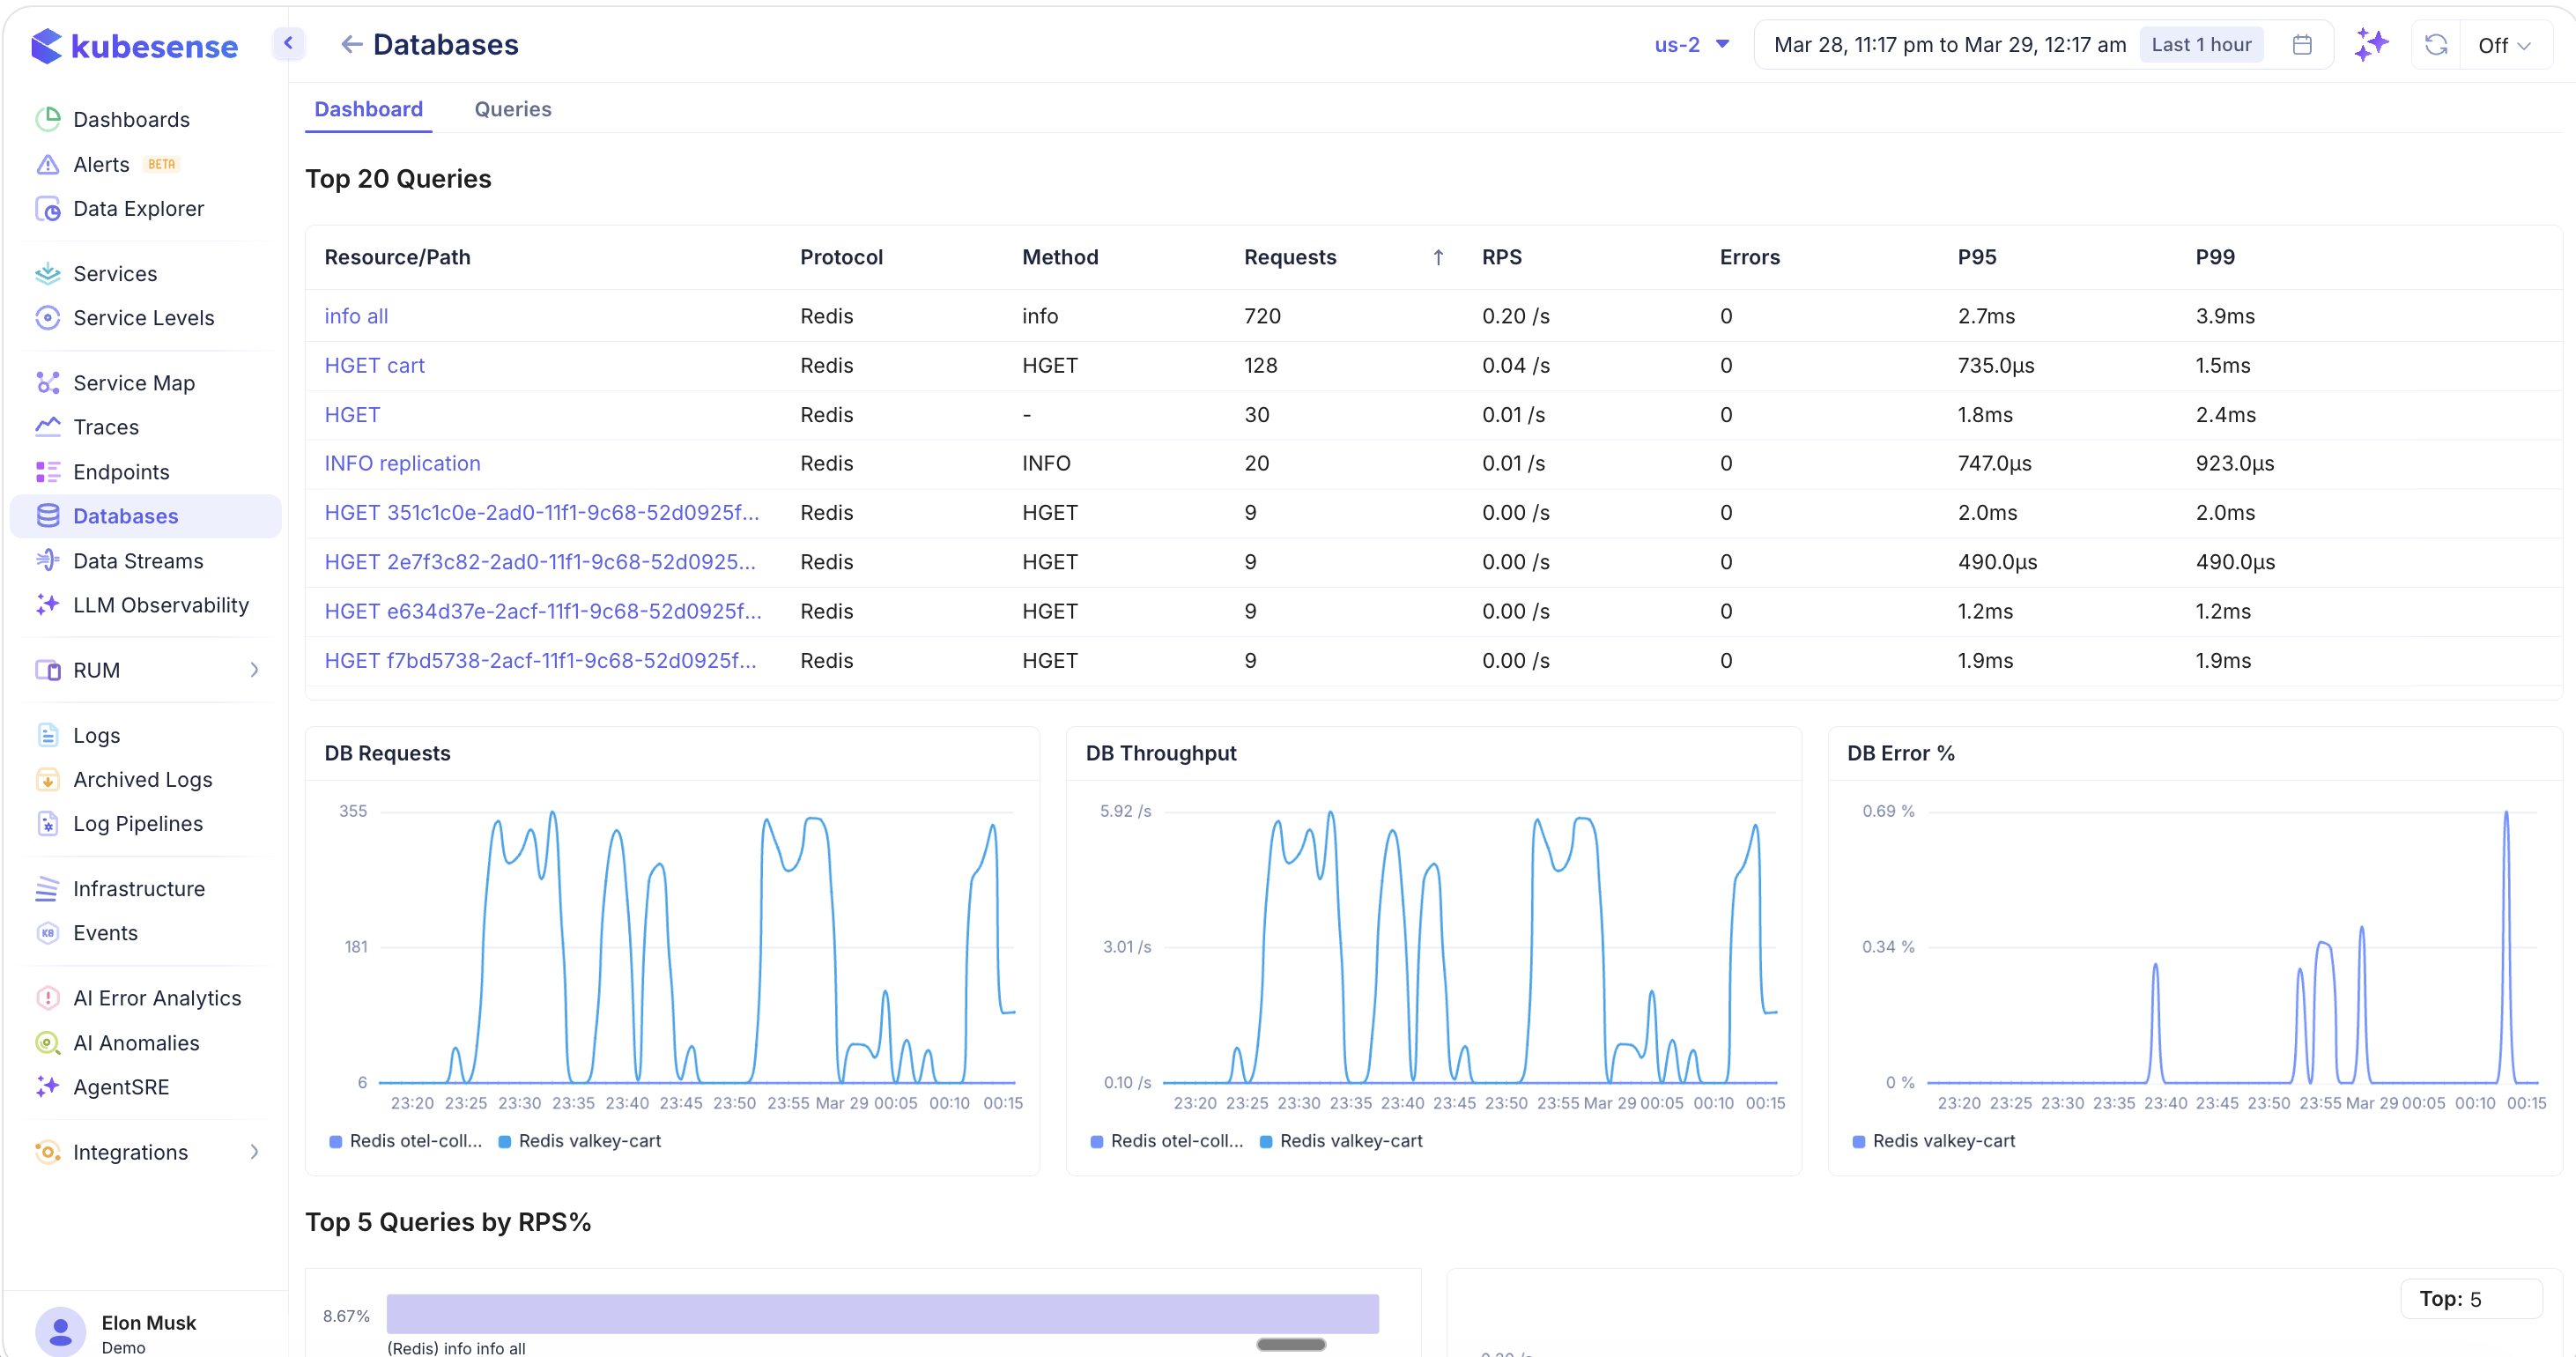
Redis operations include commands like info all, HGET cart, HGET, and INFO replication. The dashboard shows the same time-series charts (DB Requests, DB Throughput, DB Error %) with Redis-specific traffic patterns, including multiple Redis instances if present (e.g., otel-collector, valkey-cart).
Queries Tab
The Queries tab provides a complete explorer view of all unique queries executed against the database, with detailed per-query metrics.
MySQL Queries
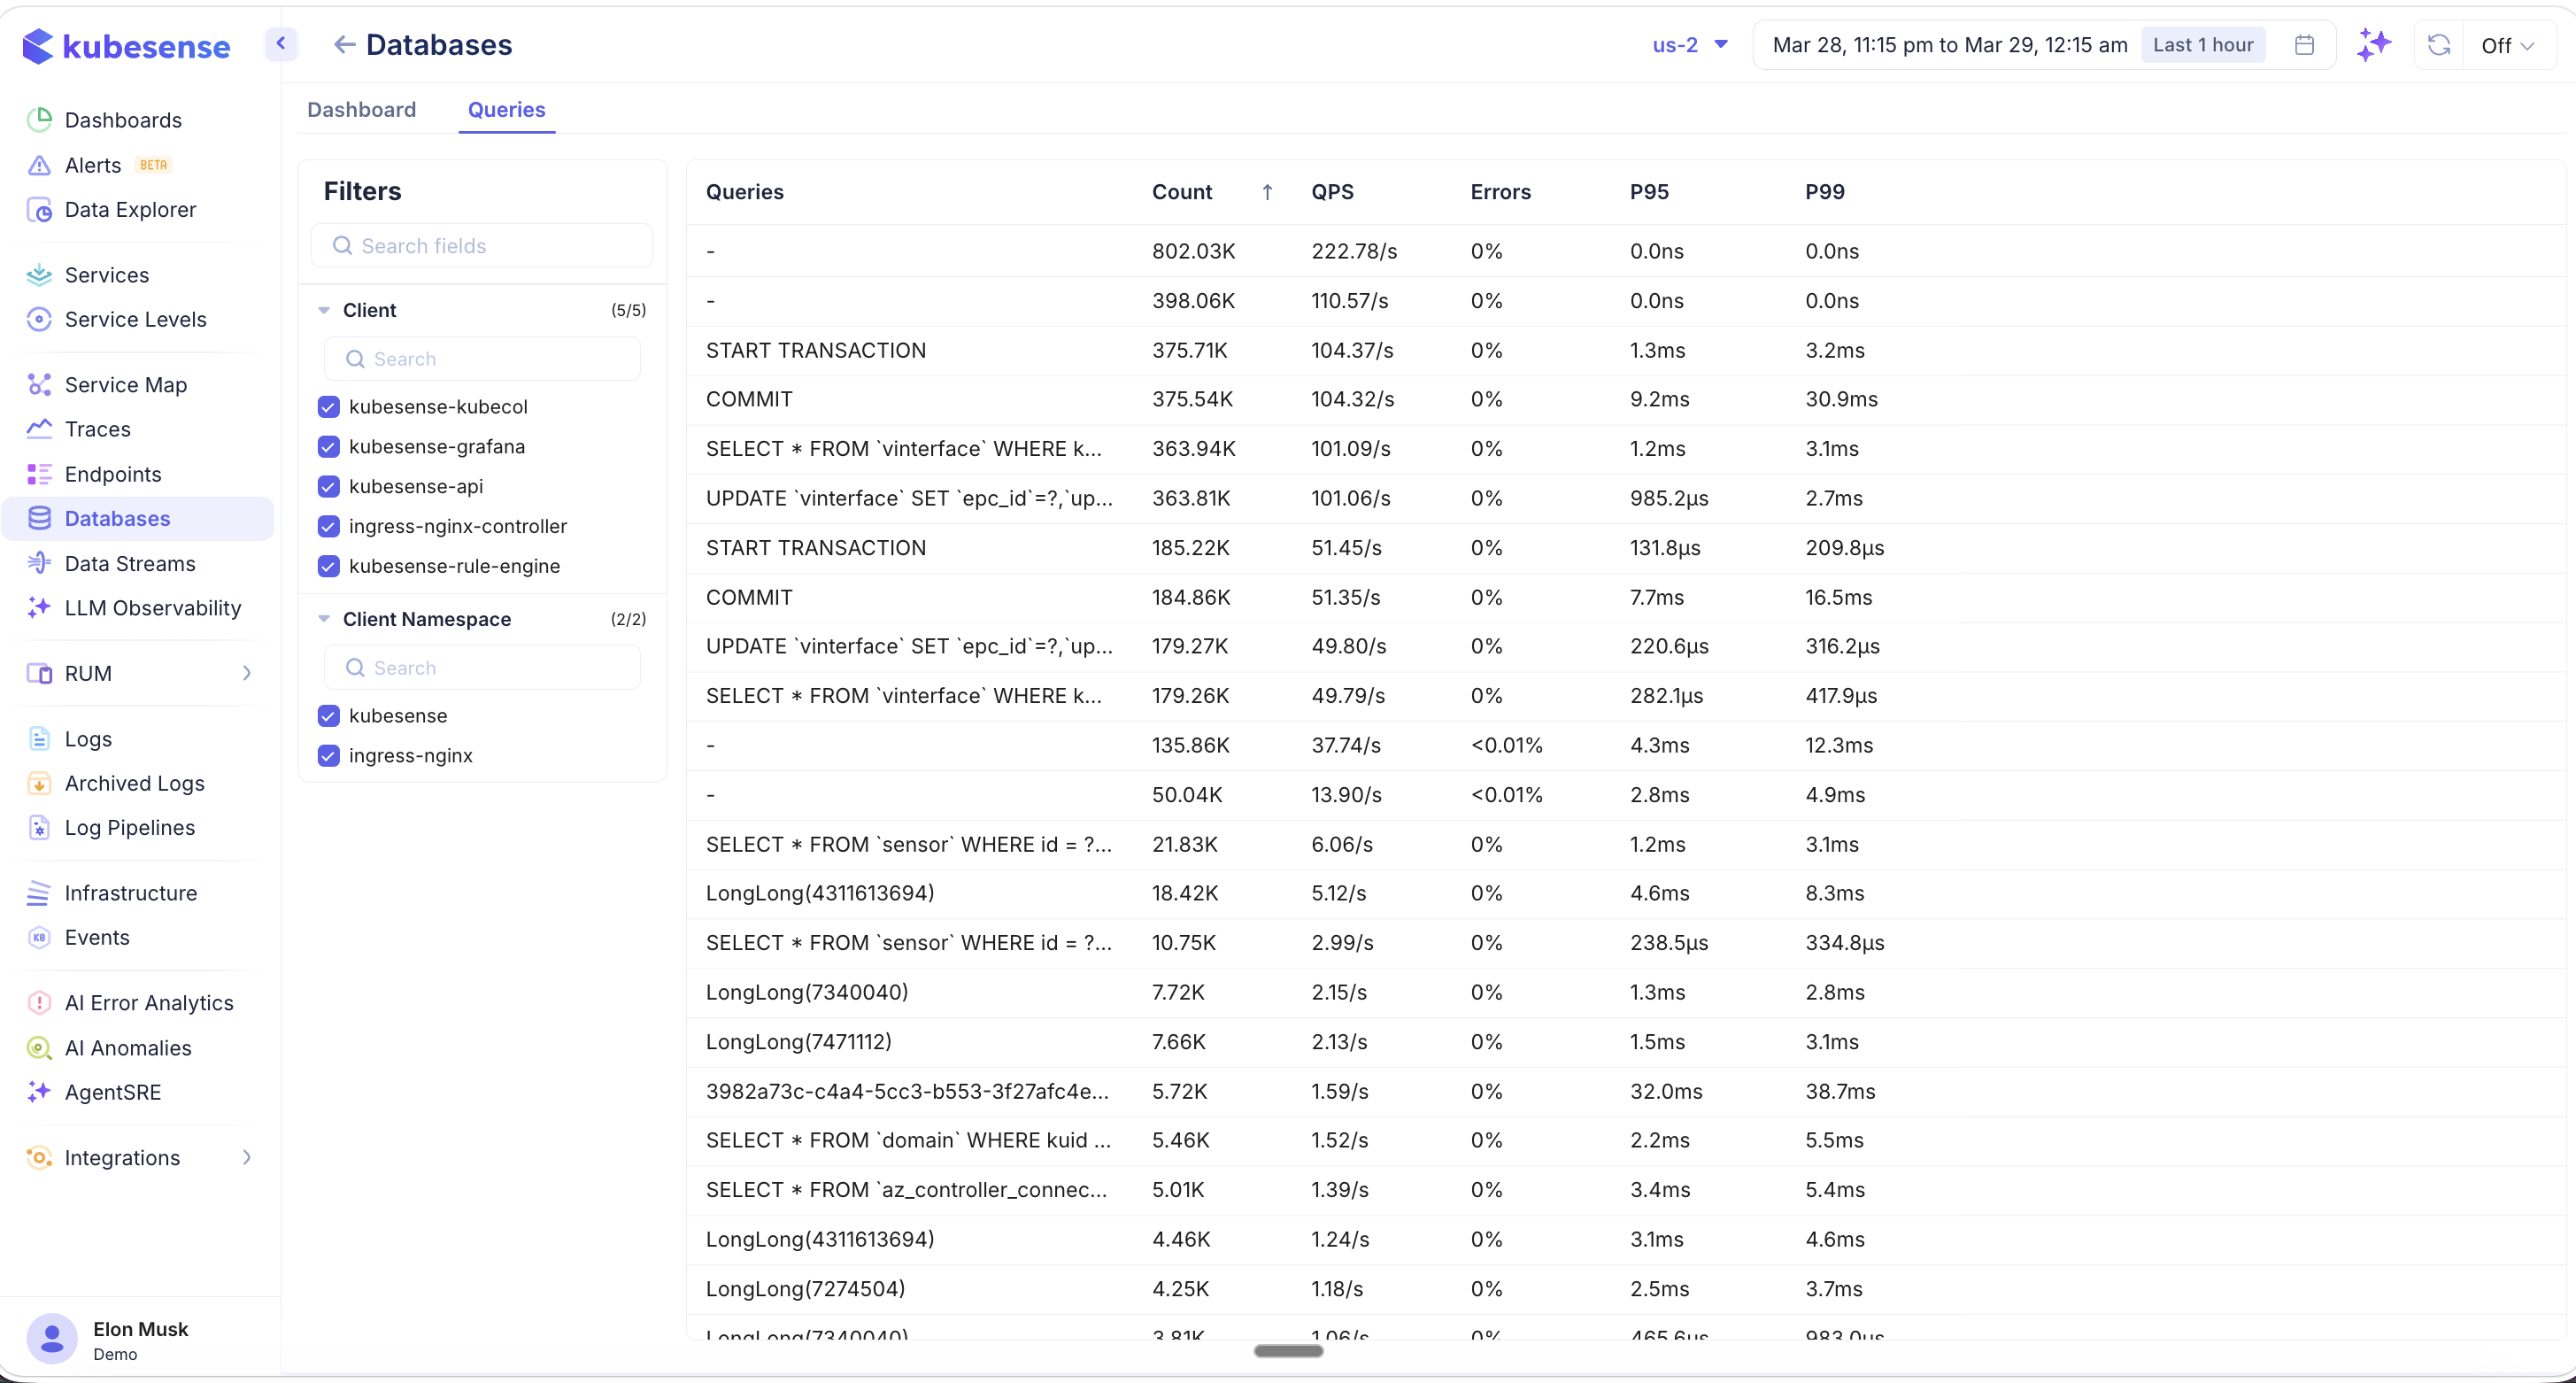
The queries table lists every unique query with:
- Queries — The SQL statement or operation
- Count — Total number of executions
- QPS — Queries per second
- Errors — Error percentage
- P95 / P99 — Latency percentiles
Filters on the left panel let you narrow queries by:
- Client — The workload making the queries (e.g., kubesense-kubecol, kubesense-grafana, kubesense-api, ingress-nginx-controller, kubesense-rule-engine)
- Client Namespace — The Kubernetes namespace of the calling service (e.g., kubesense, ingress-nginx)
Redis Queries
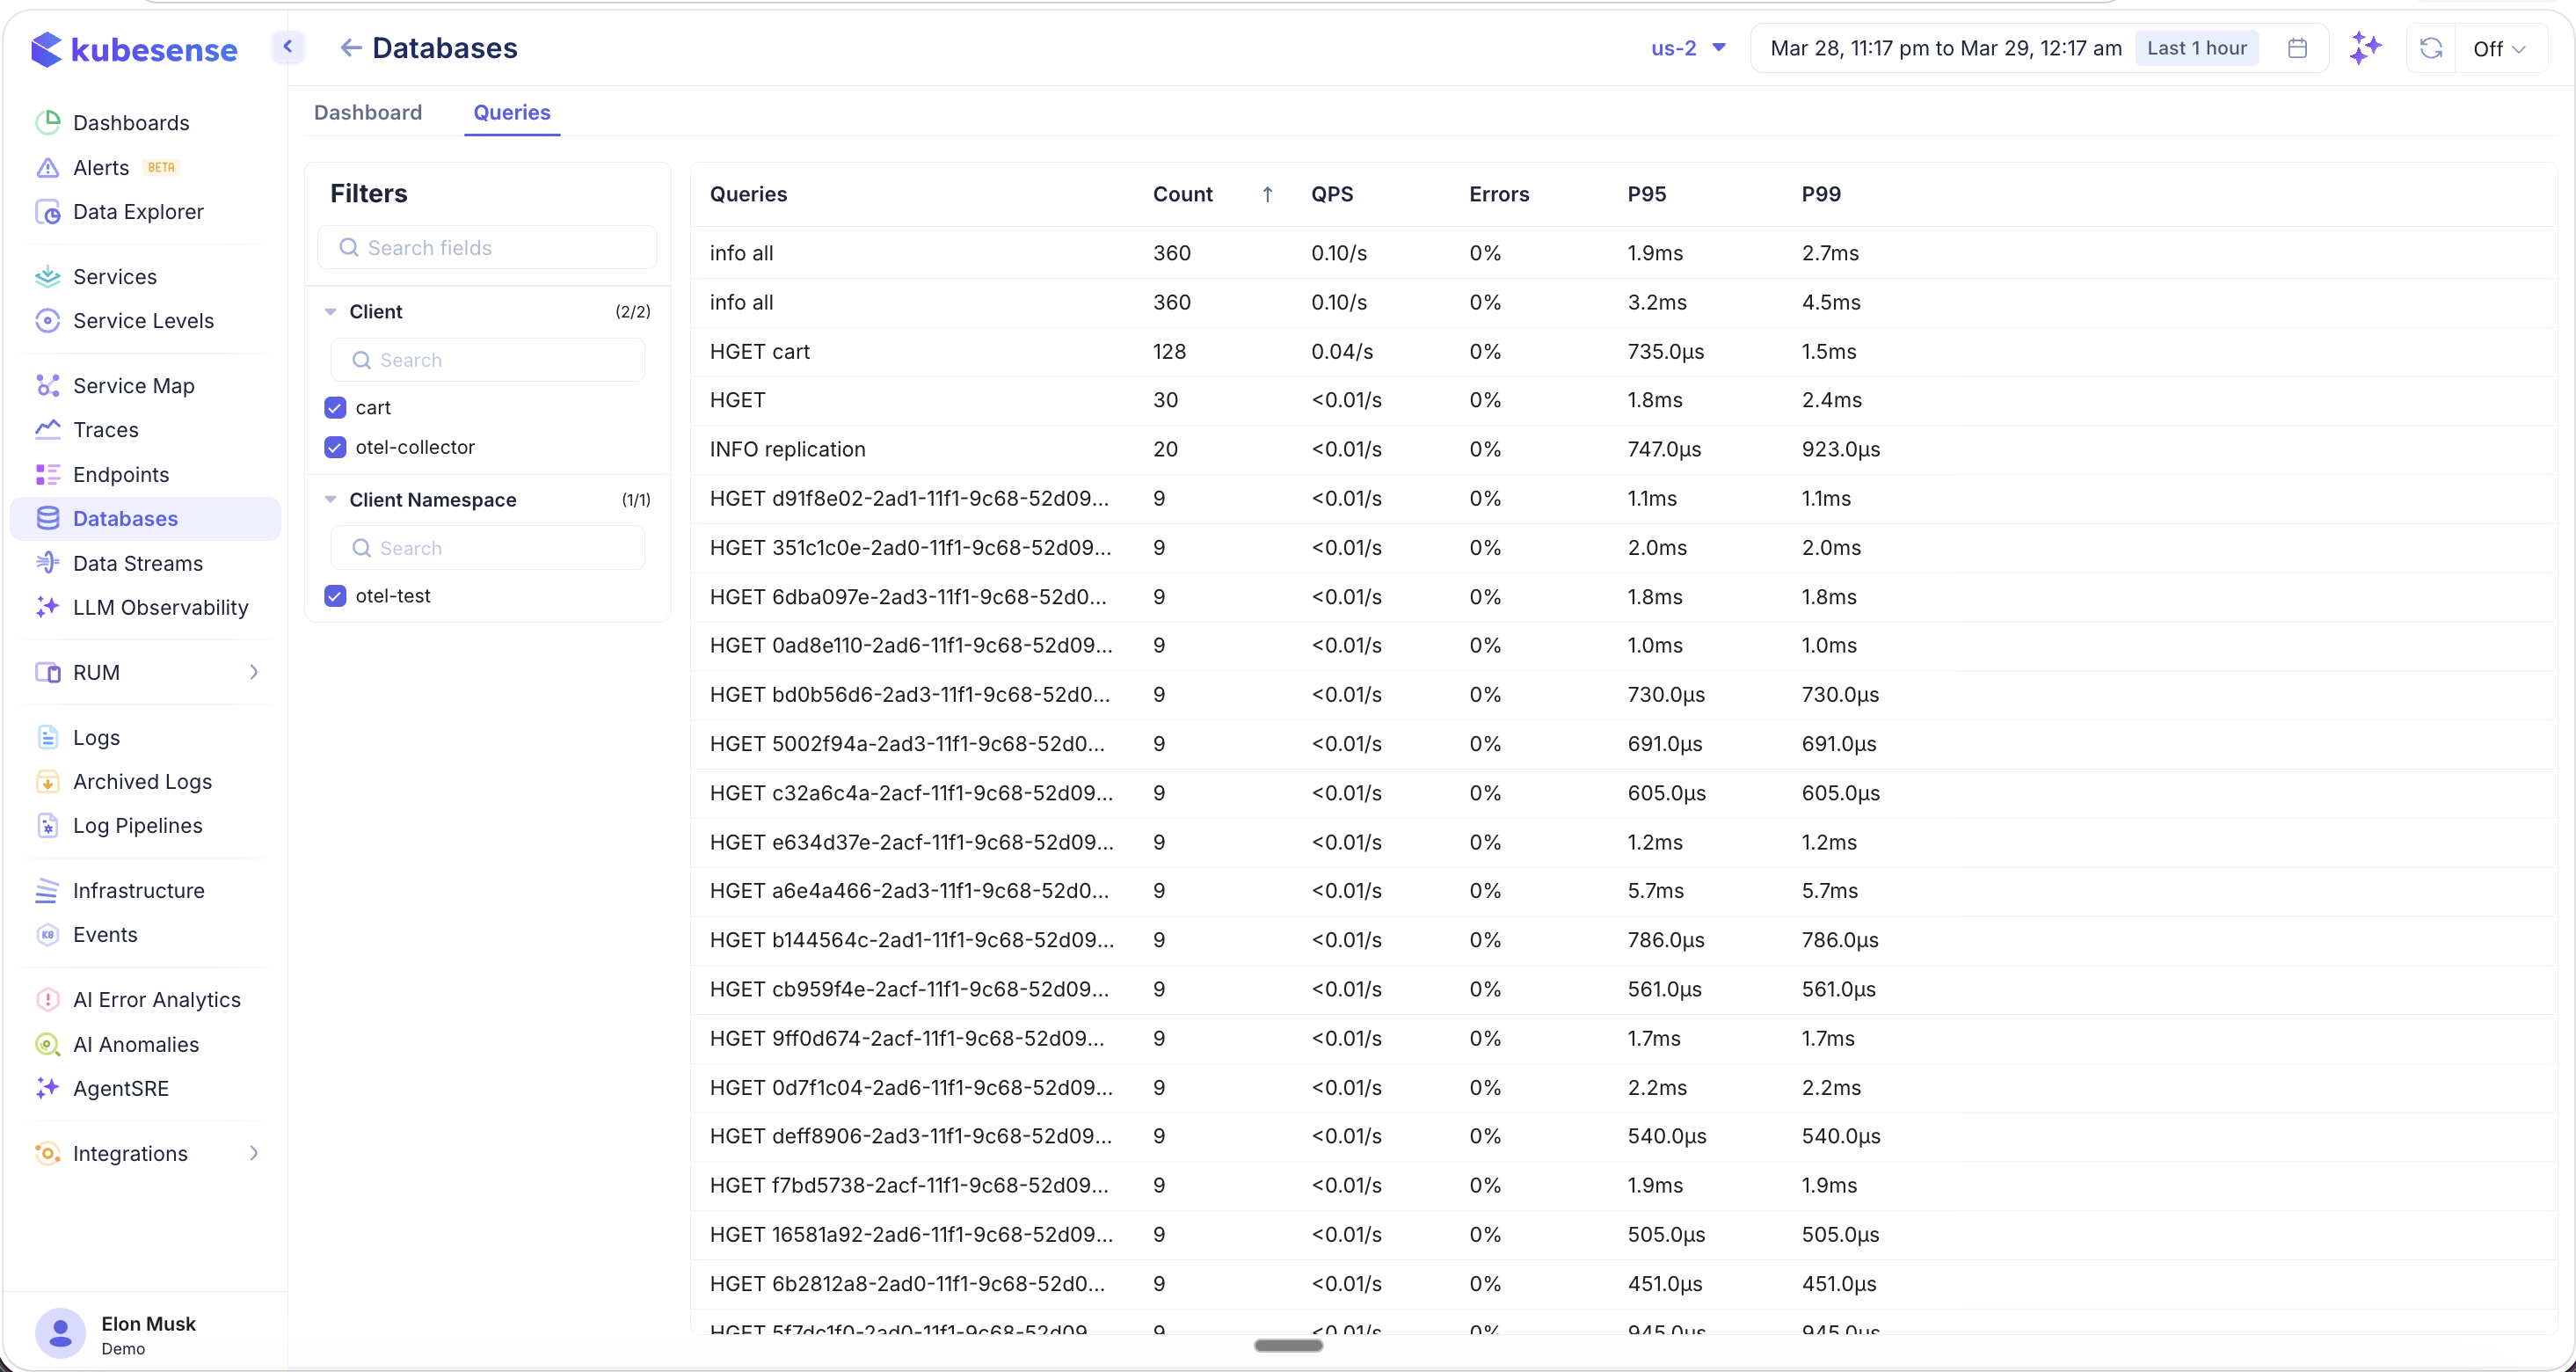
Redis queries show individual commands with their keys (e.g., info all, HGET cart, HGET d91f8e02-2ad1-...). The Client filter shows which workloads are making Redis calls (e.g., cart, otel-collector), and the Client Namespace filter narrows to specific namespaces.
This is particularly useful when multiple clients or namespaces are querying the same database — you can isolate traffic from a specific service to identify which application is causing high load or errors.
Supported Databases
| Database | Protocol | Auto-Discovered | Key Metrics |
|---|---|---|---|
| MySQL | MySQL | Yes (eBPF) | QPS, latency (P95/P99), error rate, slow queries, query types |
| Redis | Redis | Yes (eBPF) | Commands/sec, latency, error rate, command types |
| MongoDB | MongoDB | Yes (eBPF) | Operations/sec, latency, error rate, collection operations |
| PostgreSQL | PostgreSQL | Yes (eBPF) | QPS, latency, error rate |
Use Cases
- Slow query detection — Use the Top 5 Slowest Queries tables and P95/P99 charts to find problematic queries
- Query optimization — Identify the highest-throughput queries (Top 5 by RPS%) and optimize the most impactful ones first
- Error investigation — The Error % chart and per-query error rates help pinpoint failing operations
- Client attribution — Use the Queries tab with Client and Client Namespace filters to identify which services are generating the most database load
- Capacity planning — Monitor QPS and throughput trends to anticipate scaling needs
- Multi-database visibility — See MySQL, Redis, MongoDB, and PostgreSQL in a single unified view