
Log to Metrics
Log to Metrics turns matching log events into metrics that you can use in Explorer and Dashboards. Define which logs to include, choose how to group them, preview the resulting volume over time, then save the metric for ongoing use.
Log Metrics List
Open Settings > Logs Metrics to view the generated metrics in your environment. The list shows each metric's name, filter query, measure, and group-by fields. Use the menu on a metric to manage it.
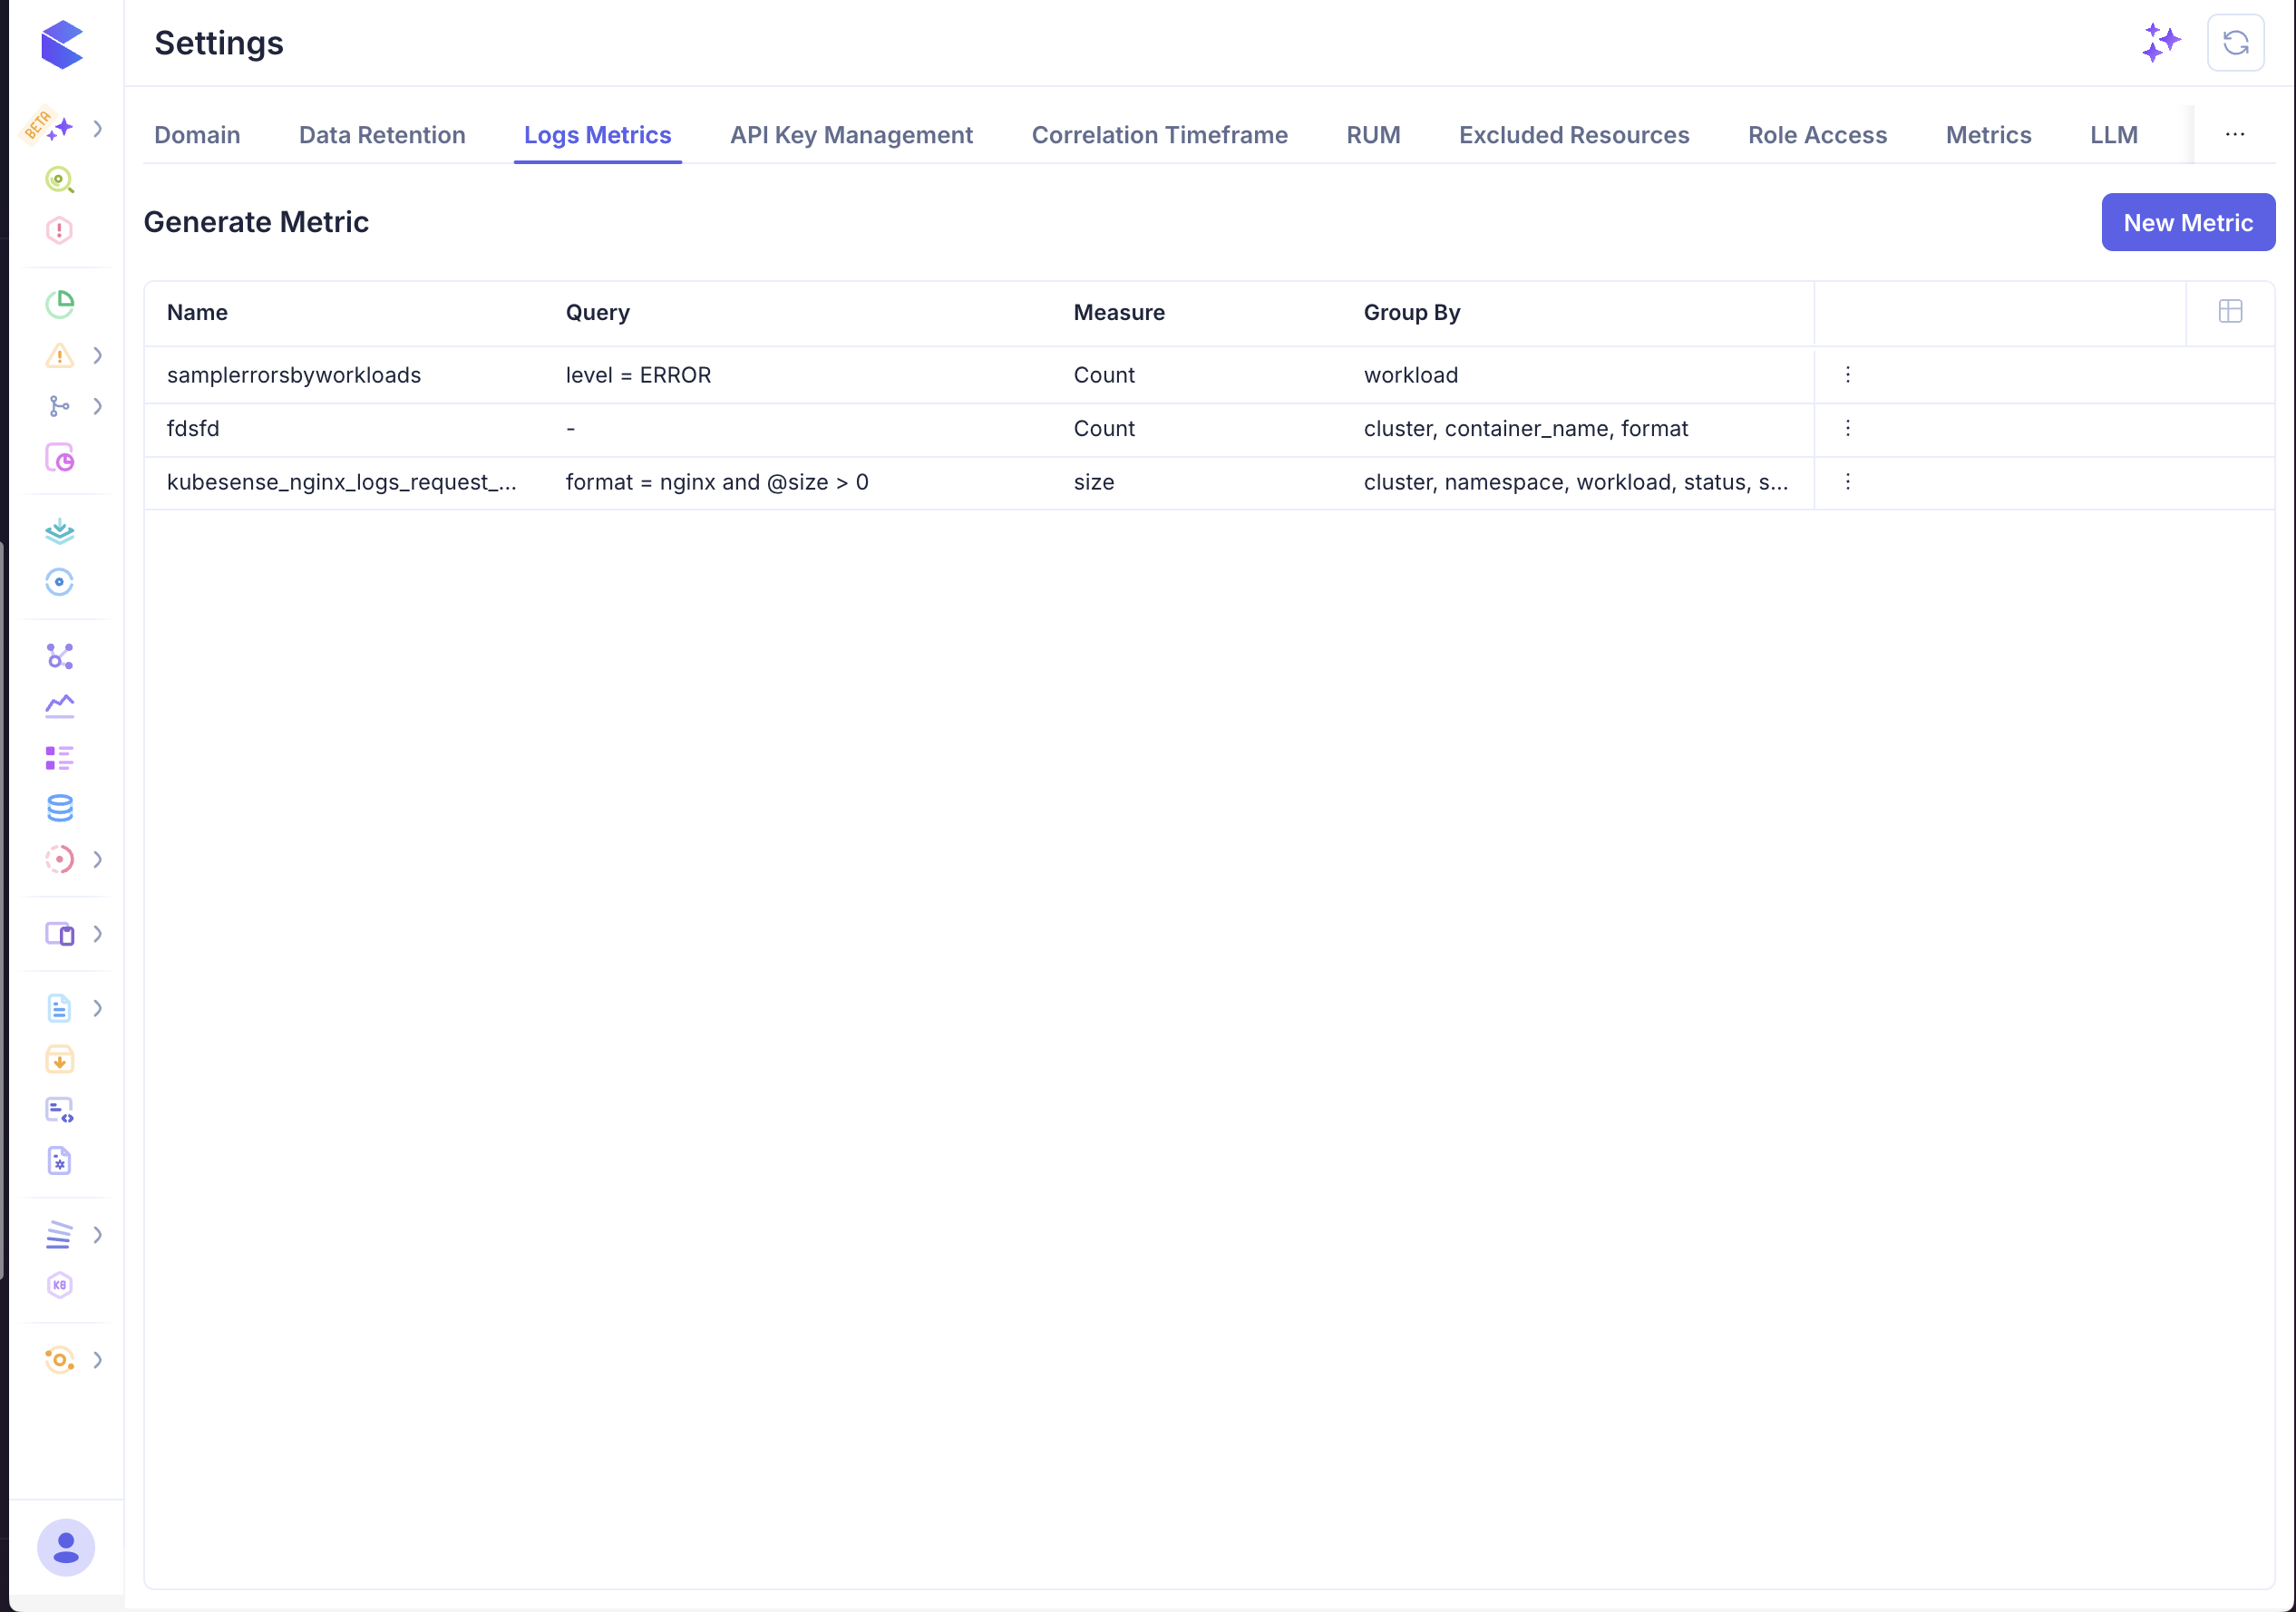
Select New Metric to create a metric from logs.
Create a Metric
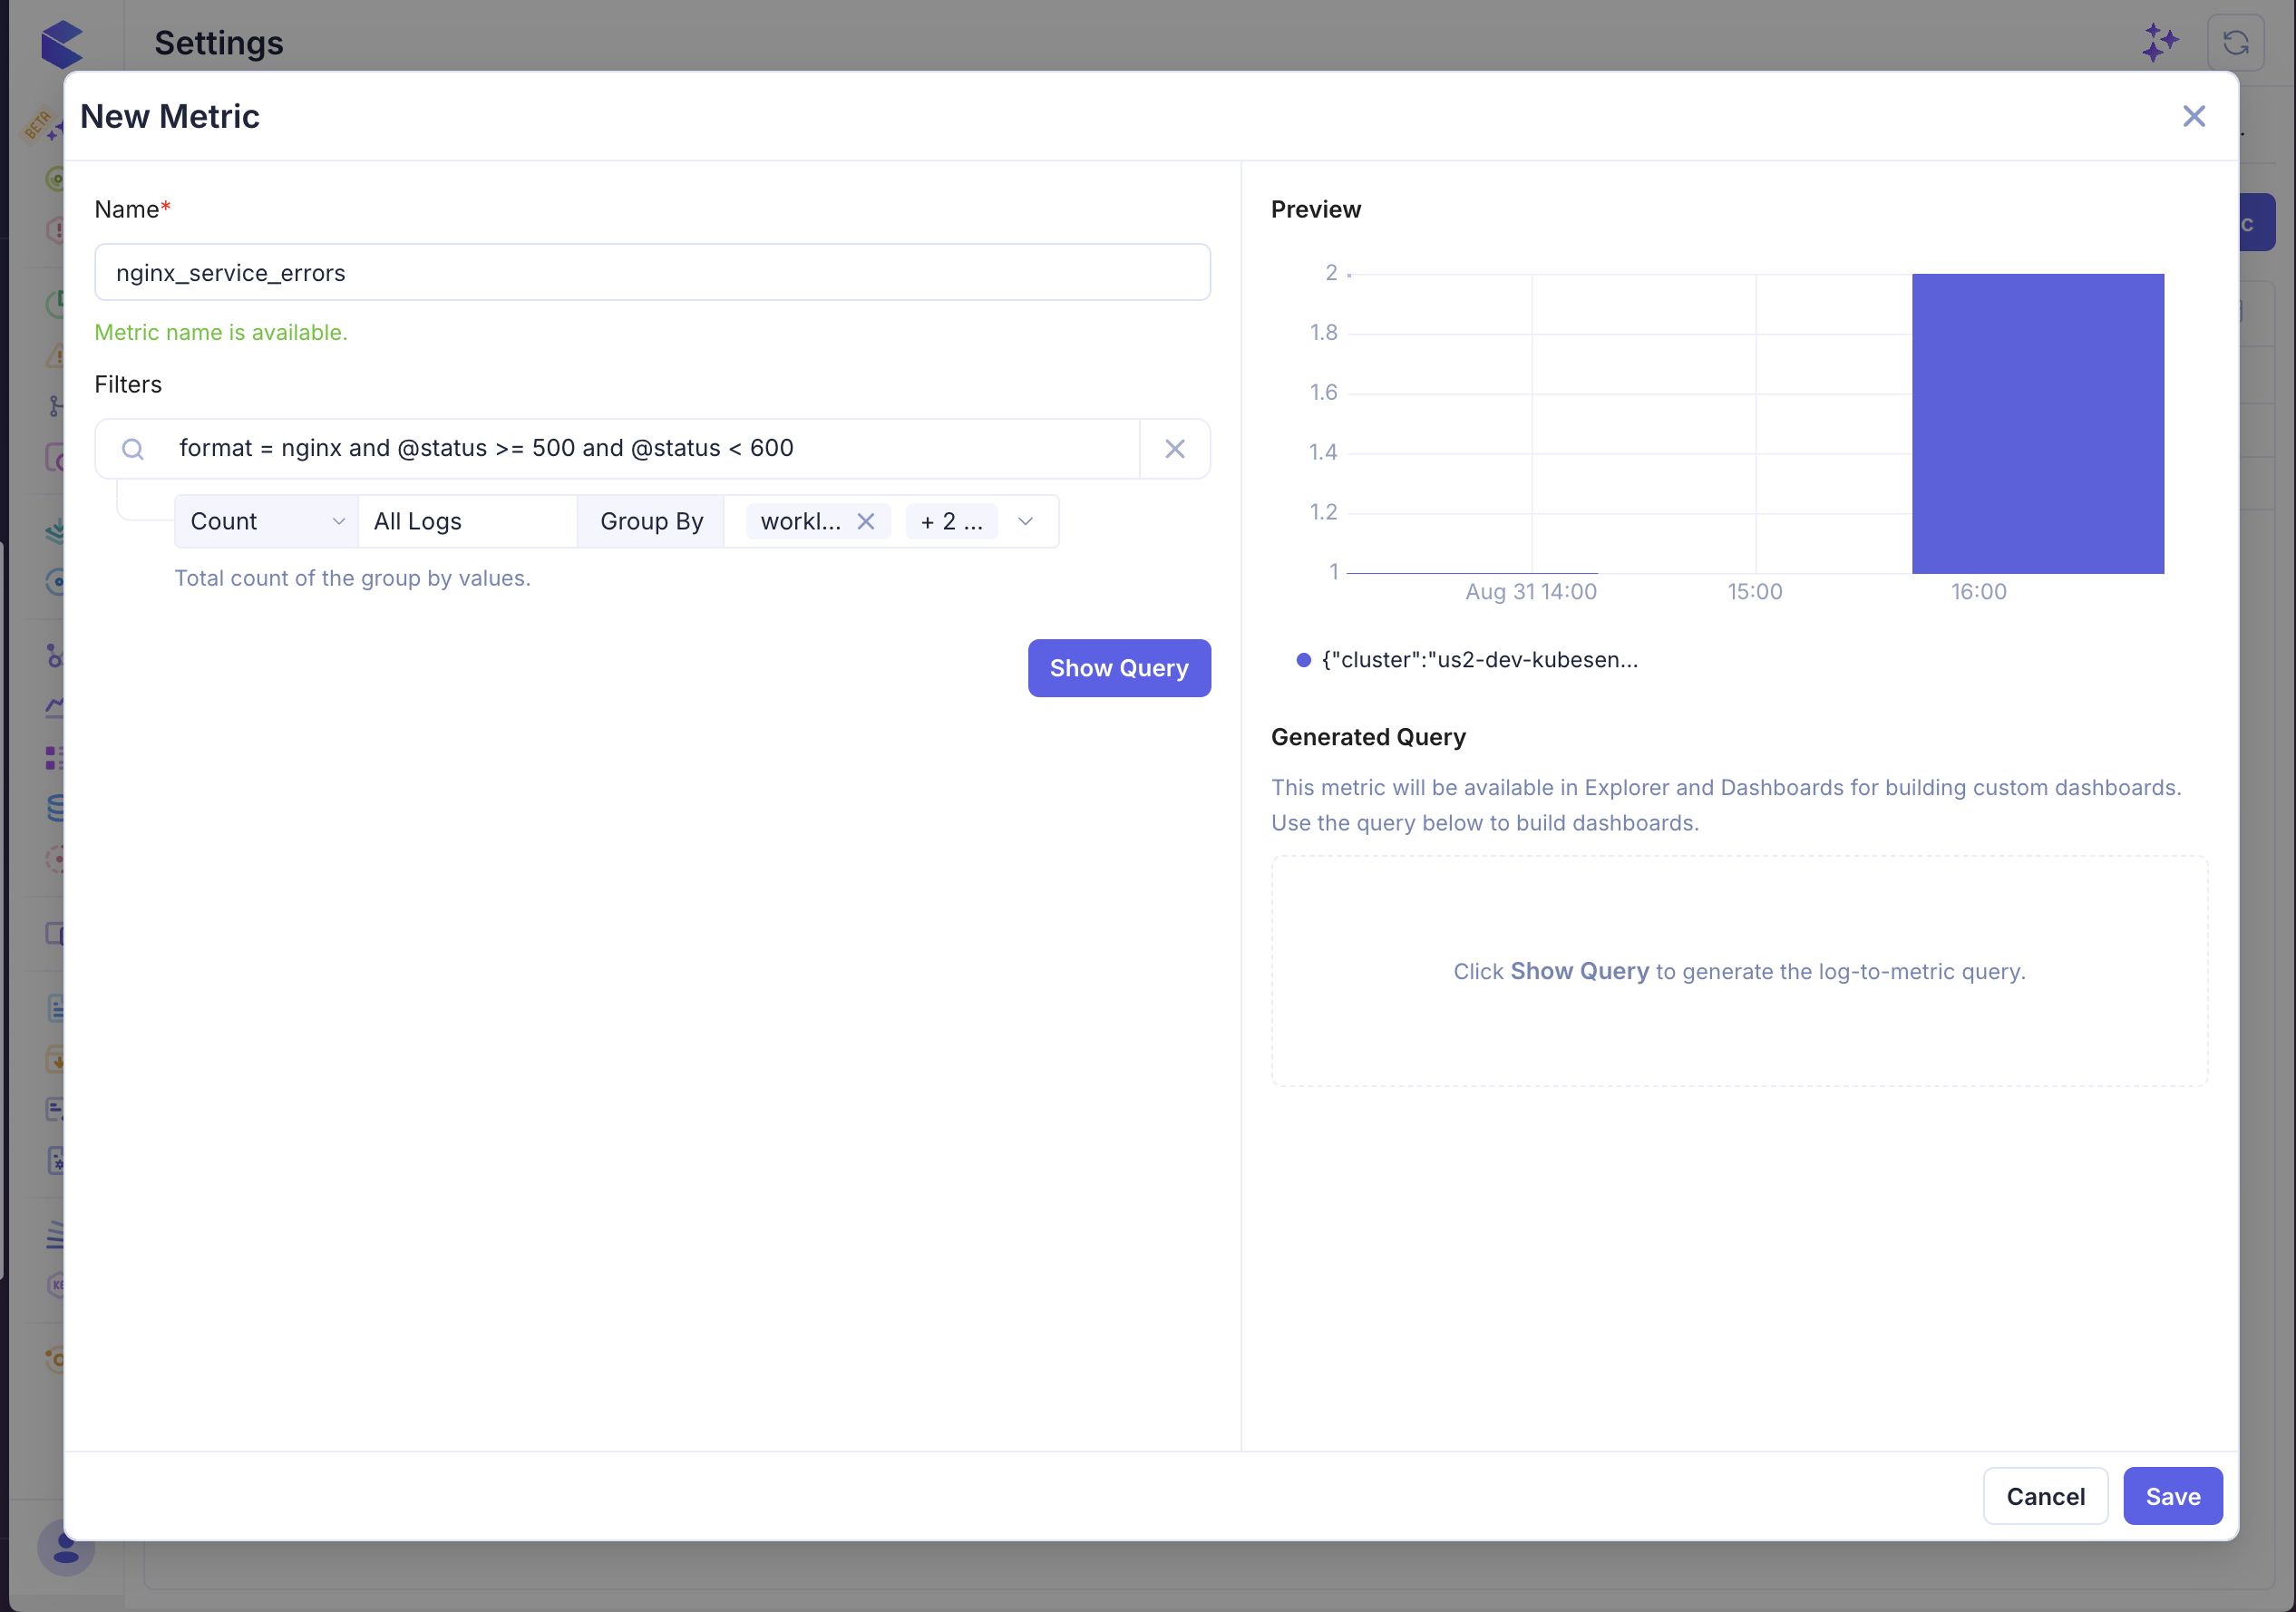
Give the metric a clear, stable name, then use the filter query to select the log events that should contribute to it. For example, the query below selects NGINX logs with an HTTP status from 500 through 599:
format = nginx and @status >= 500 and @status < 600Choose Count to count matching log events. Select All Logs to count every event that matches the filter.
Distribution
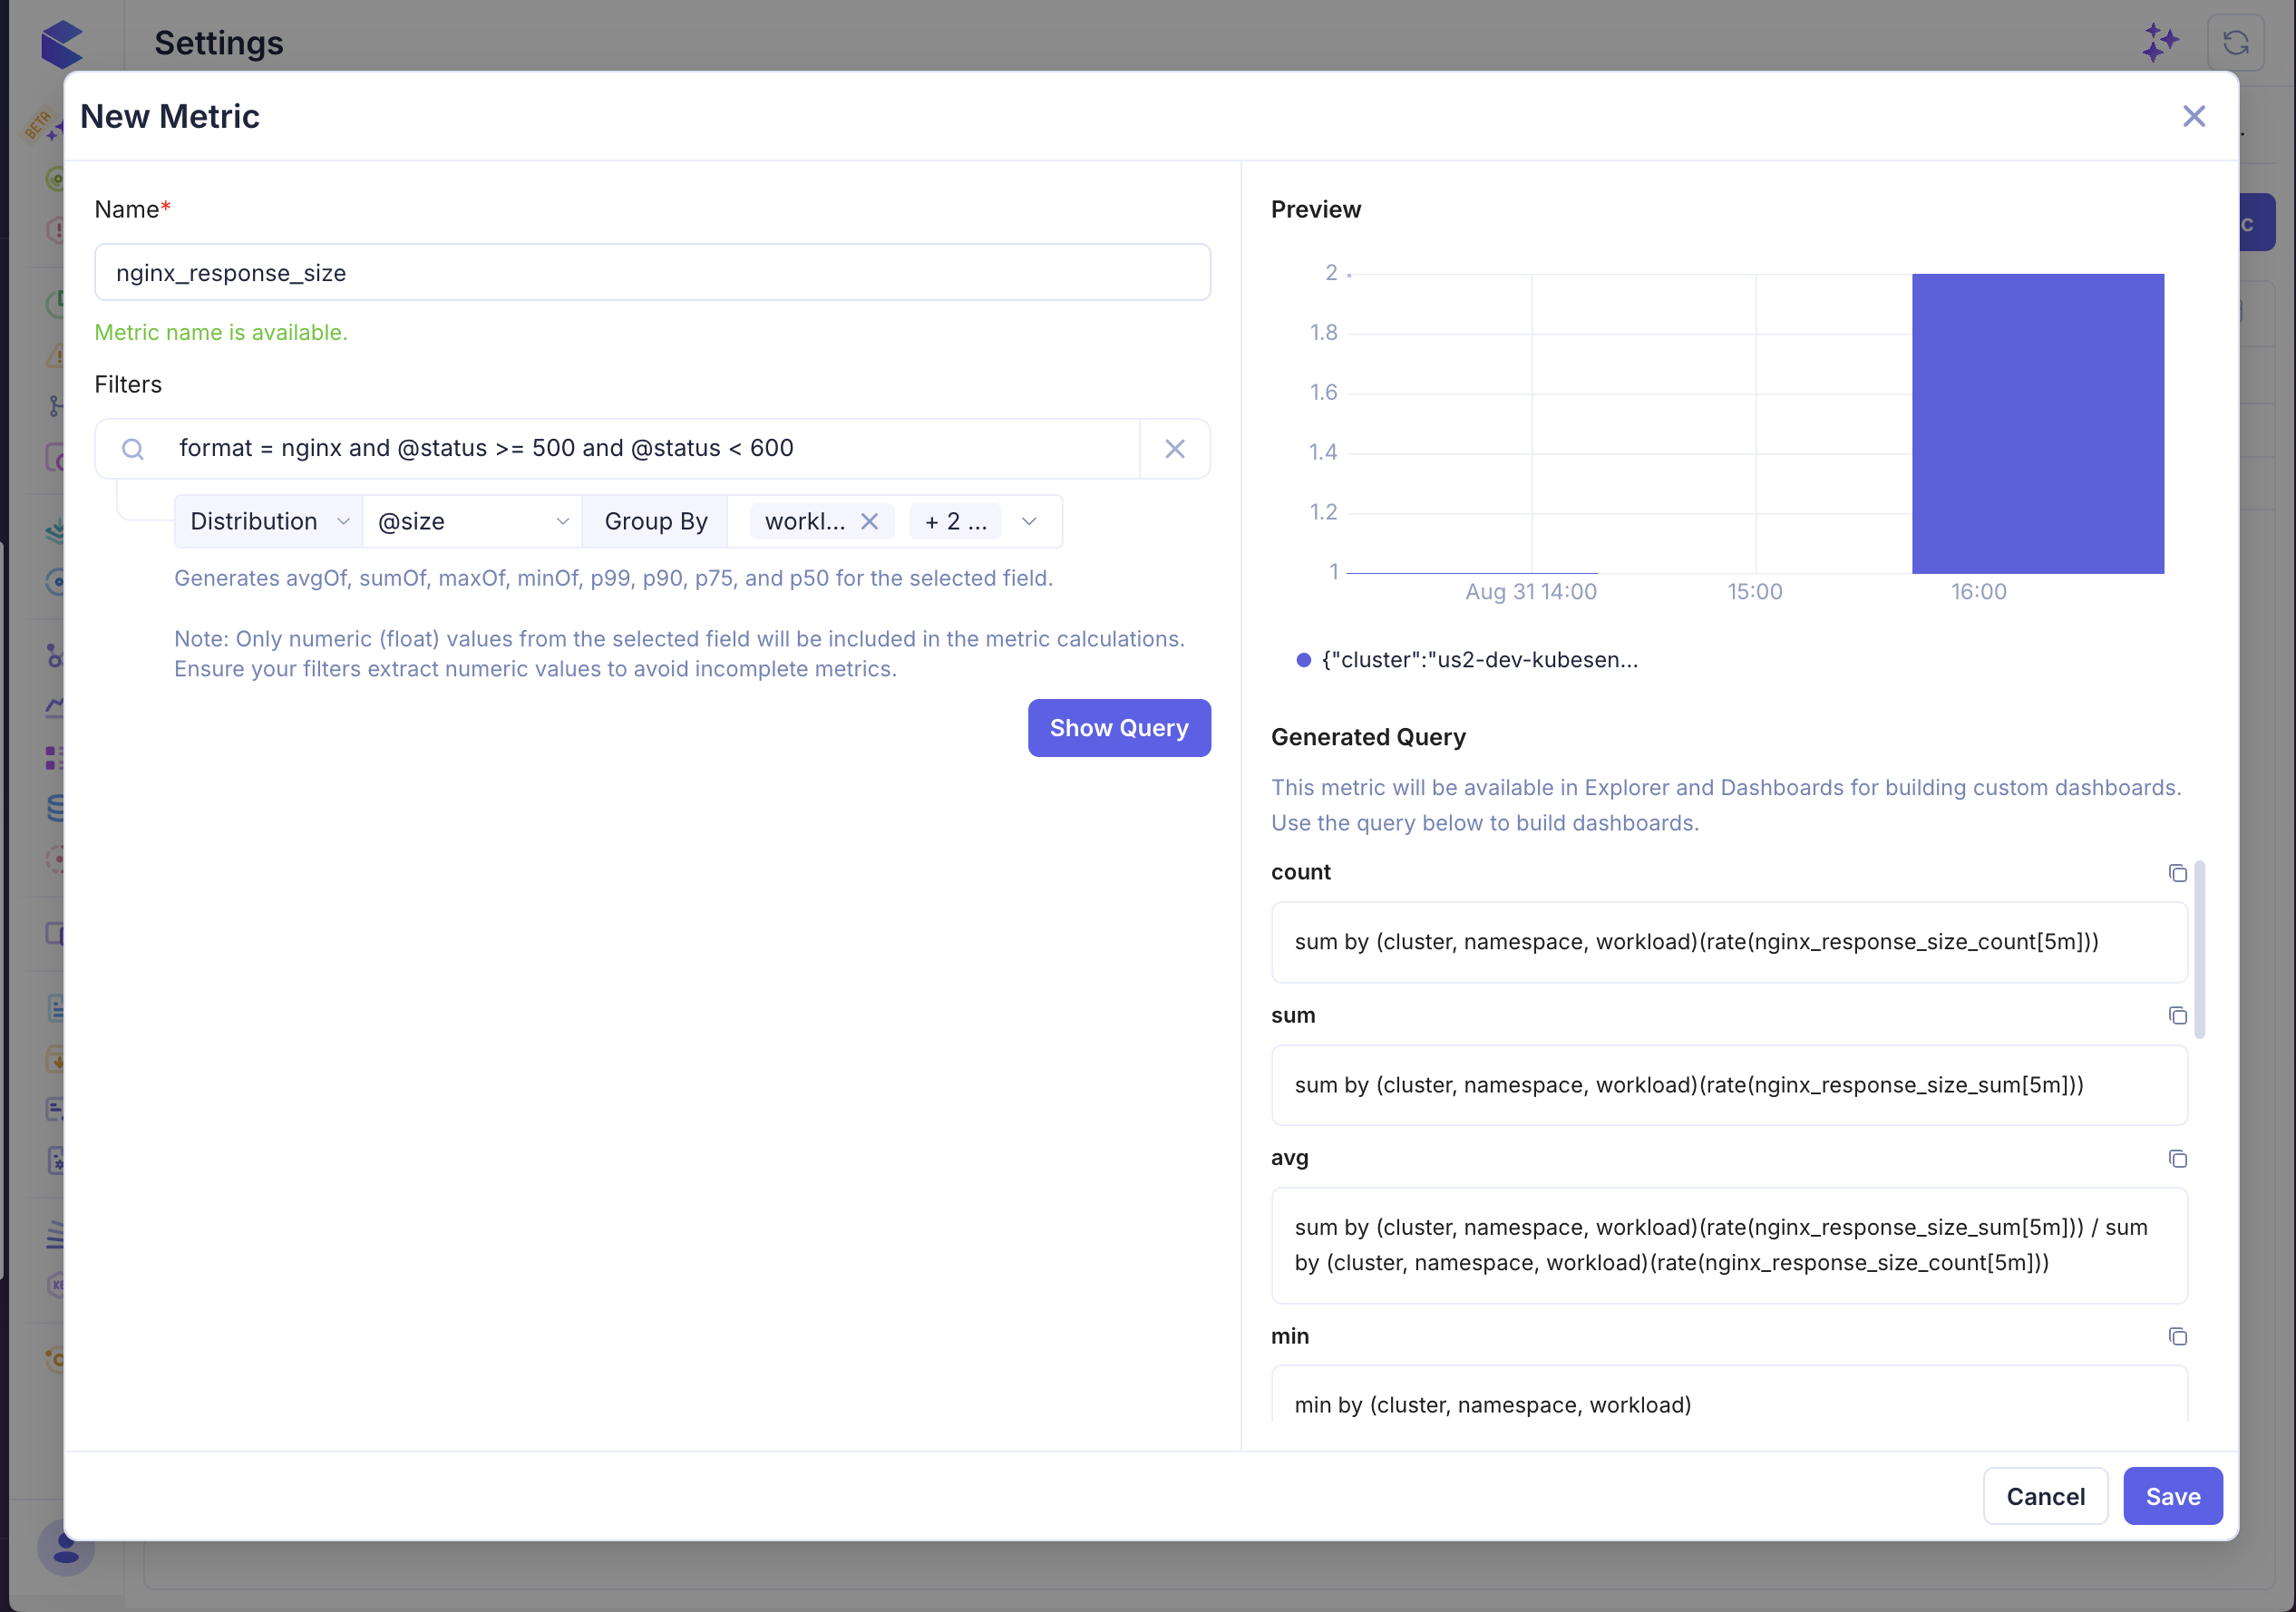
Choose Distribution when you want to measure a numeric value from matching logs, such as response size, request duration, or latency. Select the field that contains the numeric value, then optionally choose group-by fields to compare the distribution across workloads, namespaces, or other dimensions.
The generated metric can be used to view count, sum, average, minimum, maximum, and percentile values including p50, p75, p90, p95, and p99.
Only numeric values from the selected field are included. Make sure the selected field is extracted as a numeric value; otherwise, those log events are not included in the distribution calculations.
Group By
Use Group By to split one metric into separate time series. For example, grouping by cluster, namespace, and workload produces a separate count for every combination of those values.
Choose only the dimensions needed for your investigation or dashboard. Each additional group-by field can increase the number of time series created.
Find Unique Values
To see the values observed for a field, add that field to Group By and use Count. Each resulting series represents one observed field value and its log count over time.
For example, create a count metric named login_events and group it by user_id, workload, namespace, and cluster. Use the following query to count the user IDs observed in each workload, namespace, and cluster during the last five minutes:
count(max_over_time(login_events[5m])) by (workload, namespace, cluster)Keep the unique field (user_id in this example) in the metric's Group By selection, but omit it from the final query grouping so the result is its count. Replace the metric name, retained dimensions, and five-minute window to fit your use case.
Preview
The preview chart shows the historical volume of logs matching the current filters and group-by selection. Use it to confirm that the metric captures the expected events before saving it.
Adjust the filters or group-by fields when the preview is too broad, has no matching logs, or creates more series than expected.
Show Query
Select Show Query to display the generated query for the metric. You can use this query in Explorer and Dashboards to build custom visualizations.
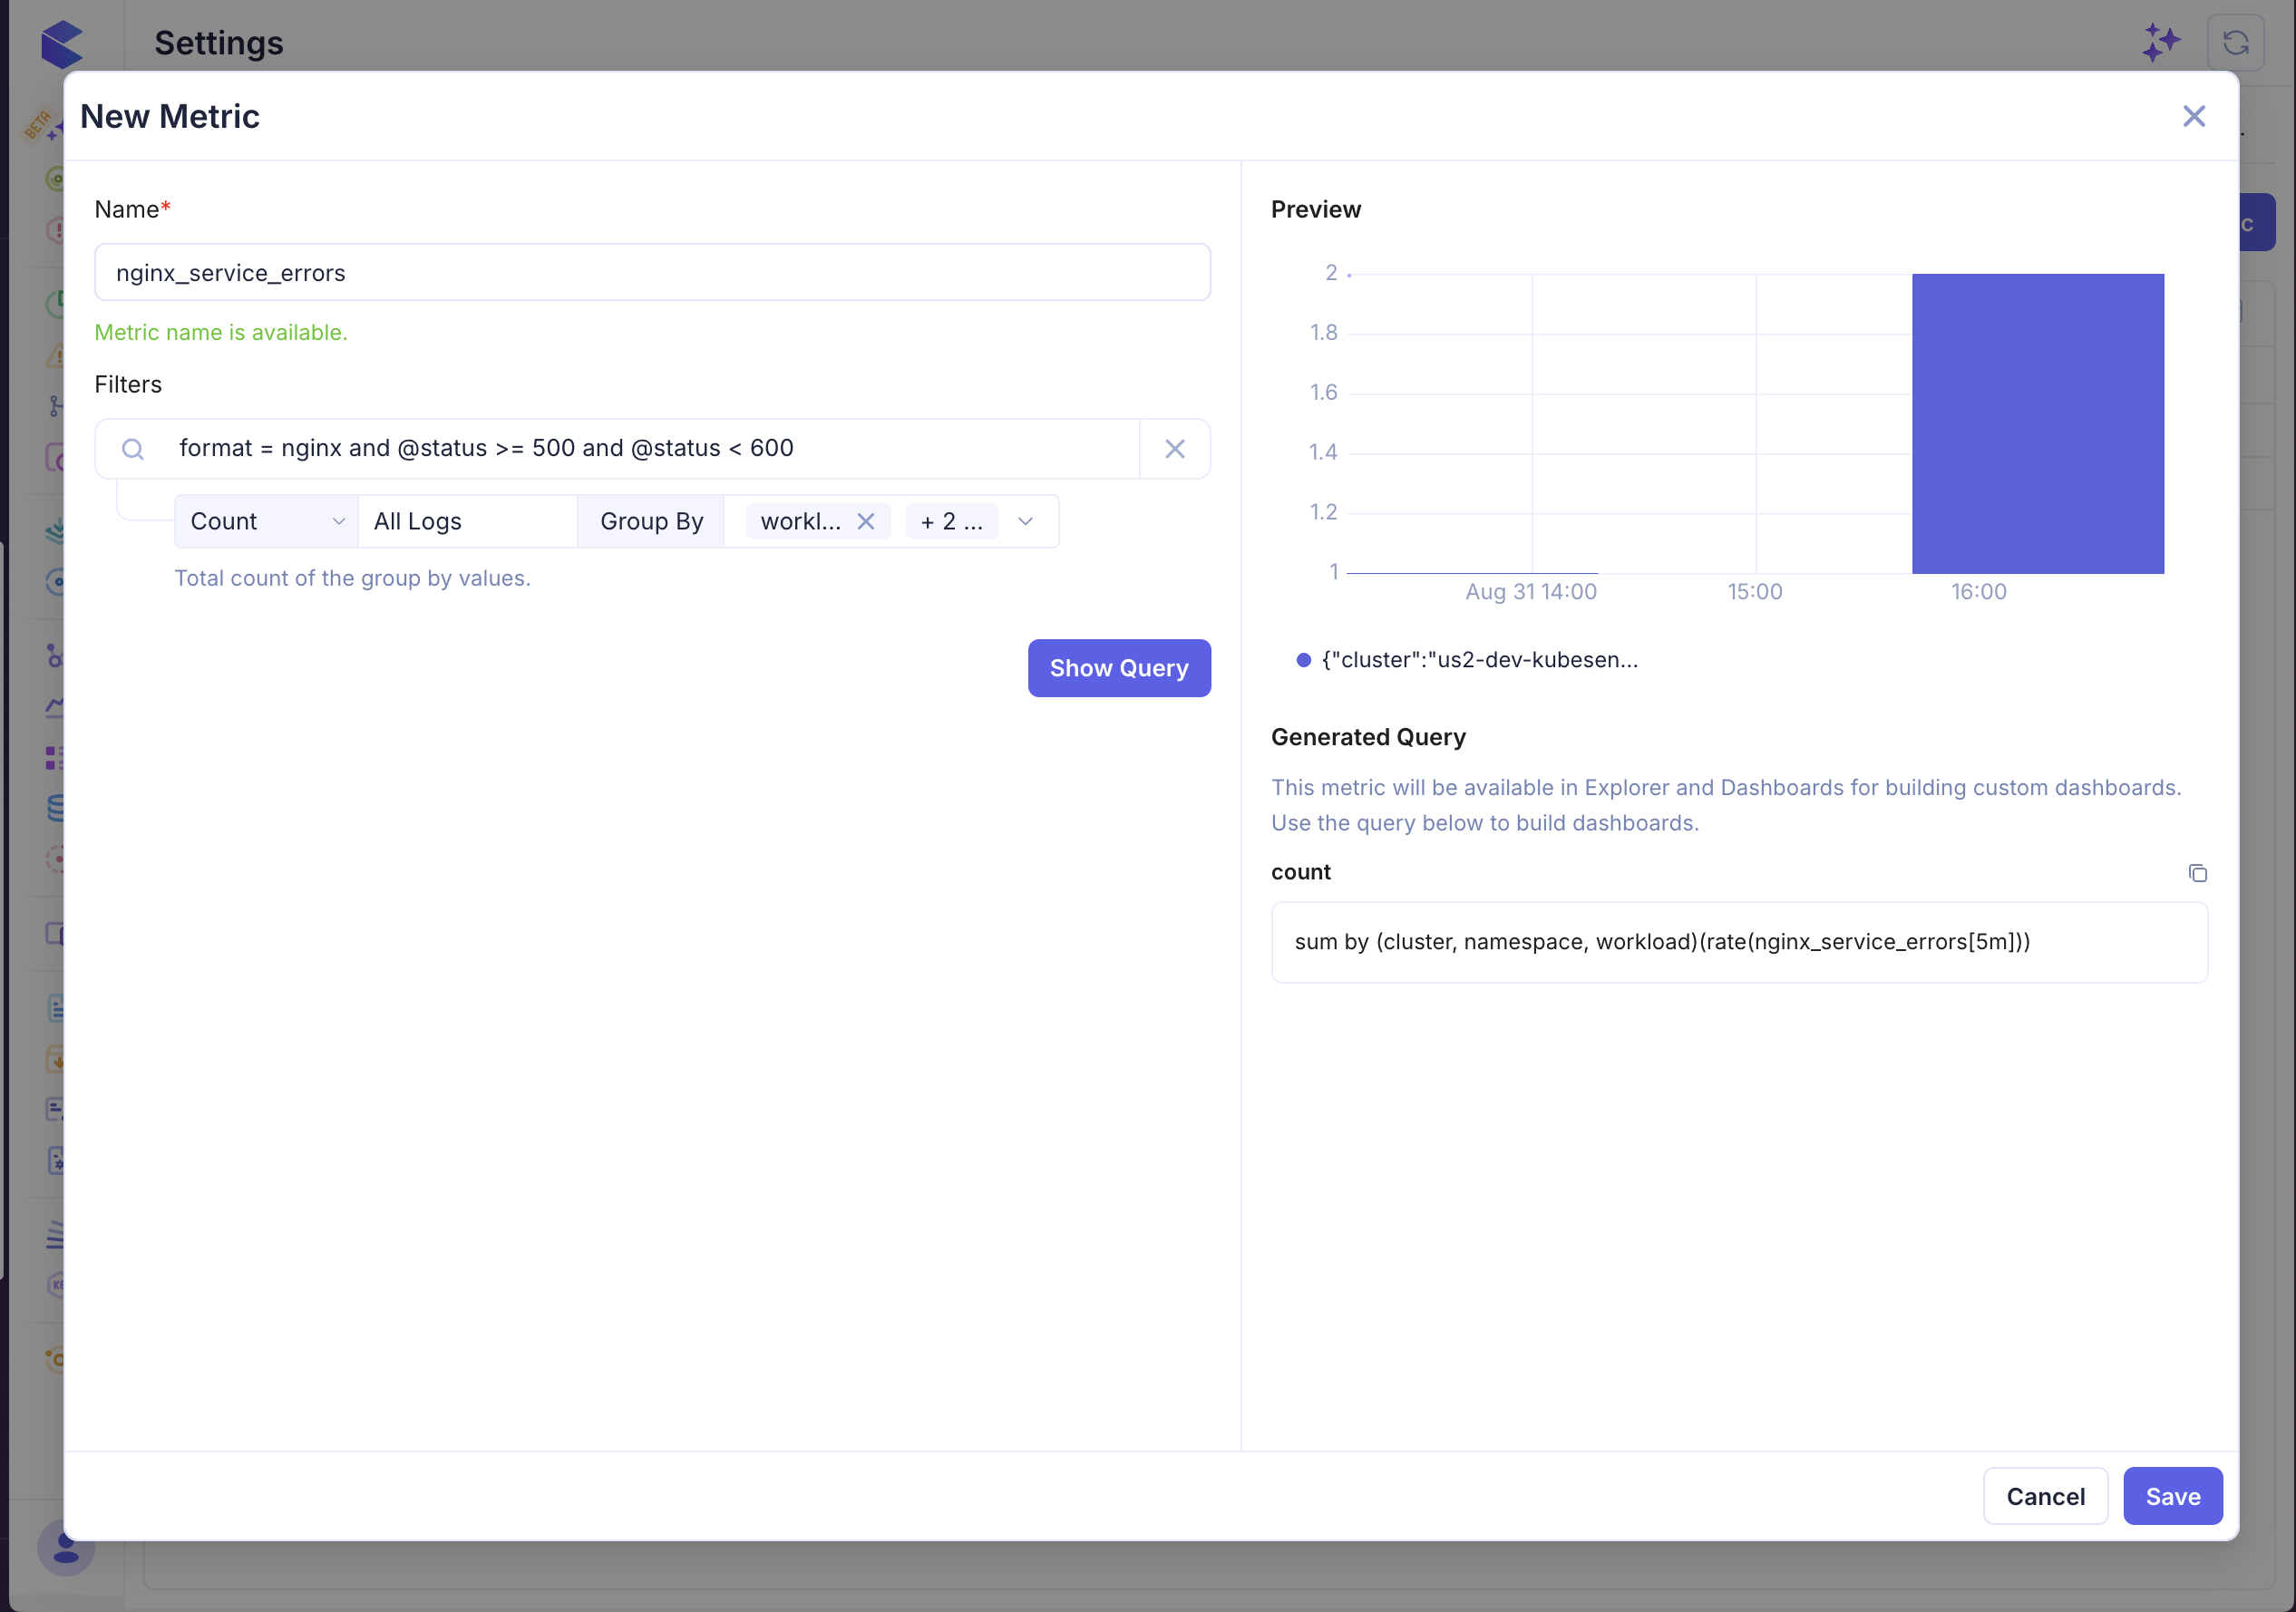
After reviewing the preview and generated query, select Save. The metric then becomes available for use in Explorer and Dashboards.