Log Detail View
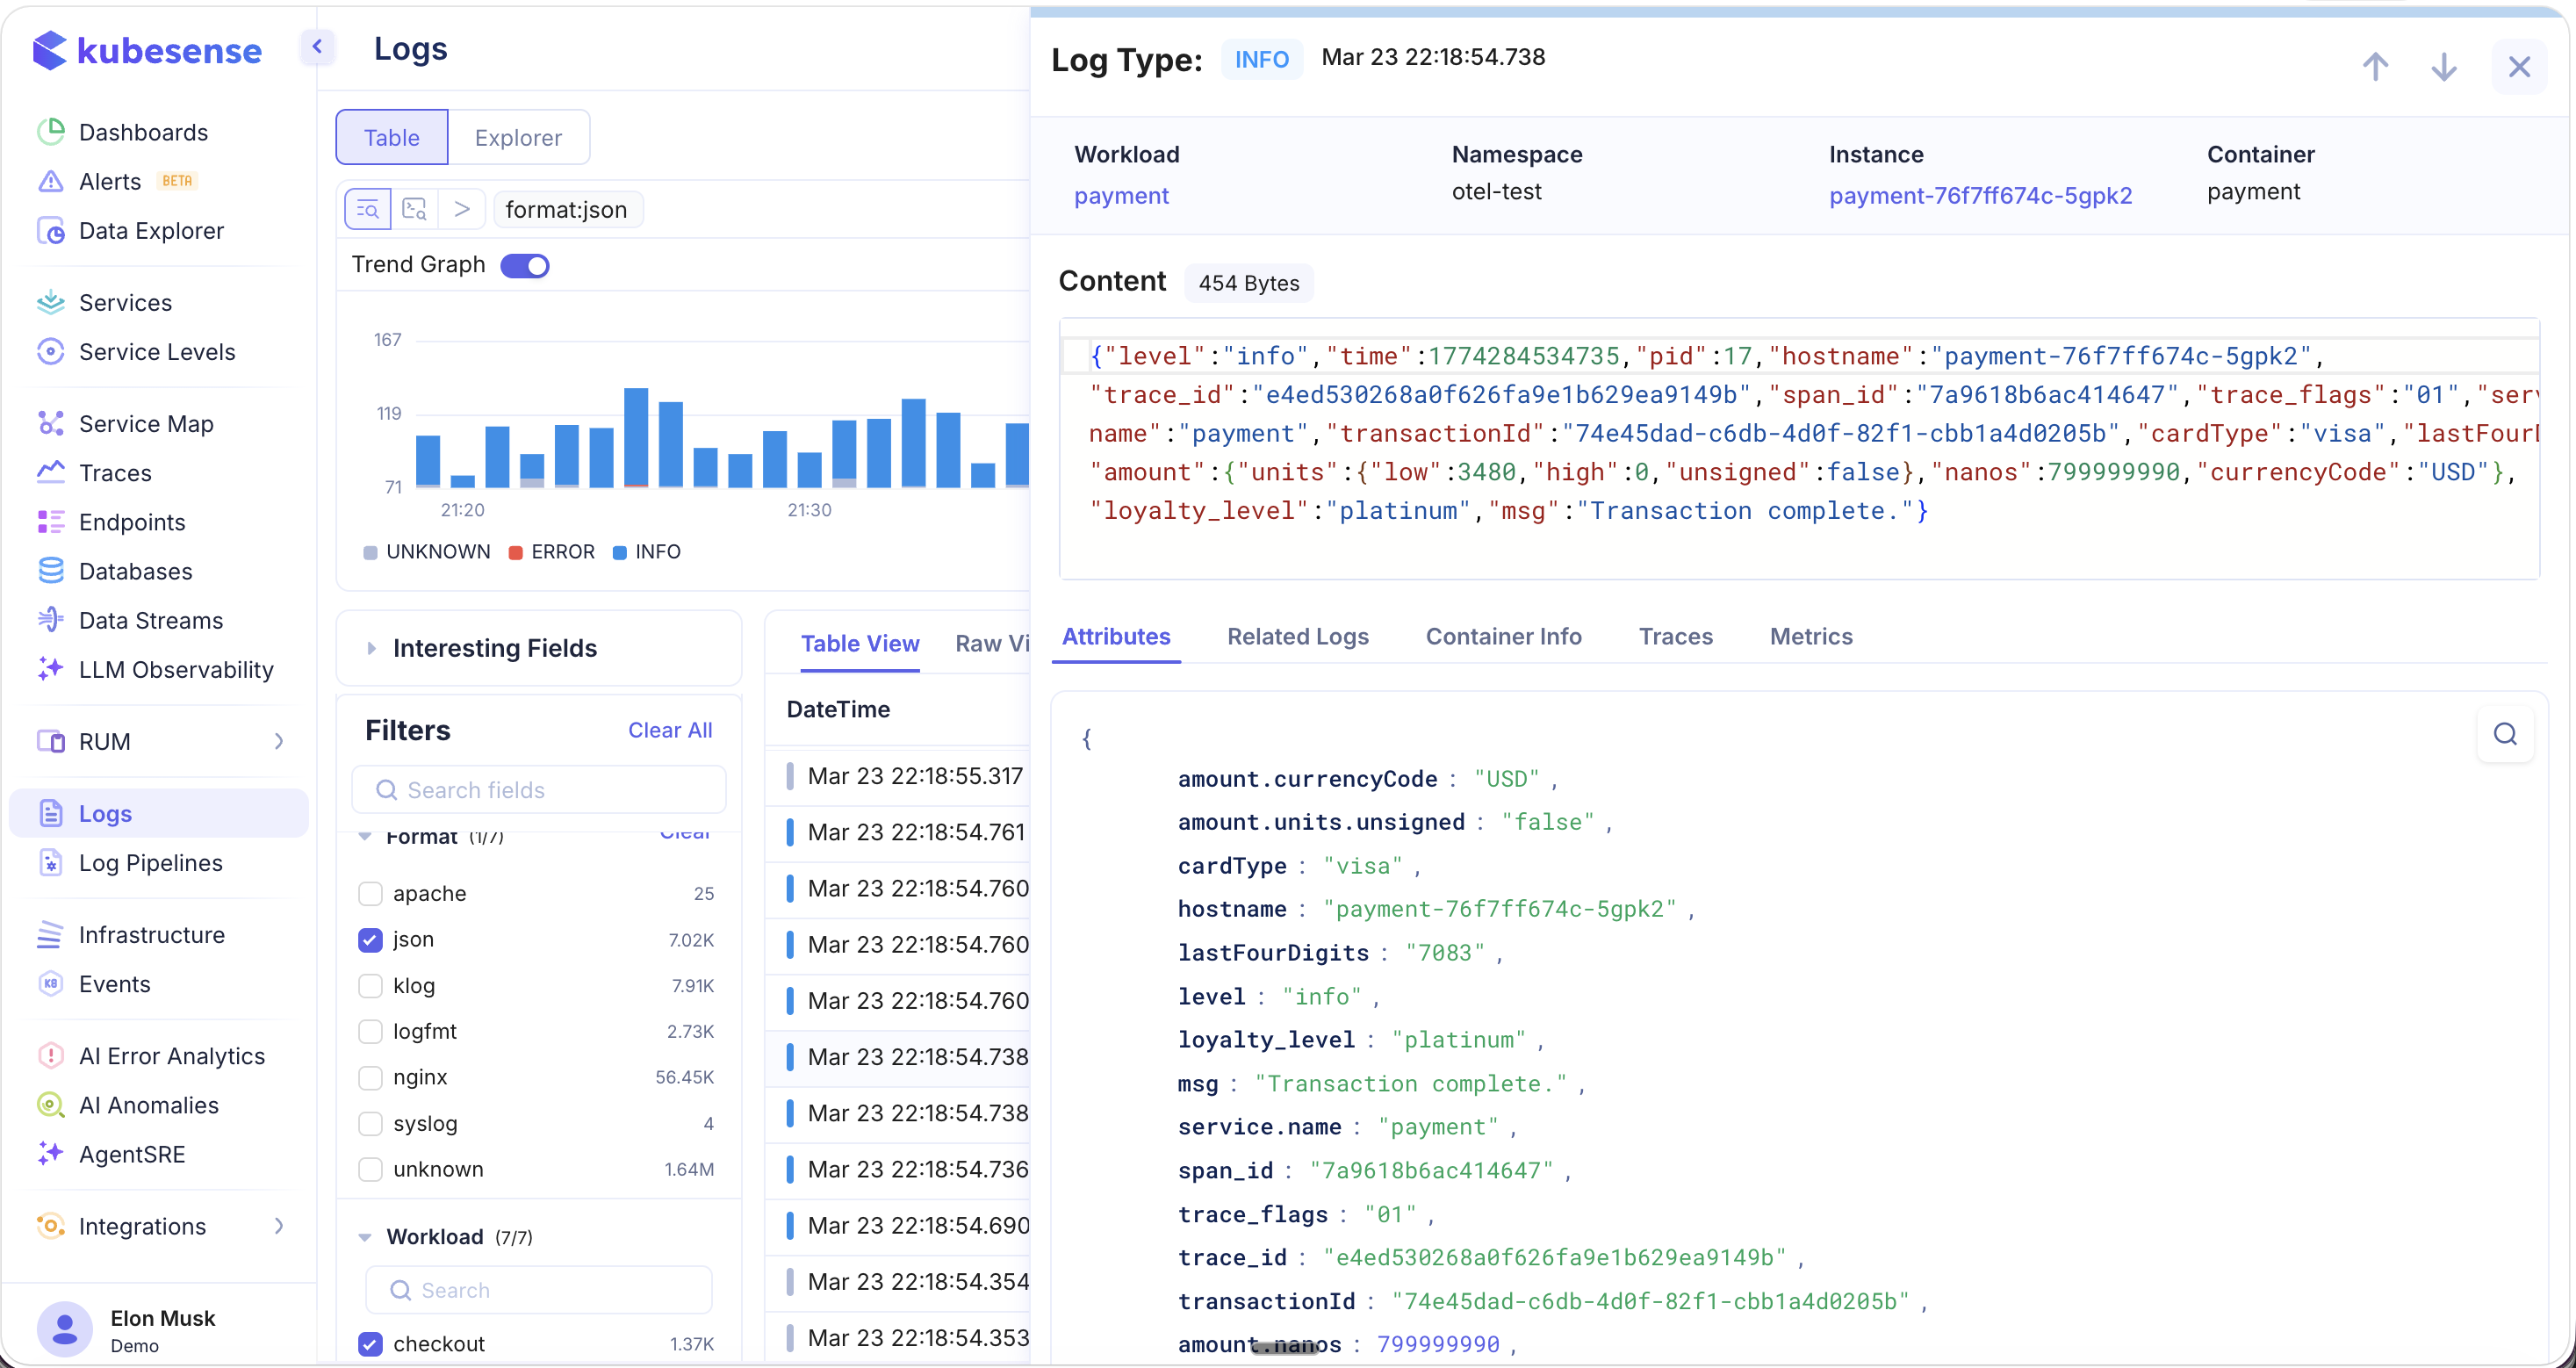
Click on any log entry in the table to open the Log Detail View — a comprehensive side panel that provides deep context for the selected log line. The detail view includes a header section showing the log type, timestamp, workload, namespace, instance, and container. Below the header, the raw log content is displayed with syntax highlighting for structured formats like JSON.
The detail view is organized into five tabs:
Attributes
The Attributes tab displays all parsed key-value pairs extracted from the log entry. For structured logs (JSON, logfmt, etc.), KubeSense automatically parses every field and presents them in a clean, readable format. This includes nested attributes — for example, amount.currencyCode, request.creditCard.creditCardNumber, or amount.units.low.
Attribute Context Menu
Right-click on any attribute value to access a powerful context menu with quick actions:
| Action | Description |
|---|---|
| Copy value | Copy the attribute value to clipboard |
| Copy key | Copy the attribute key name |
| Copy key:value | Copy the full key-value pair |
| Filter by | Add this attribute as a filter (e.g., Filter by span_id: "7a9618b6ac414647") |
| Exclude by | Exclude logs matching this attribute value |
| Group by | Group log results by this attribute |
| View in Data Explorer | Open this attribute in the Data Explorer for visualization and dashboard creation |
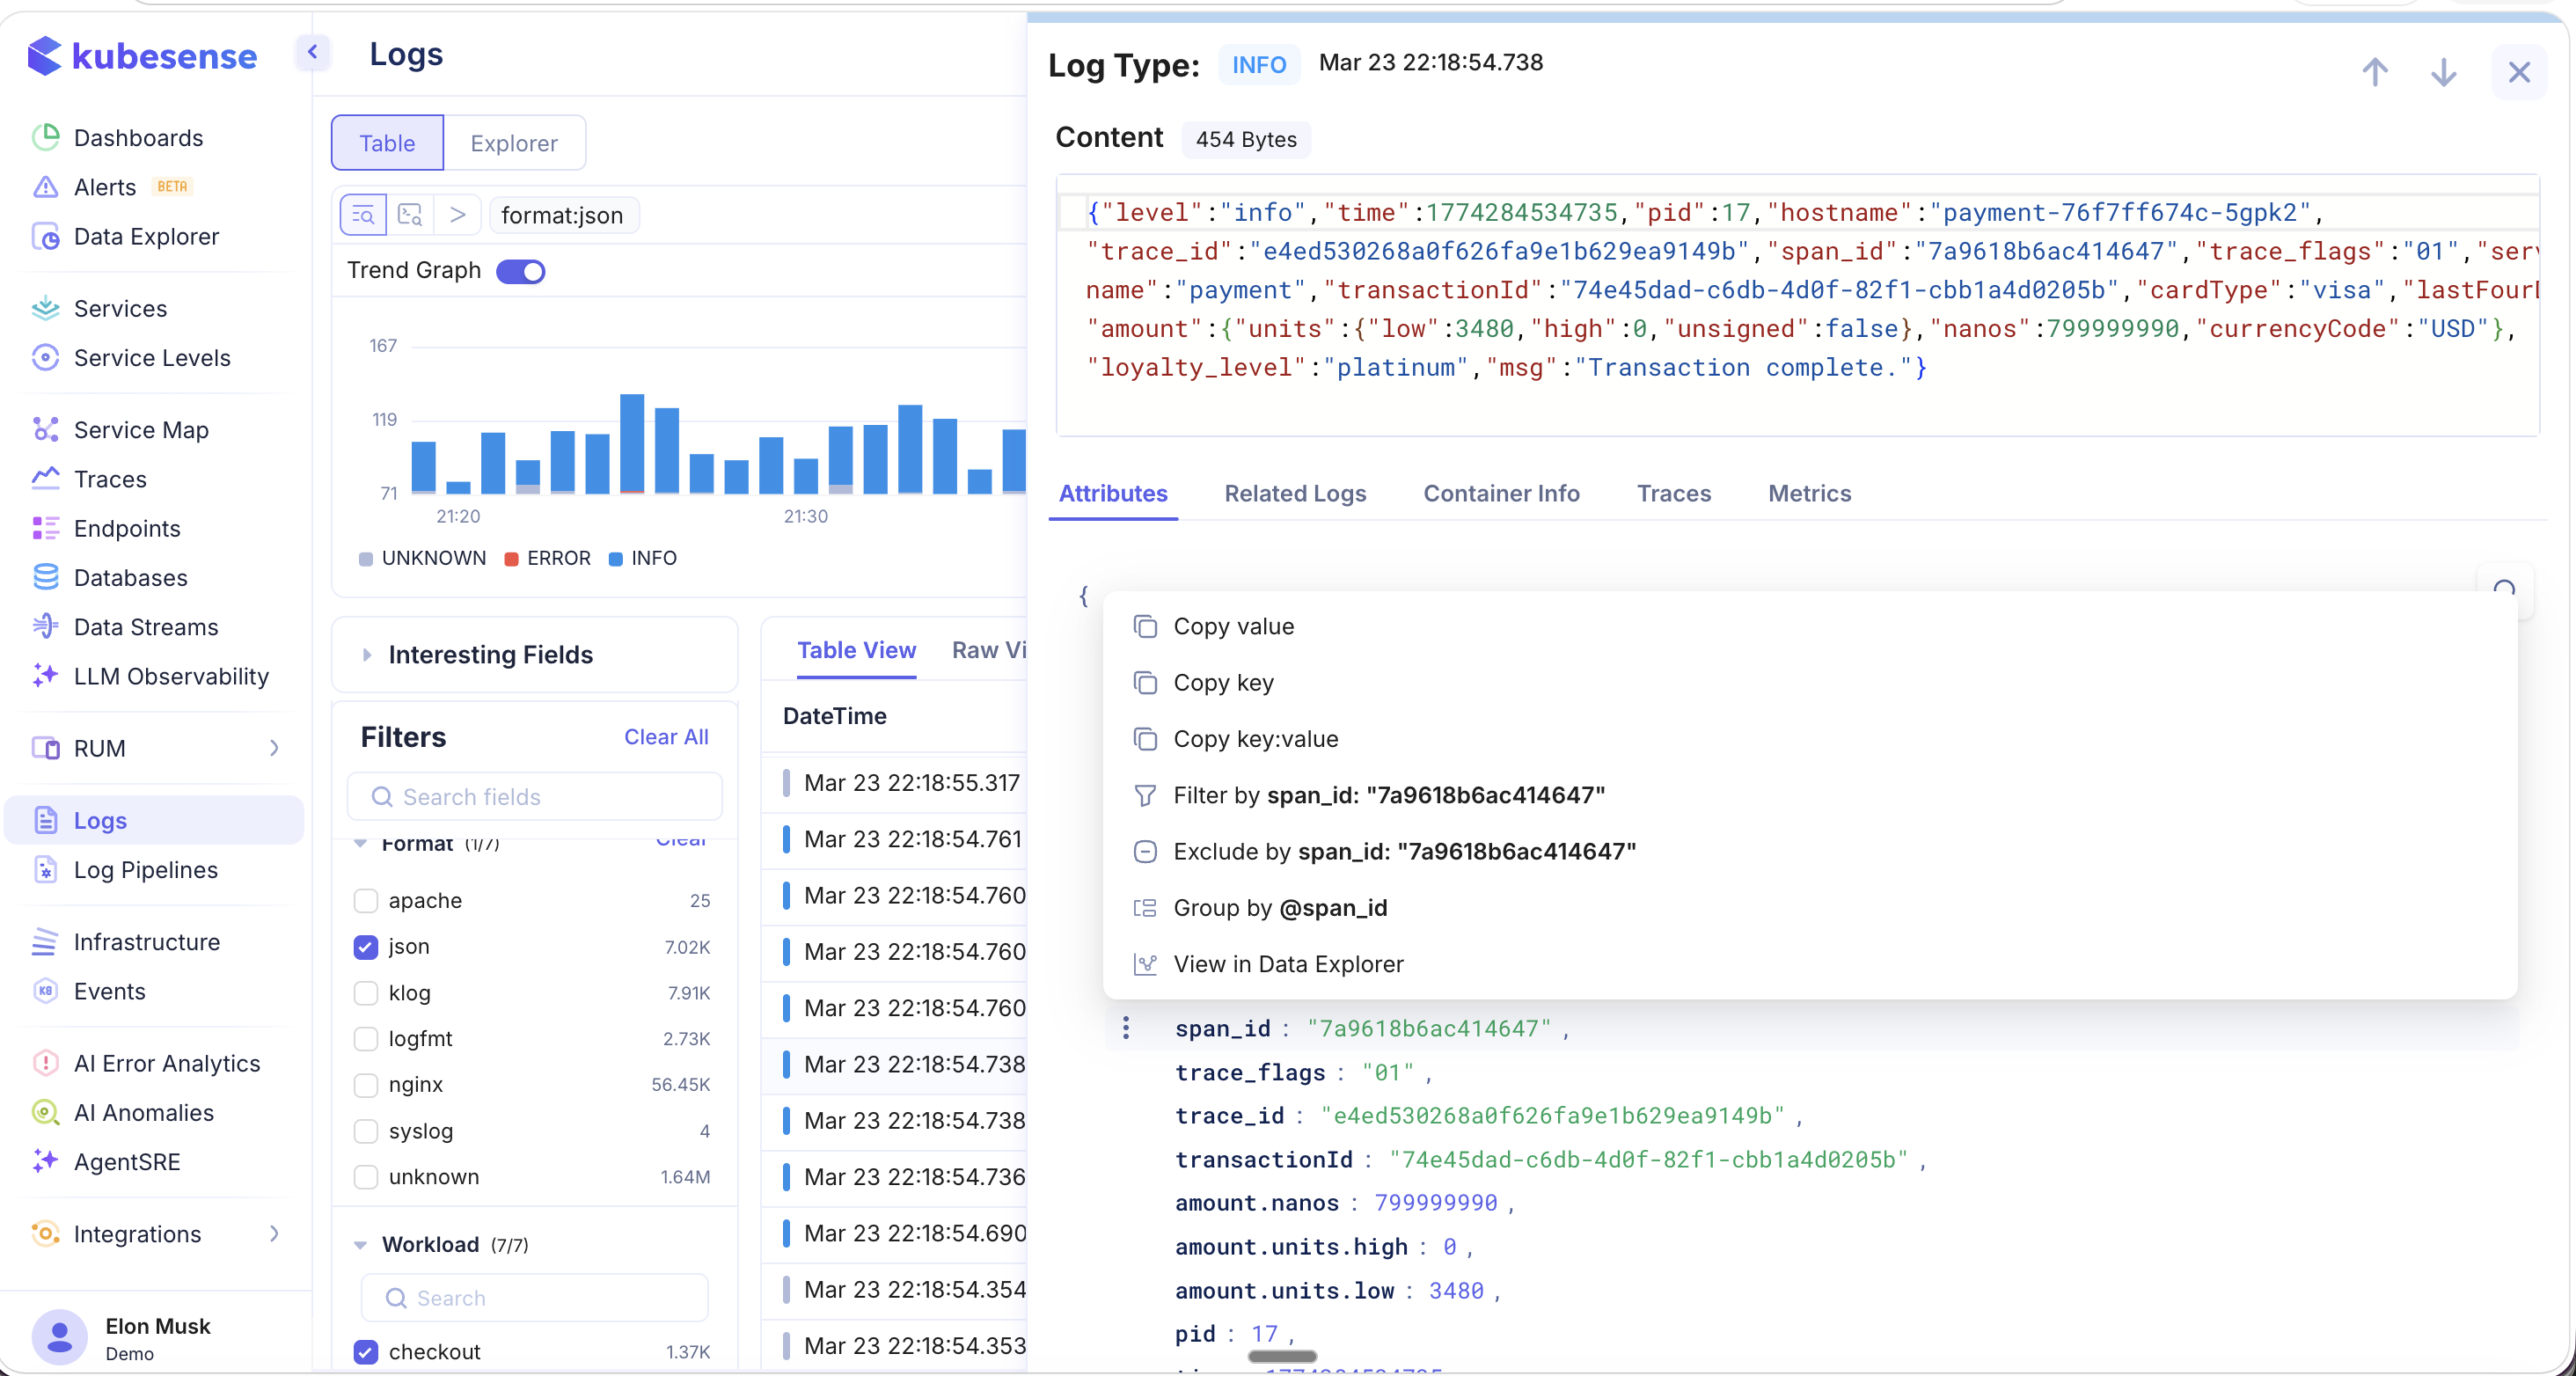
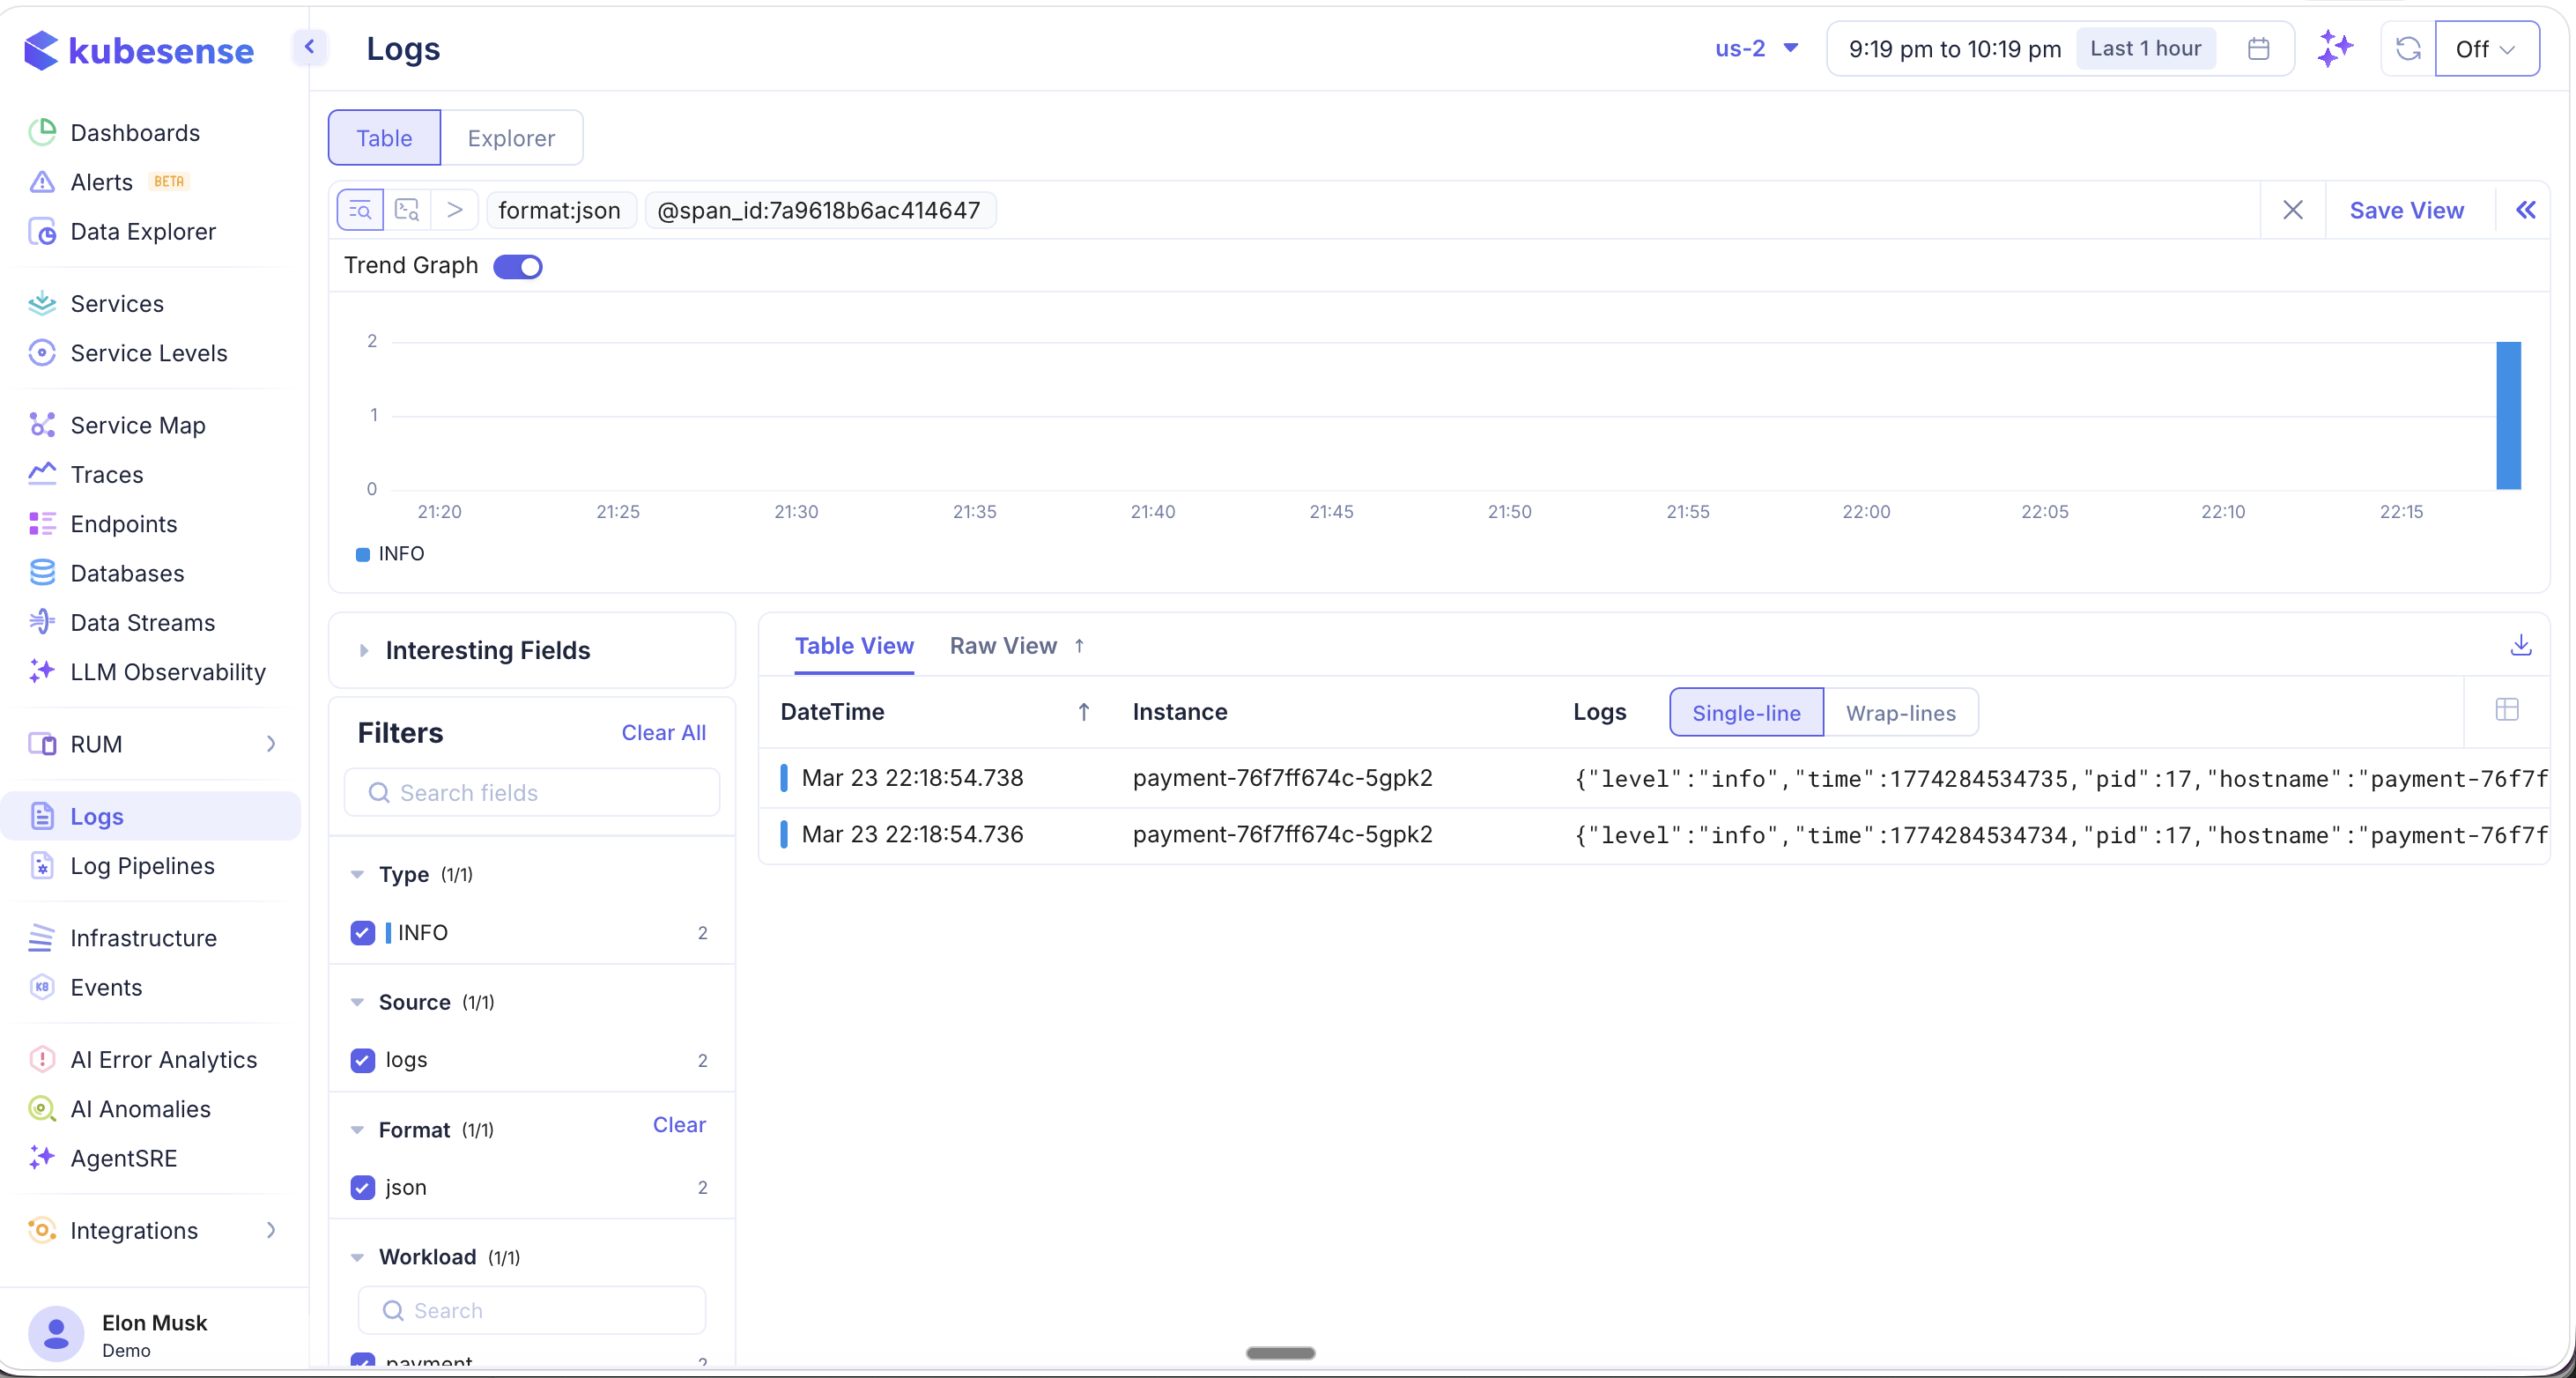
Clicking Filter by on an attribute value immediately applies the filter and updates the log table to show only matching entries.
Related Logs
The Related Logs tab shows log entries that were emitted around the same time from the same instance. This provides crucial context for understanding what happened immediately before and after a specific log event.
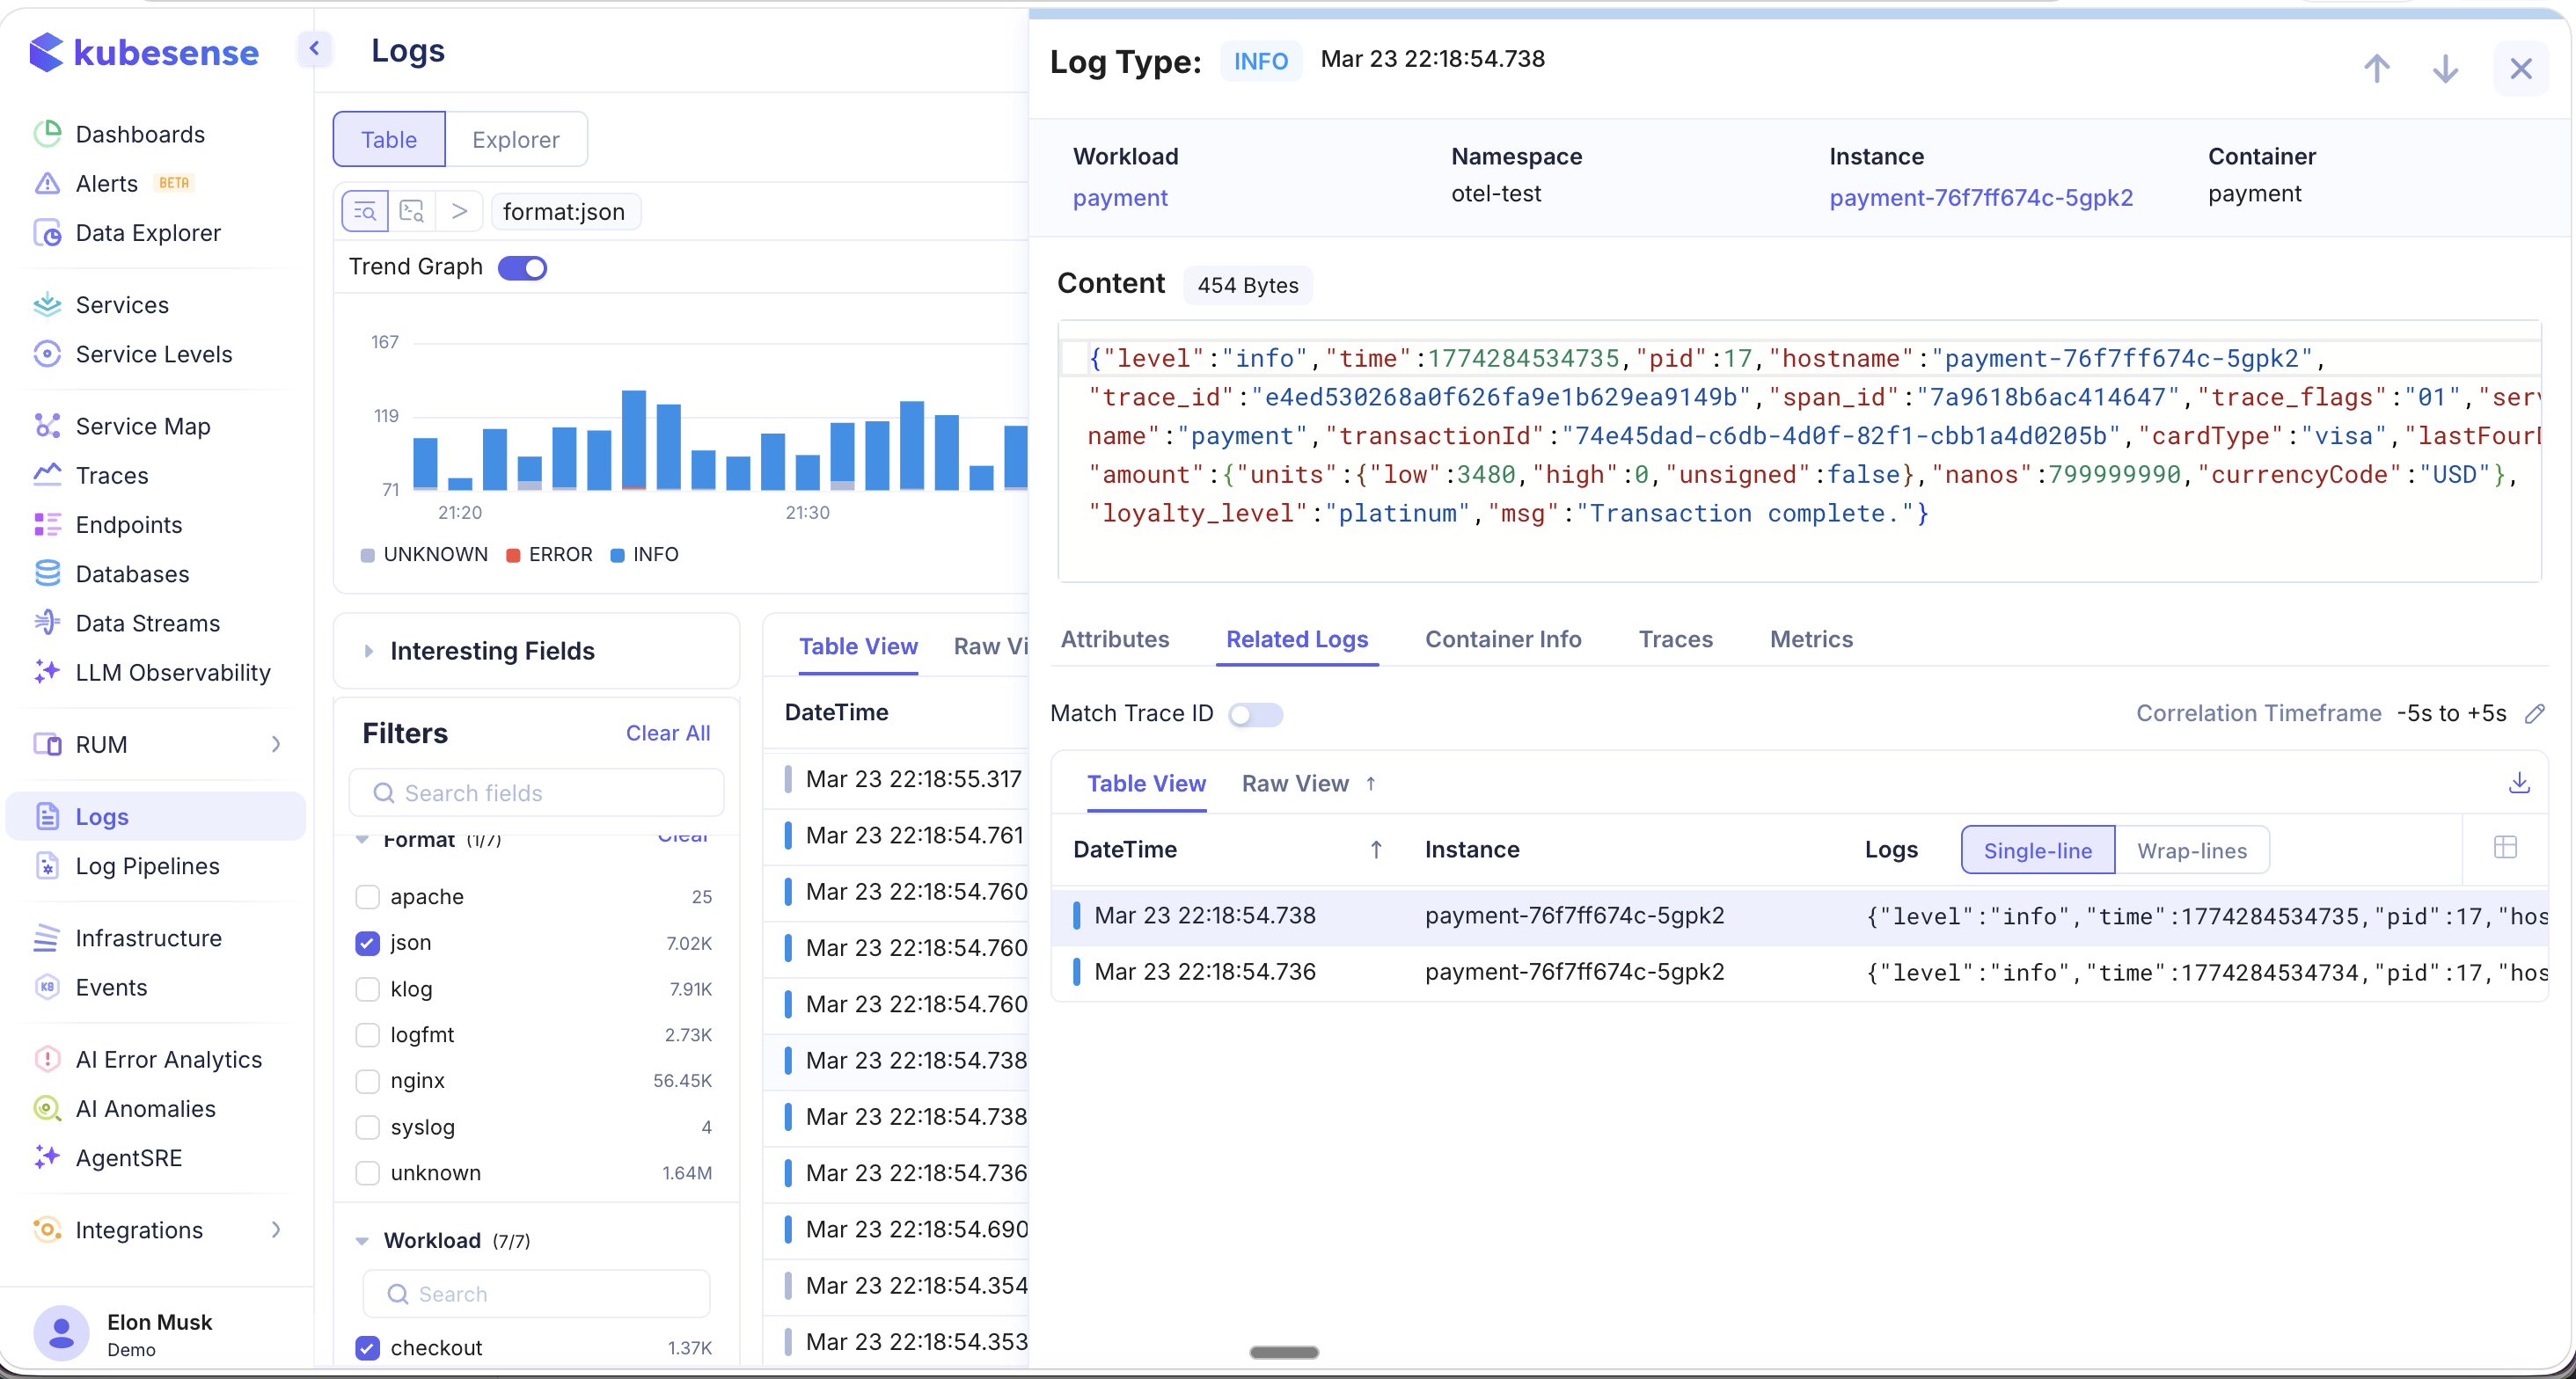
Key features of the Related Logs tab:
- Correlation Timeframe — Configurable window (e.g., -5s to +5s) that controls how far before and after the selected log entry to search for related logs. Click the edit icon to adjust the timeframe.
- Match Trace ID — Toggle this option to correlate related logs by their trace ID instead of by time, surfacing all log entries that belong to the same distributed trace.
- Table View / Raw View — Related logs support the same view mode toggles as the main log table.
Container Info
The Container Info tab displays metadata about the container that emitted the log, including resource specifications, environment details, and runtime information.
Traces
The Traces tab surfaces distributed traces that are correlated with the selected log entry. KubeSense automatically correlates logs and traces using span IDs, trace IDs, and time-based proximity.
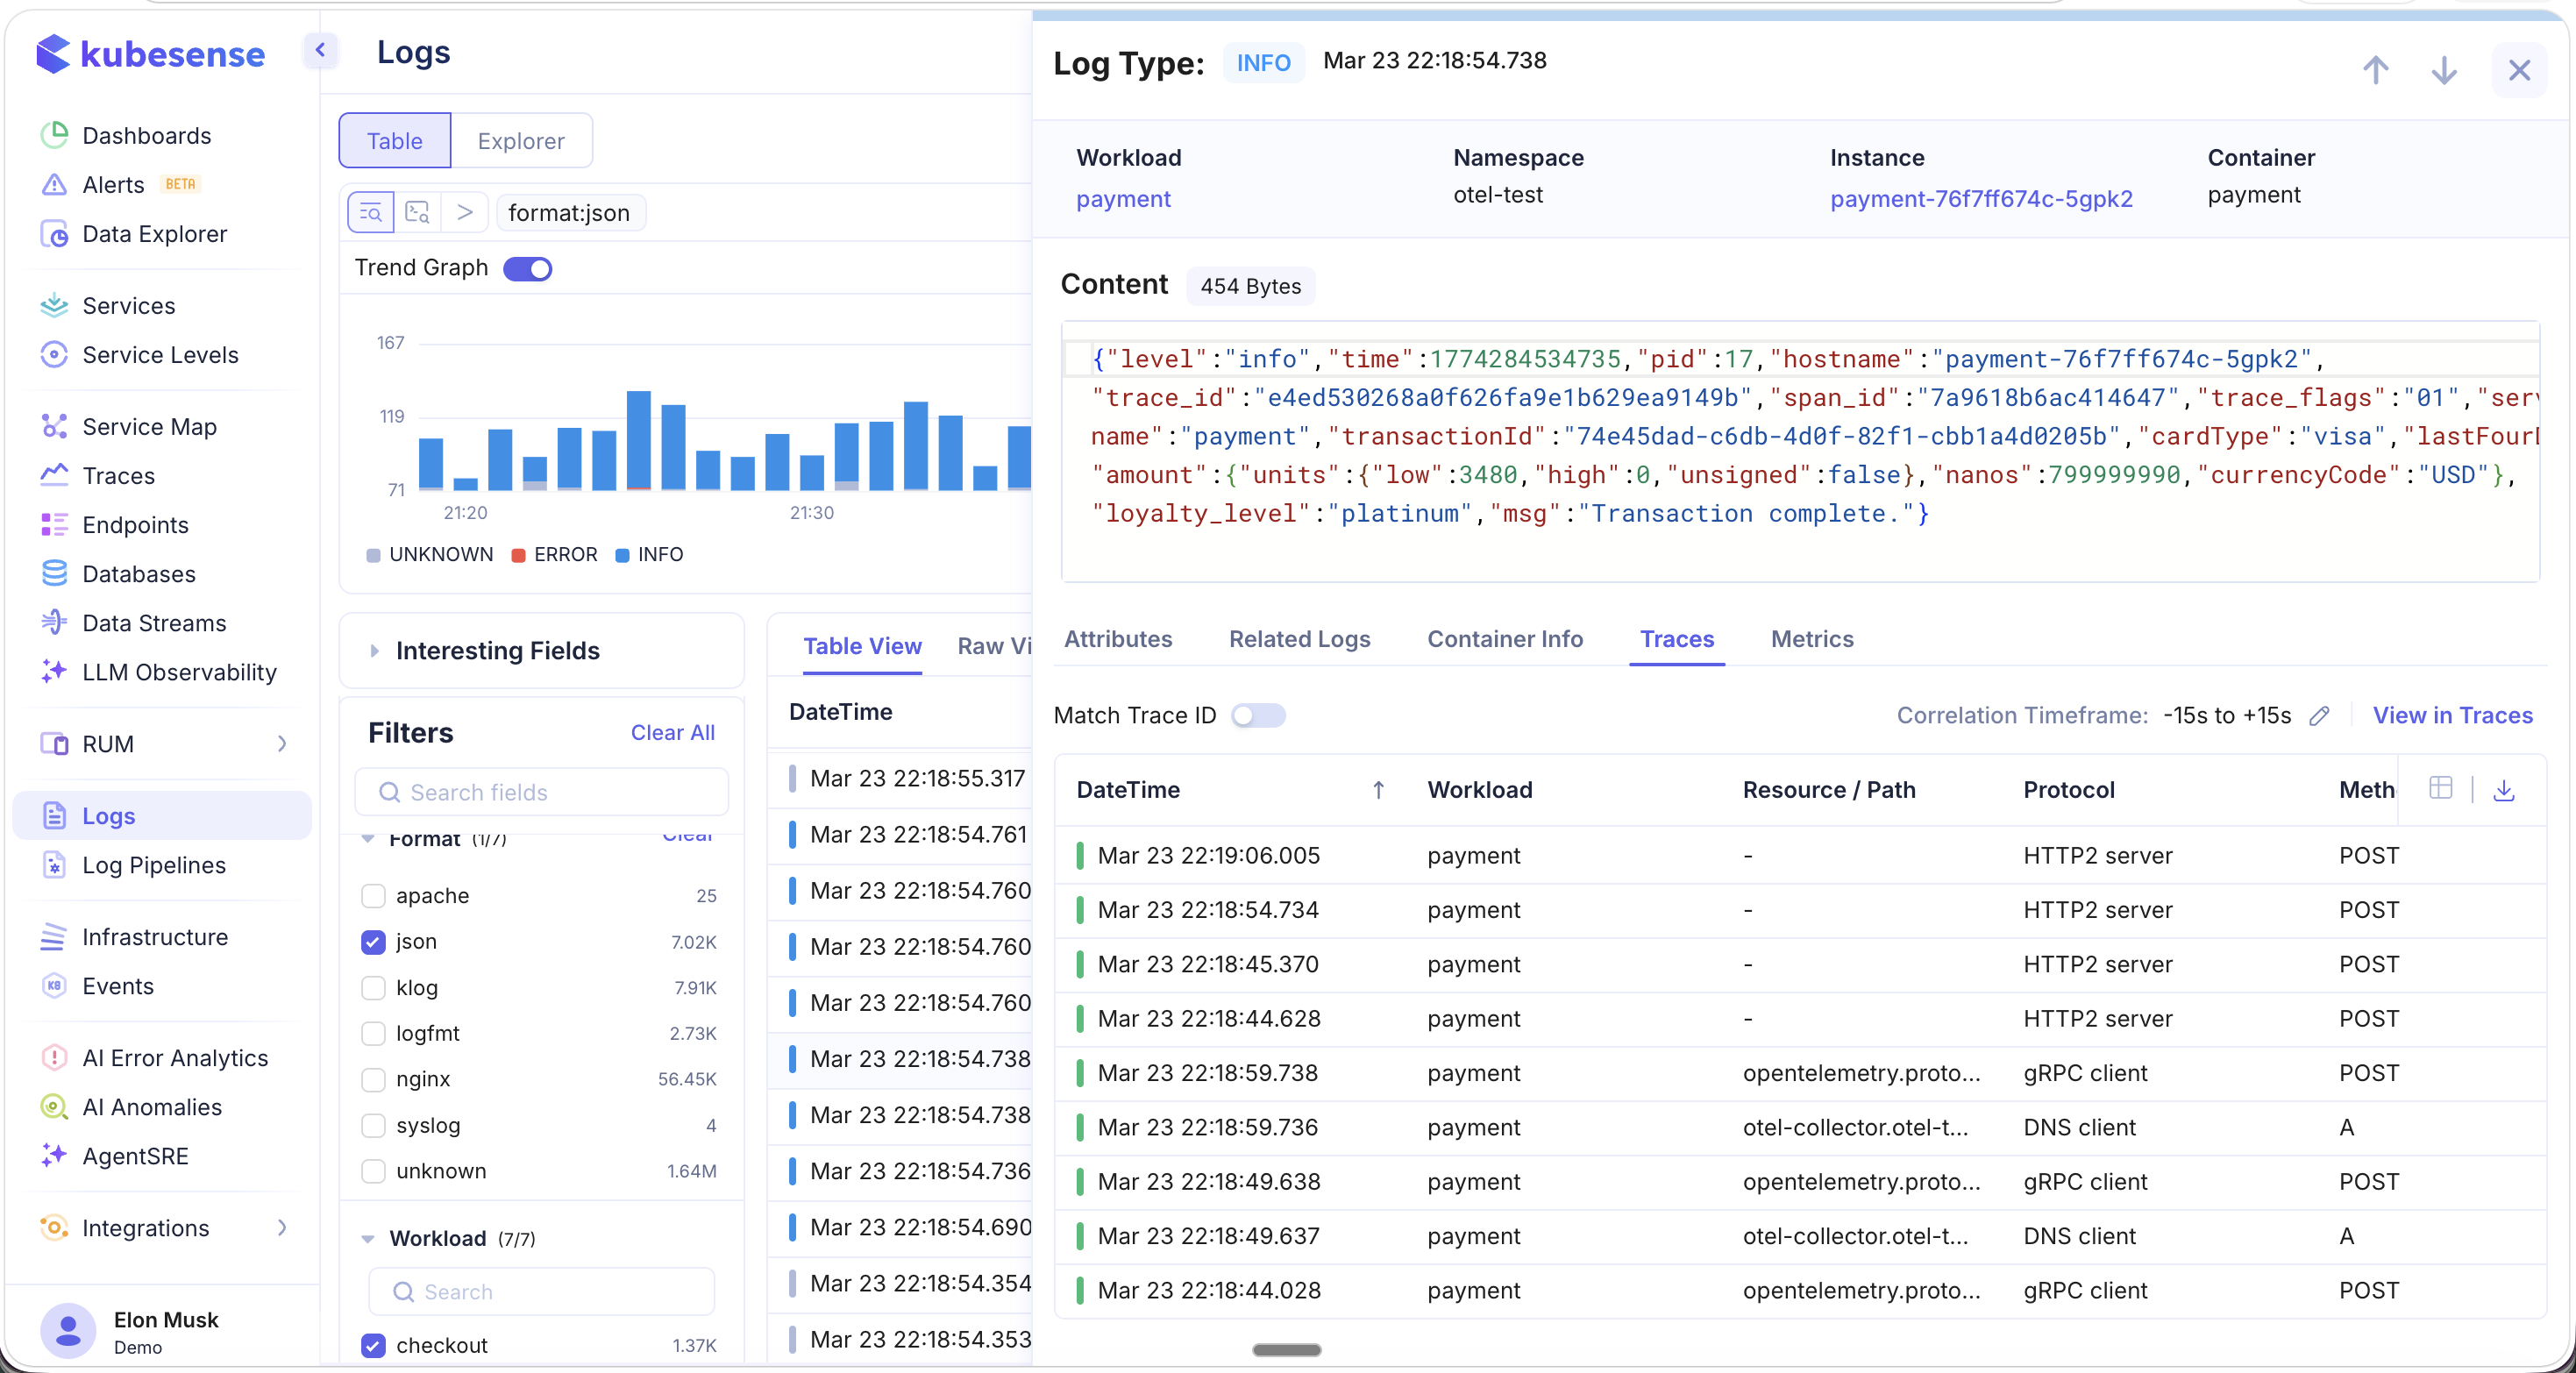
The traces panel displays:
| Column | Description |
|---|---|
| DateTime | Timestamp of the trace span |
| Workload | The service that emitted the trace |
| Resource / Path | The API endpoint or resource path |
| Protocol | The protocol used (HTTP2 server, gRPC client, DNS client, etc.) |
| Method | The HTTP method or operation type |
Key features:
- Correlation Timeframe — Adjustable window (e.g., -15s to +15s) for finding traces near the log timestamp
- Match Trace ID — Toggle to correlate by exact trace ID for precise distributed trace matching
- View in Traces — Click to jump directly to the full trace view in the Traces Explorer for waterfall analysis
Metrics
The Metrics tab provides a real-time snapshot of the infrastructure health at the moment the log was emitted. This is invaluable for correlating application errors with resource constraints.
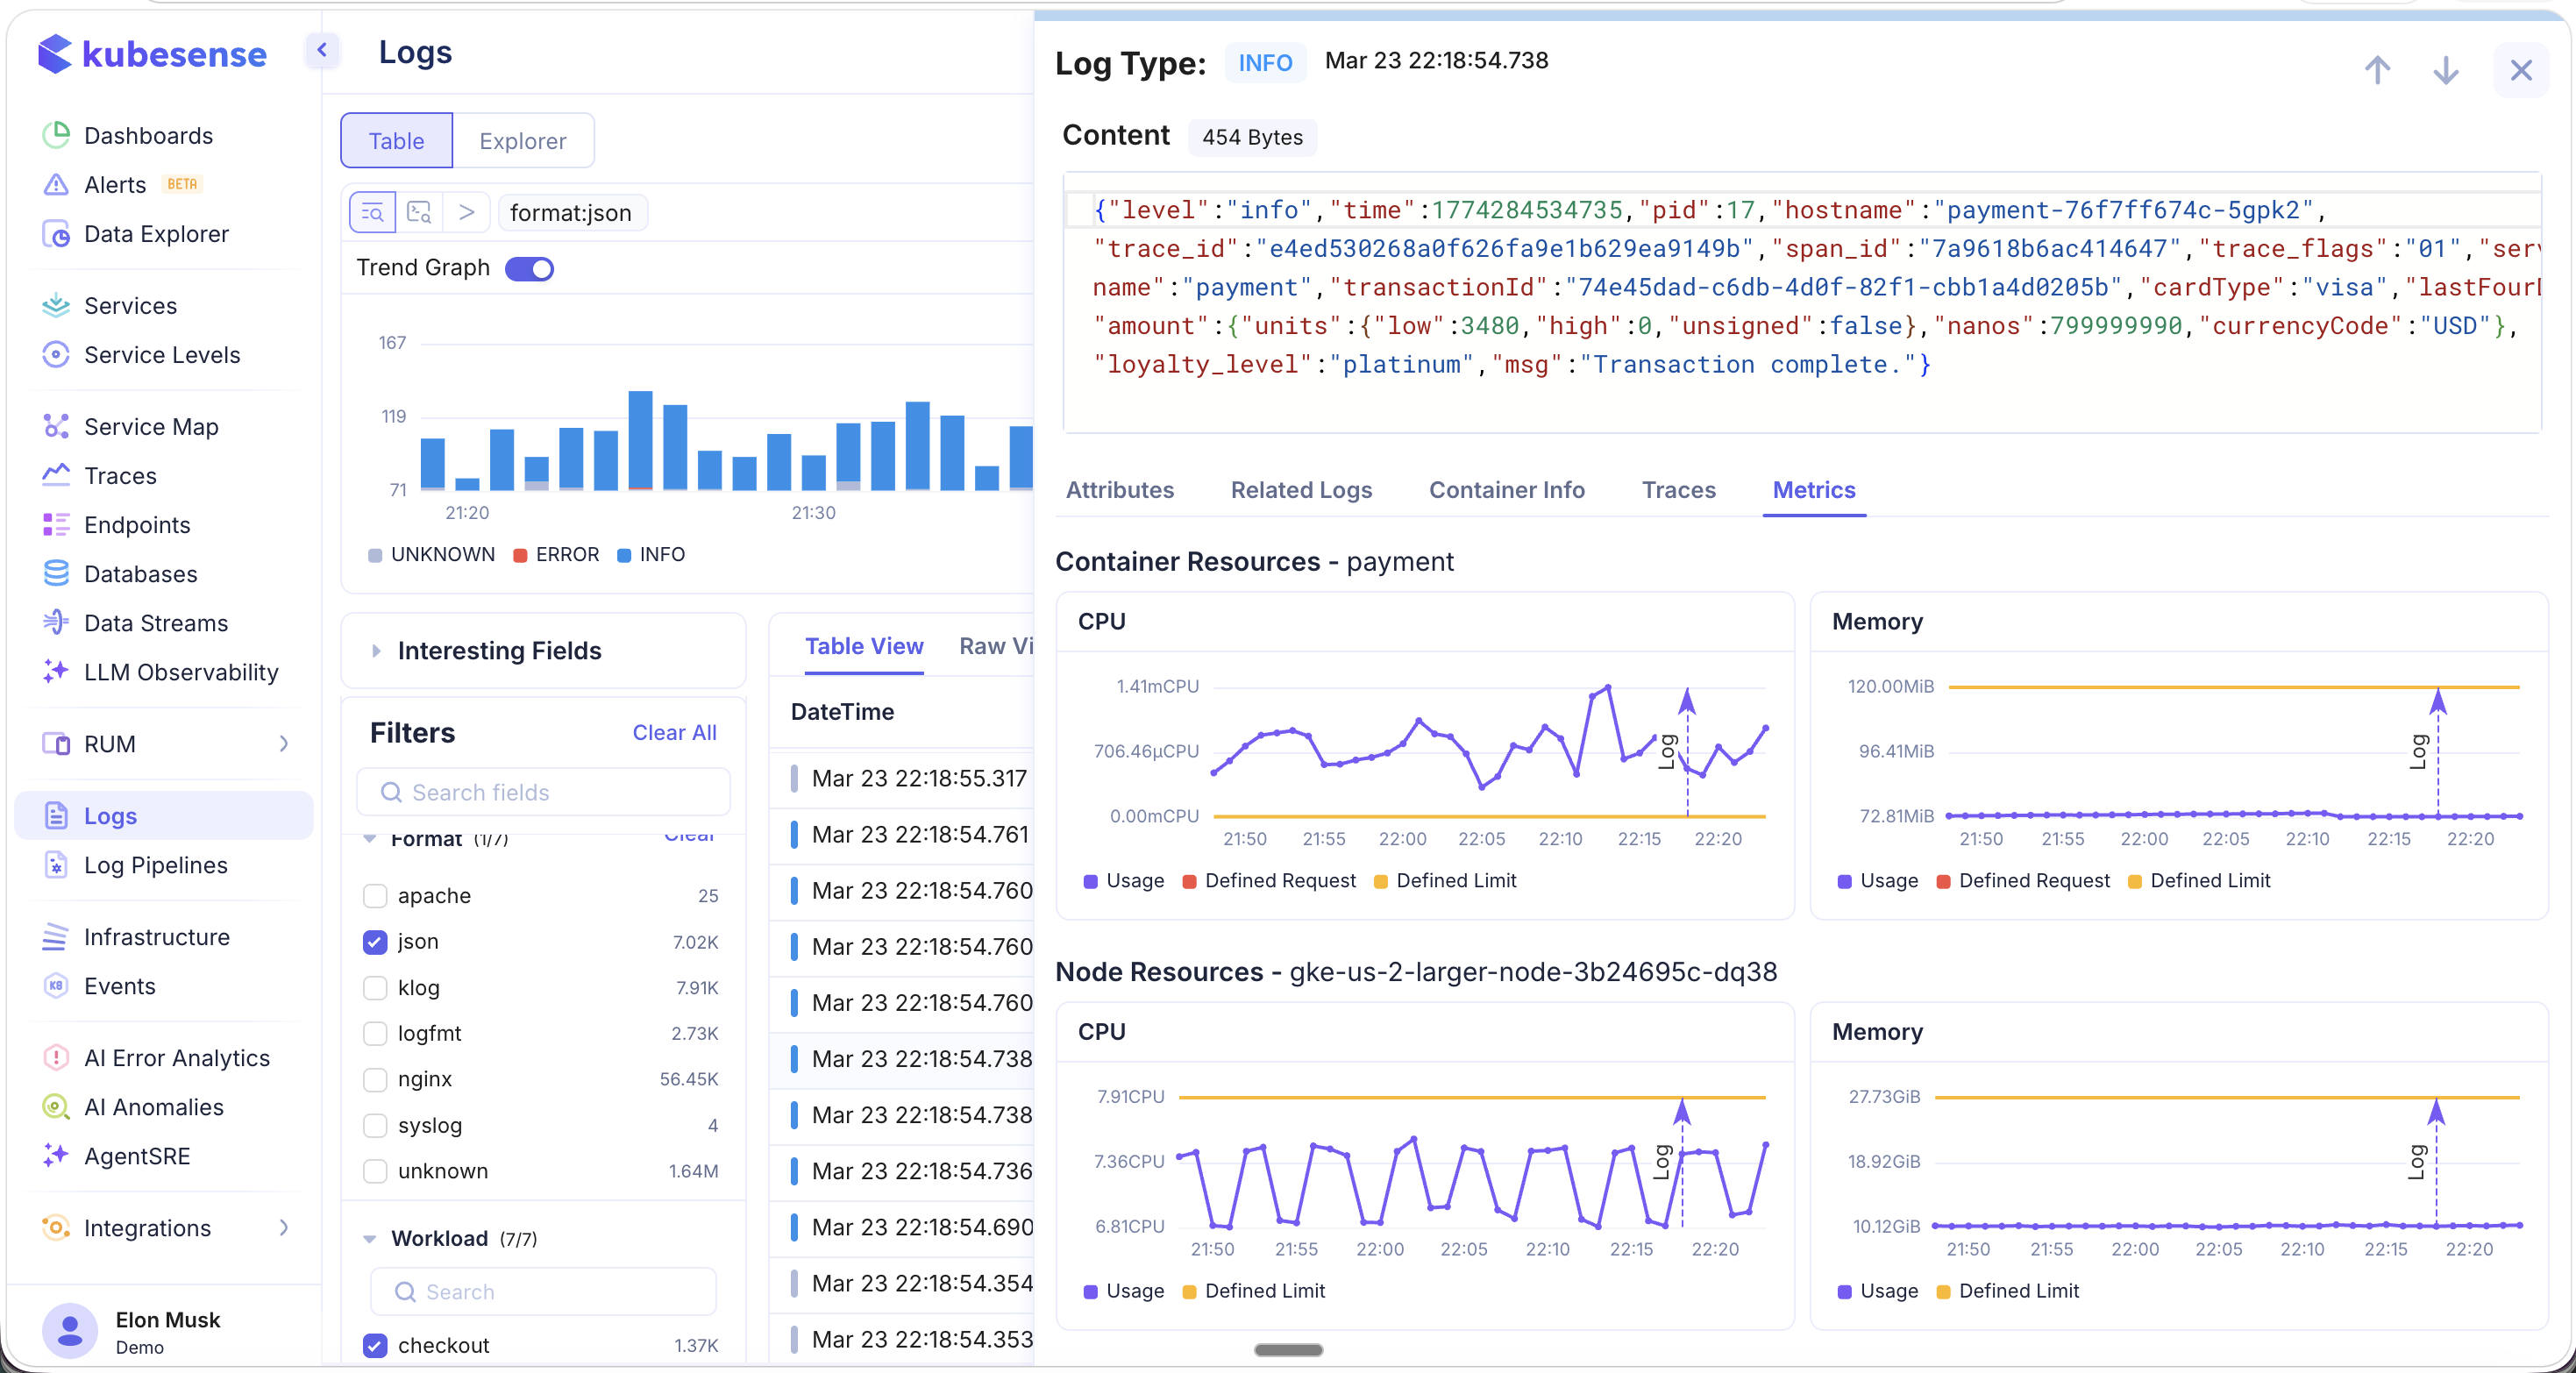
The metrics panel includes two sections:
Container Resources — CPU and memory utilization charts for the specific container, showing:
- Current usage
- Defined resource requests
- Defined resource limits
Node Resources — CPU and memory utilization charts for the underlying node, showing:
- Current usage
- Defined limits
These charts help you quickly determine whether a log error (e.g., OOM kill, timeout, slow response) correlates with resource exhaustion at the container or node level.
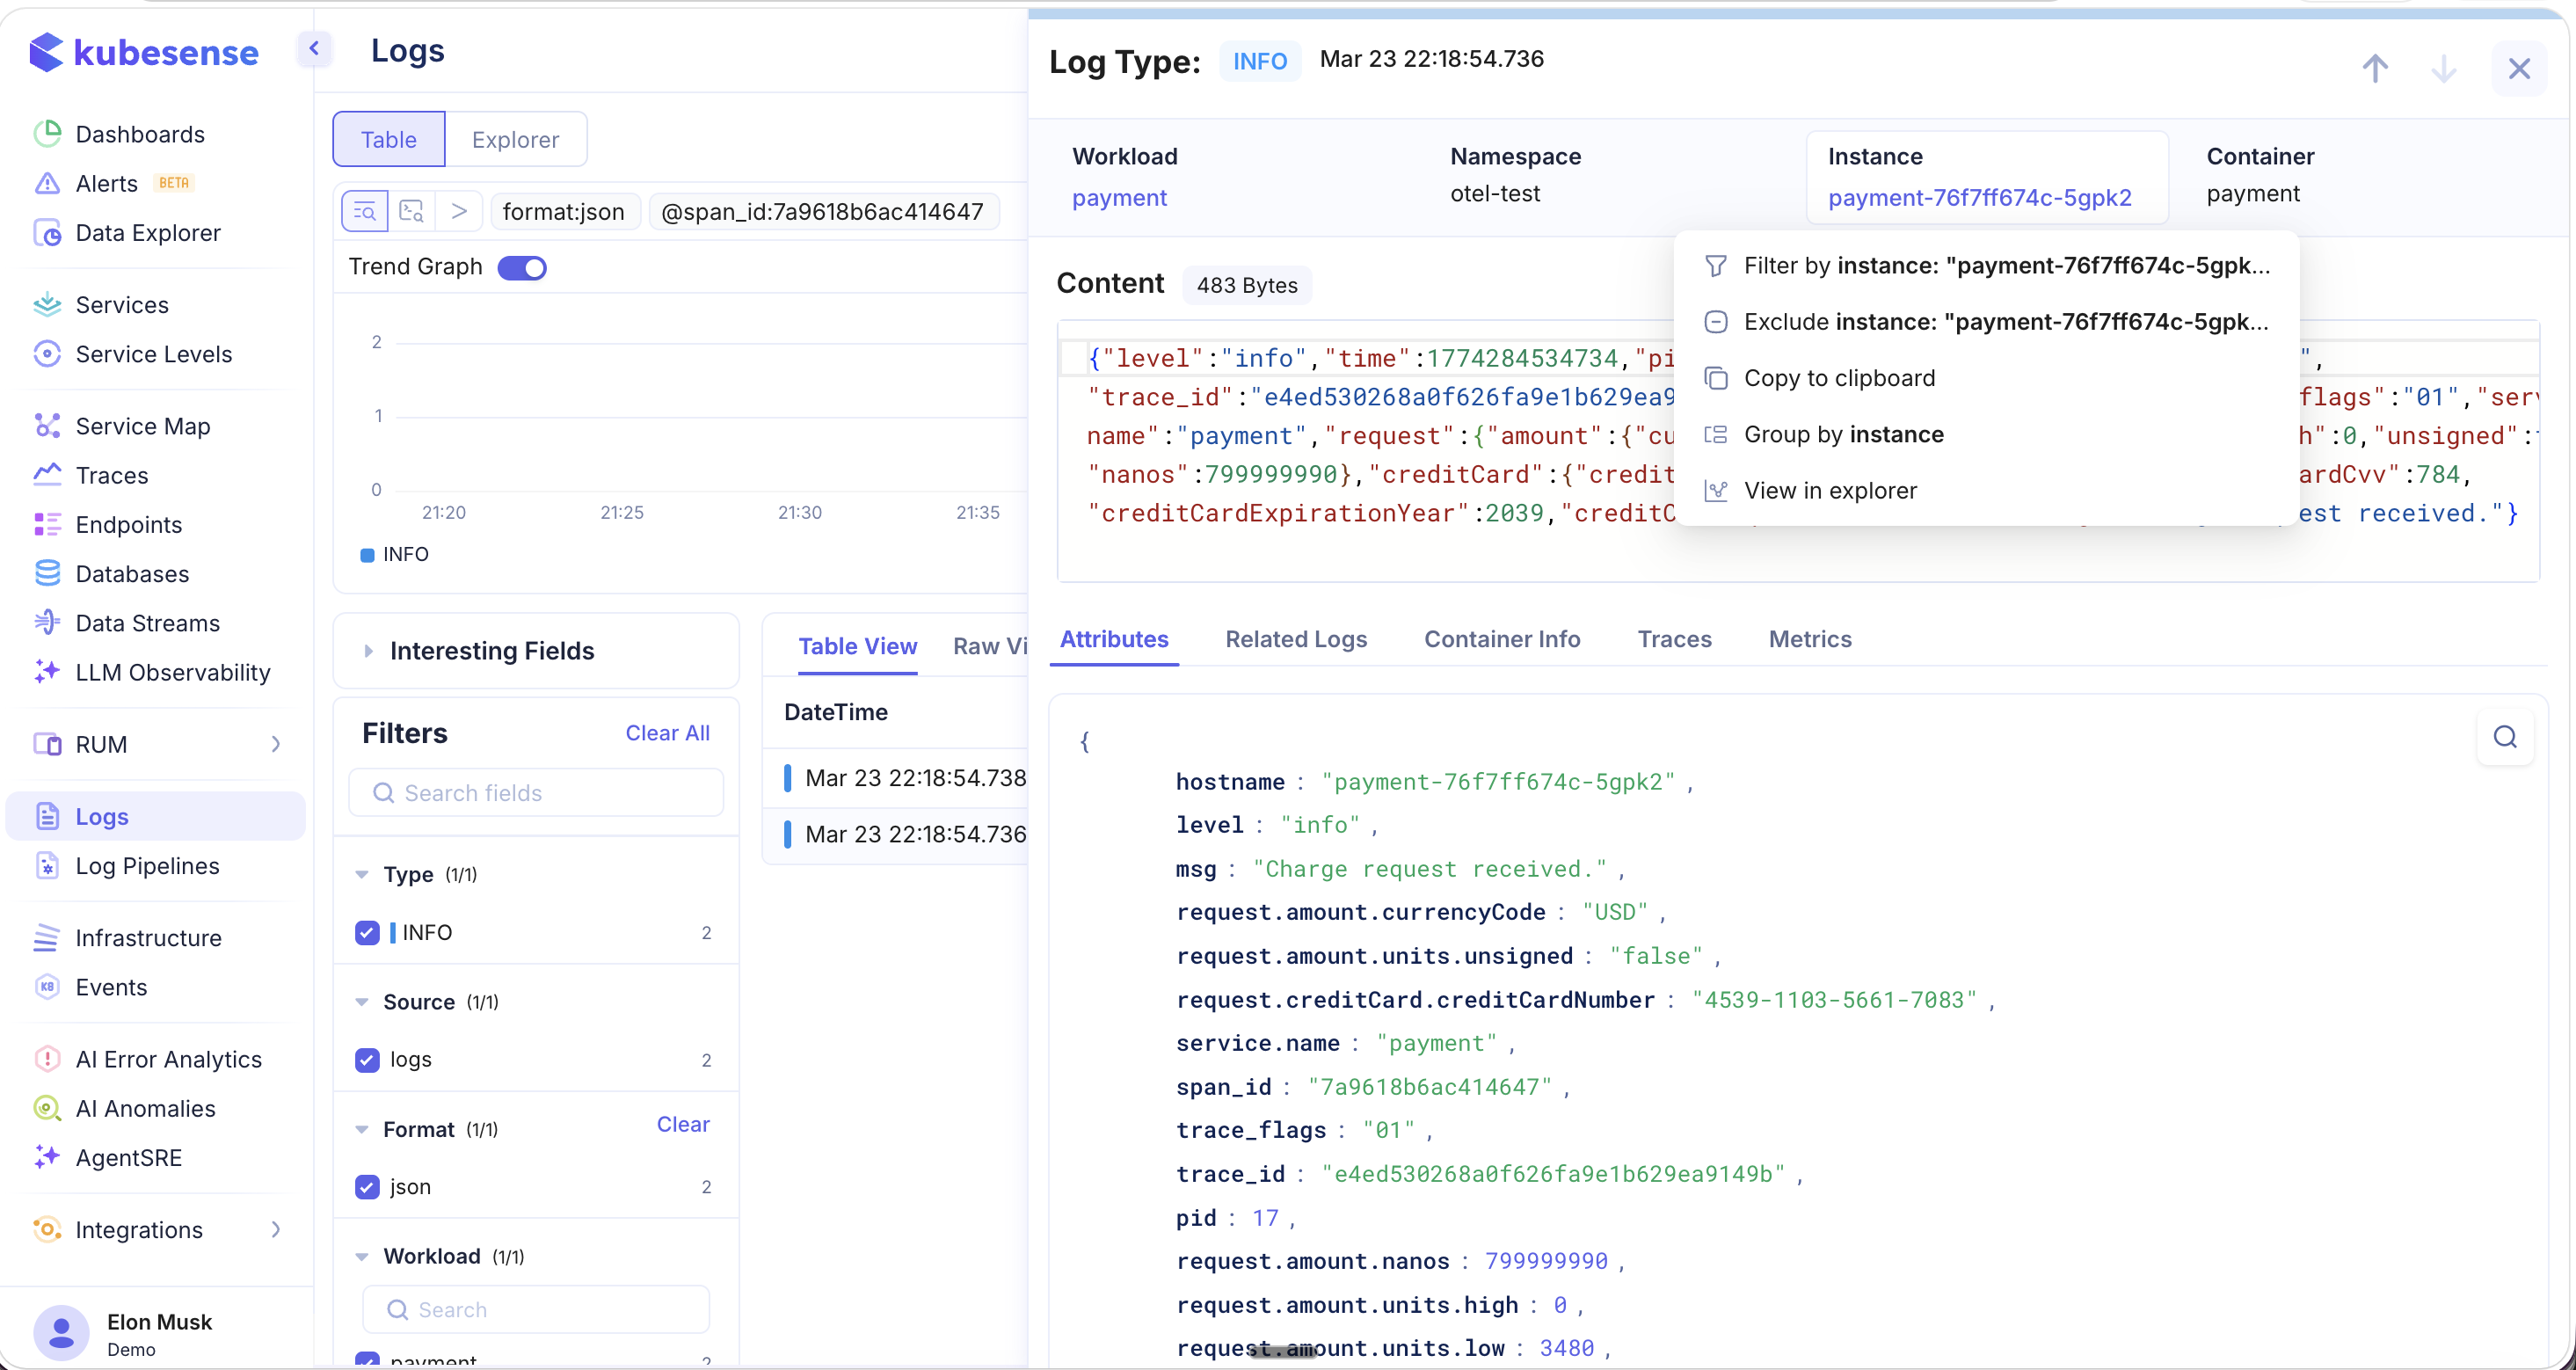
Quick Actions on Header Fields
In the log detail view header, each field (Workload, Namespace, Instance, Container) is clickable. Clicking on a field value reveals a quick-action menu:
| Action | Description |
|---|---|
| Filter by | Filter the log table to show only entries from this instance/workload/namespace |
| Exclude | Exclude entries matching this value |
| Copy to clipboard | Copy the field value |
| Group by | Group results by this field |
| View in explorer | Open in the Explorer view for visualization |