Log Table & Views
The log table is the primary view for browsing individual log entries in the Log Explorer. It provides multiple display modes and a real-time trend graph to help you quickly identify patterns and investigate issues.
Trend Graph
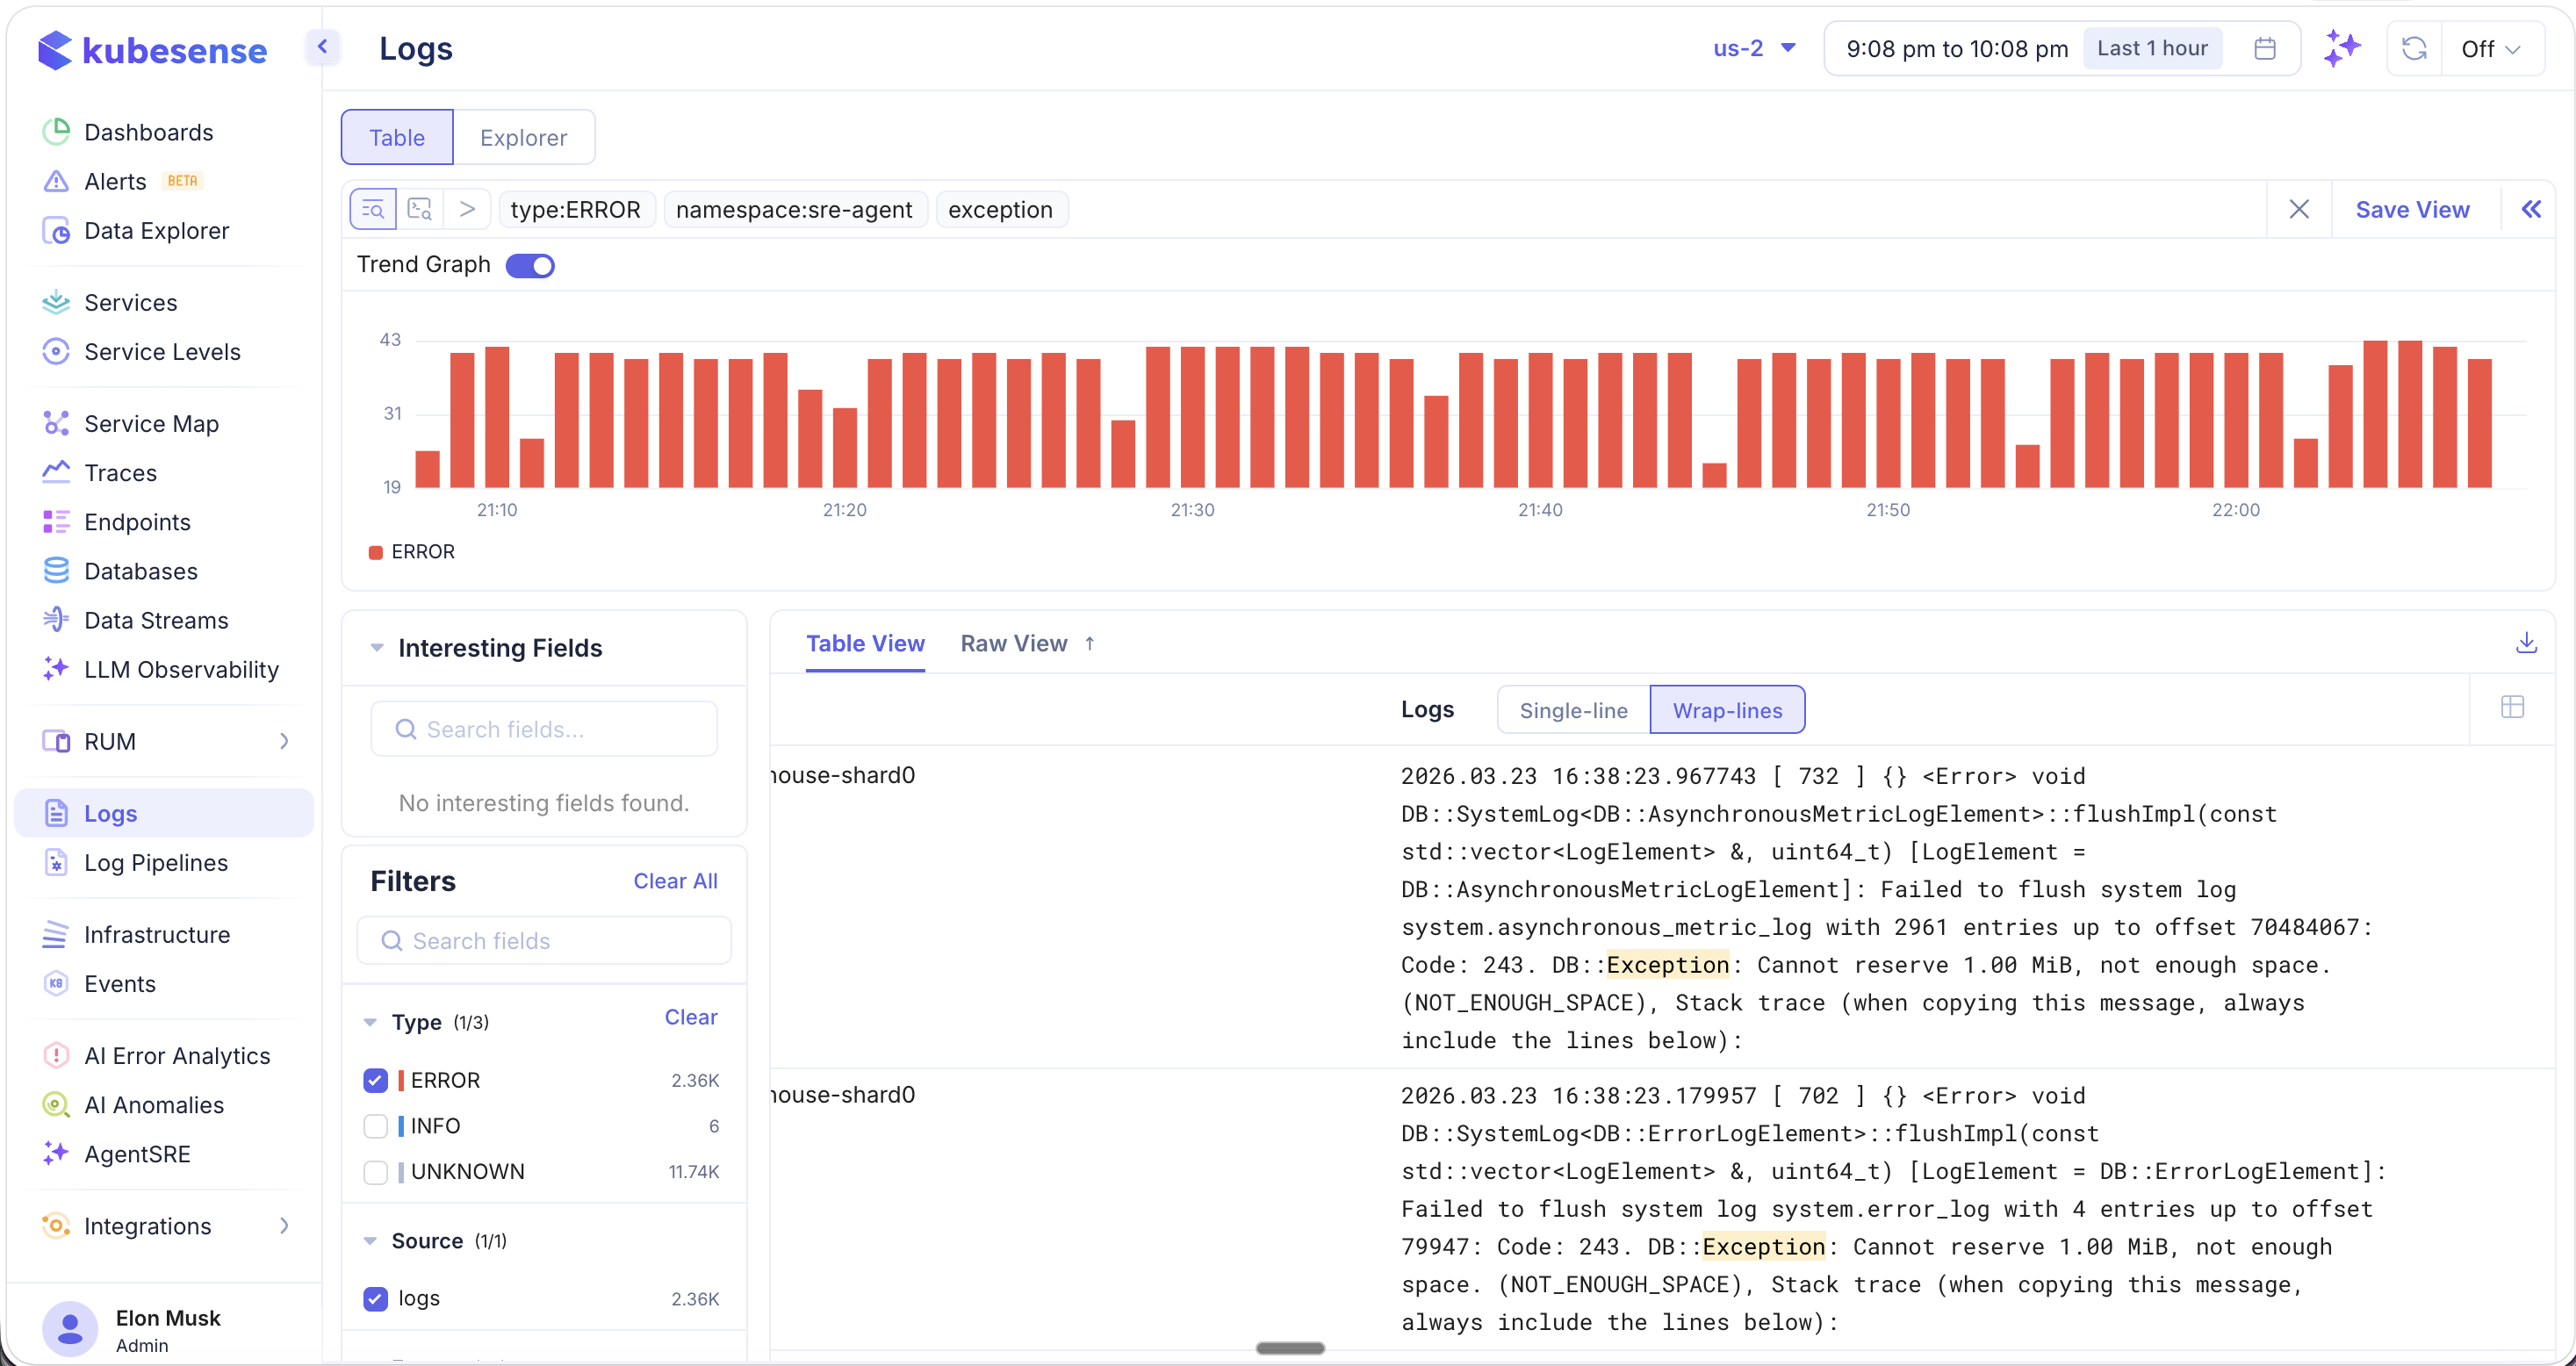
Toggle the Trend Graph at the top of the Log Explorer to visualize log volume as a time-series bar chart. The graph is color-coded by log severity level — ALERT, DEBUG, ERROR, INFO, INFORMATION, NOTICE, TRACE, UNKNOWN, WARN, and WARNING — making it easy to spot spikes in error rates, unusual drops in logging activity, or patterns that correlate with deployments and incidents.
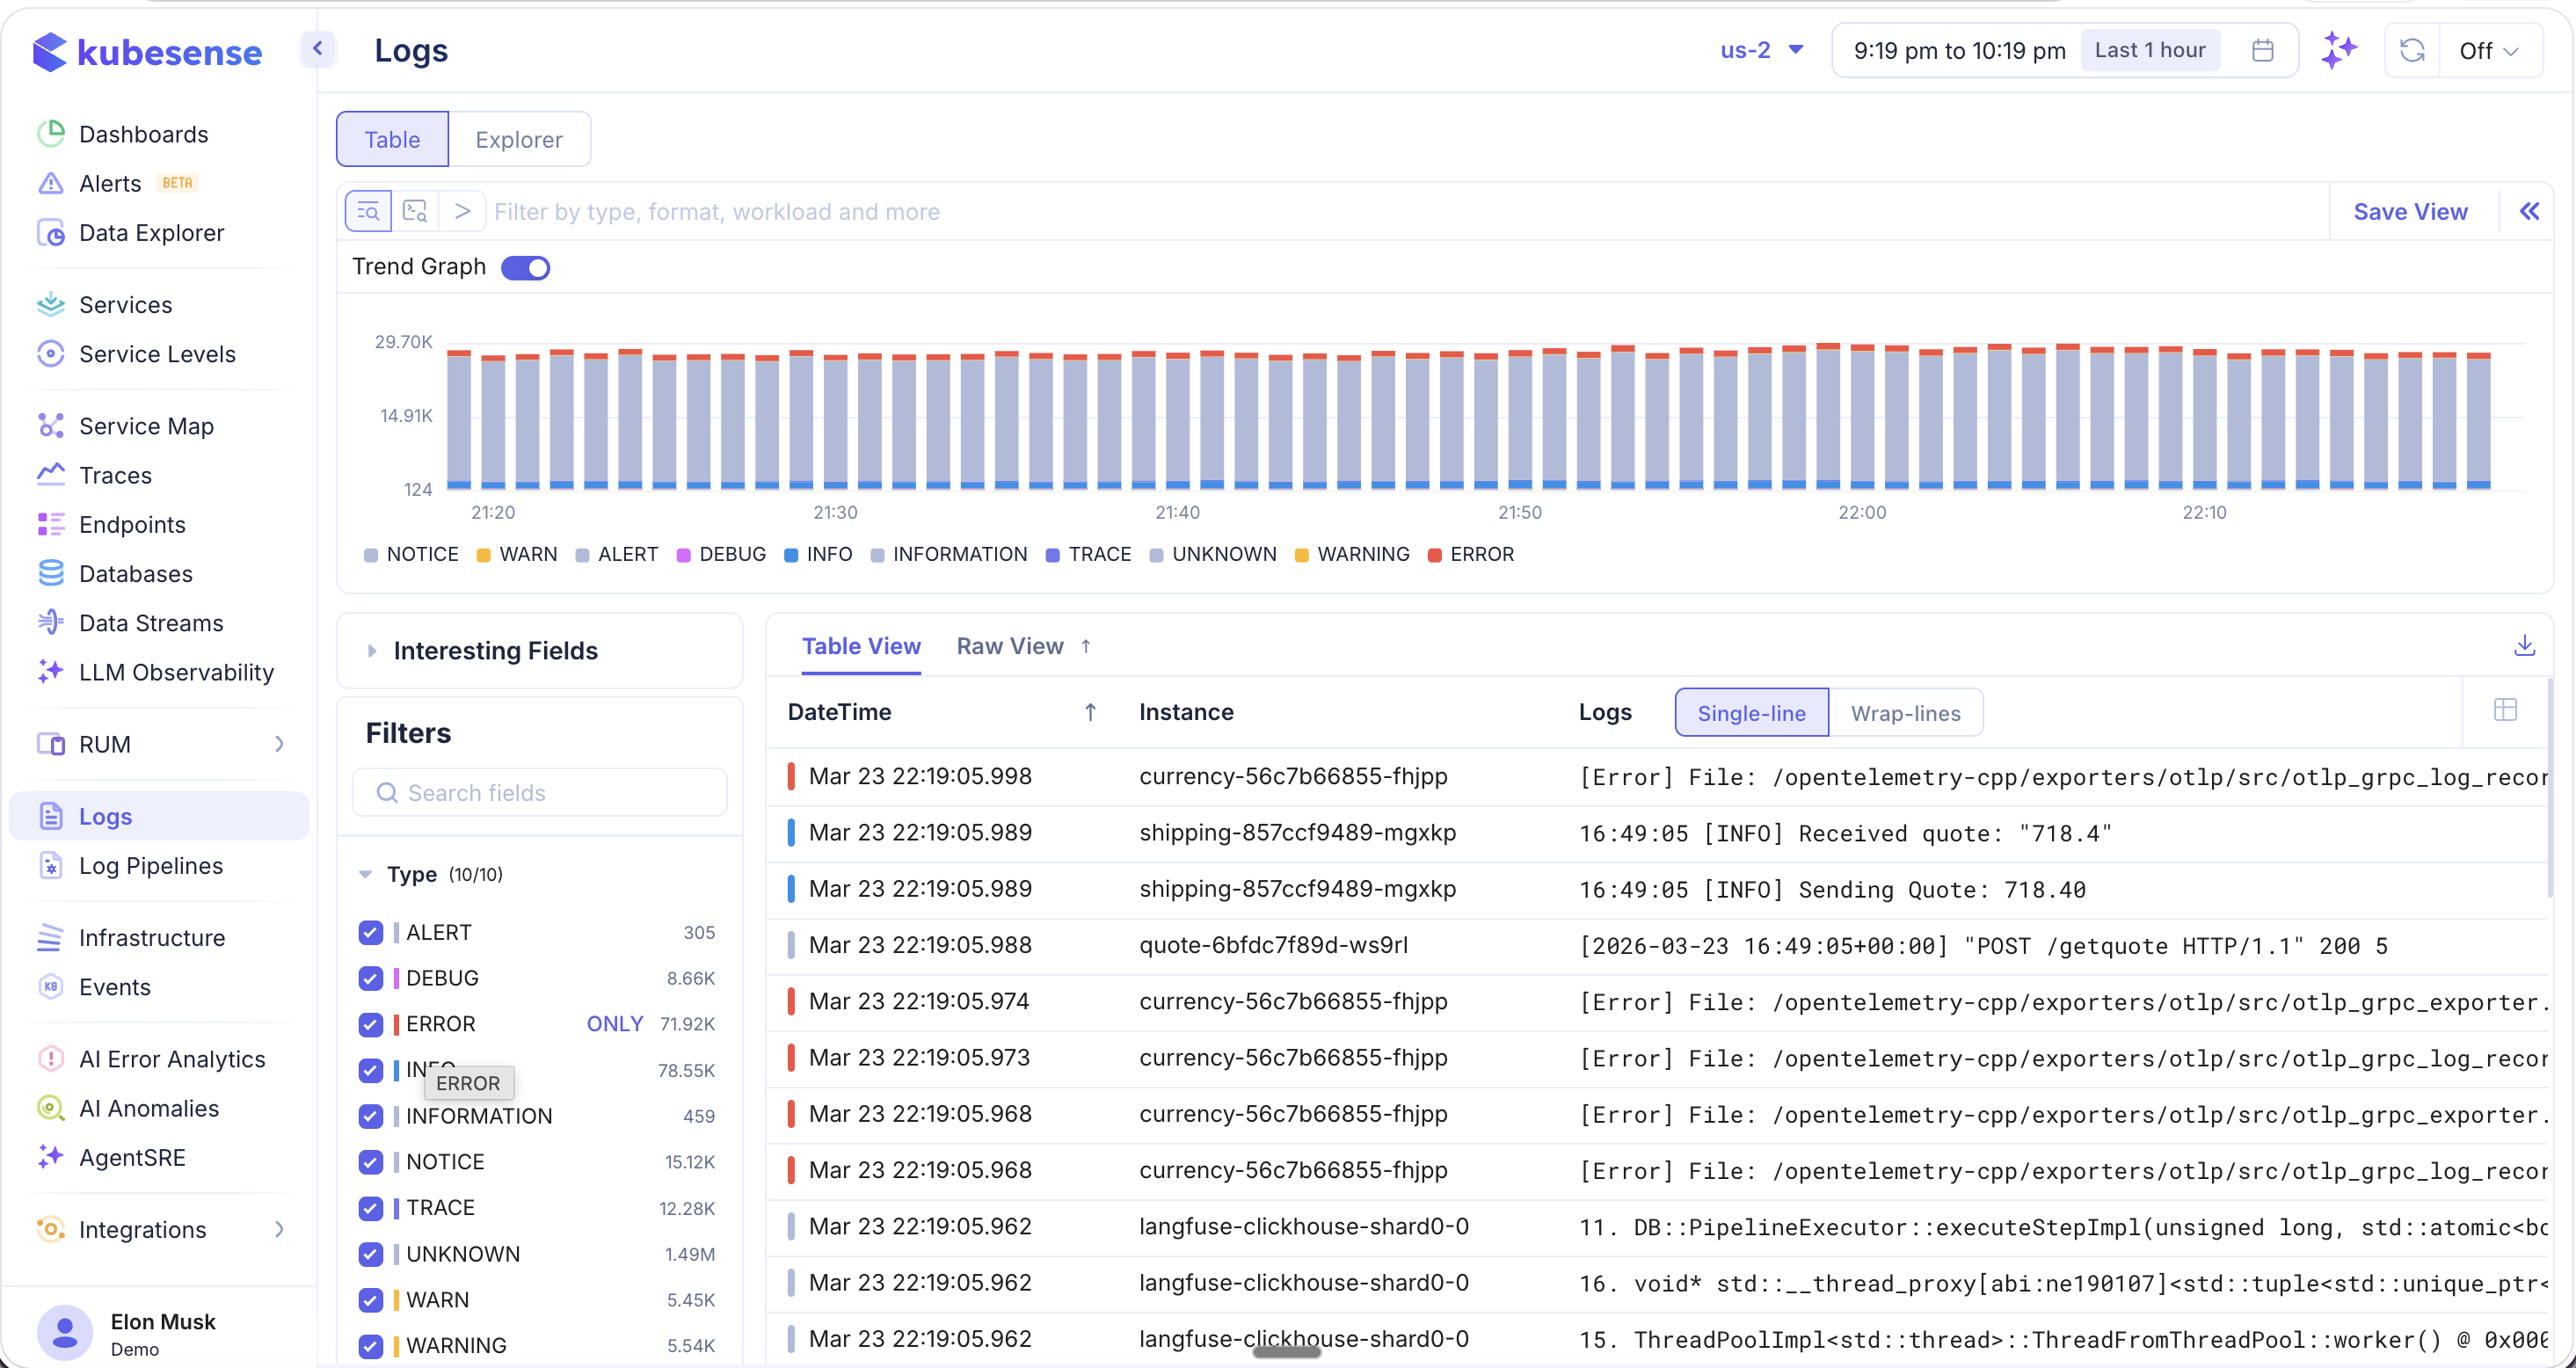
The trend graph automatically adjusts to your selected time range and updates in real time as you apply filters. When you notice an anomaly in the graph, you can click on a specific time bucket to zoom in and investigate the underlying log entries.
Log Table
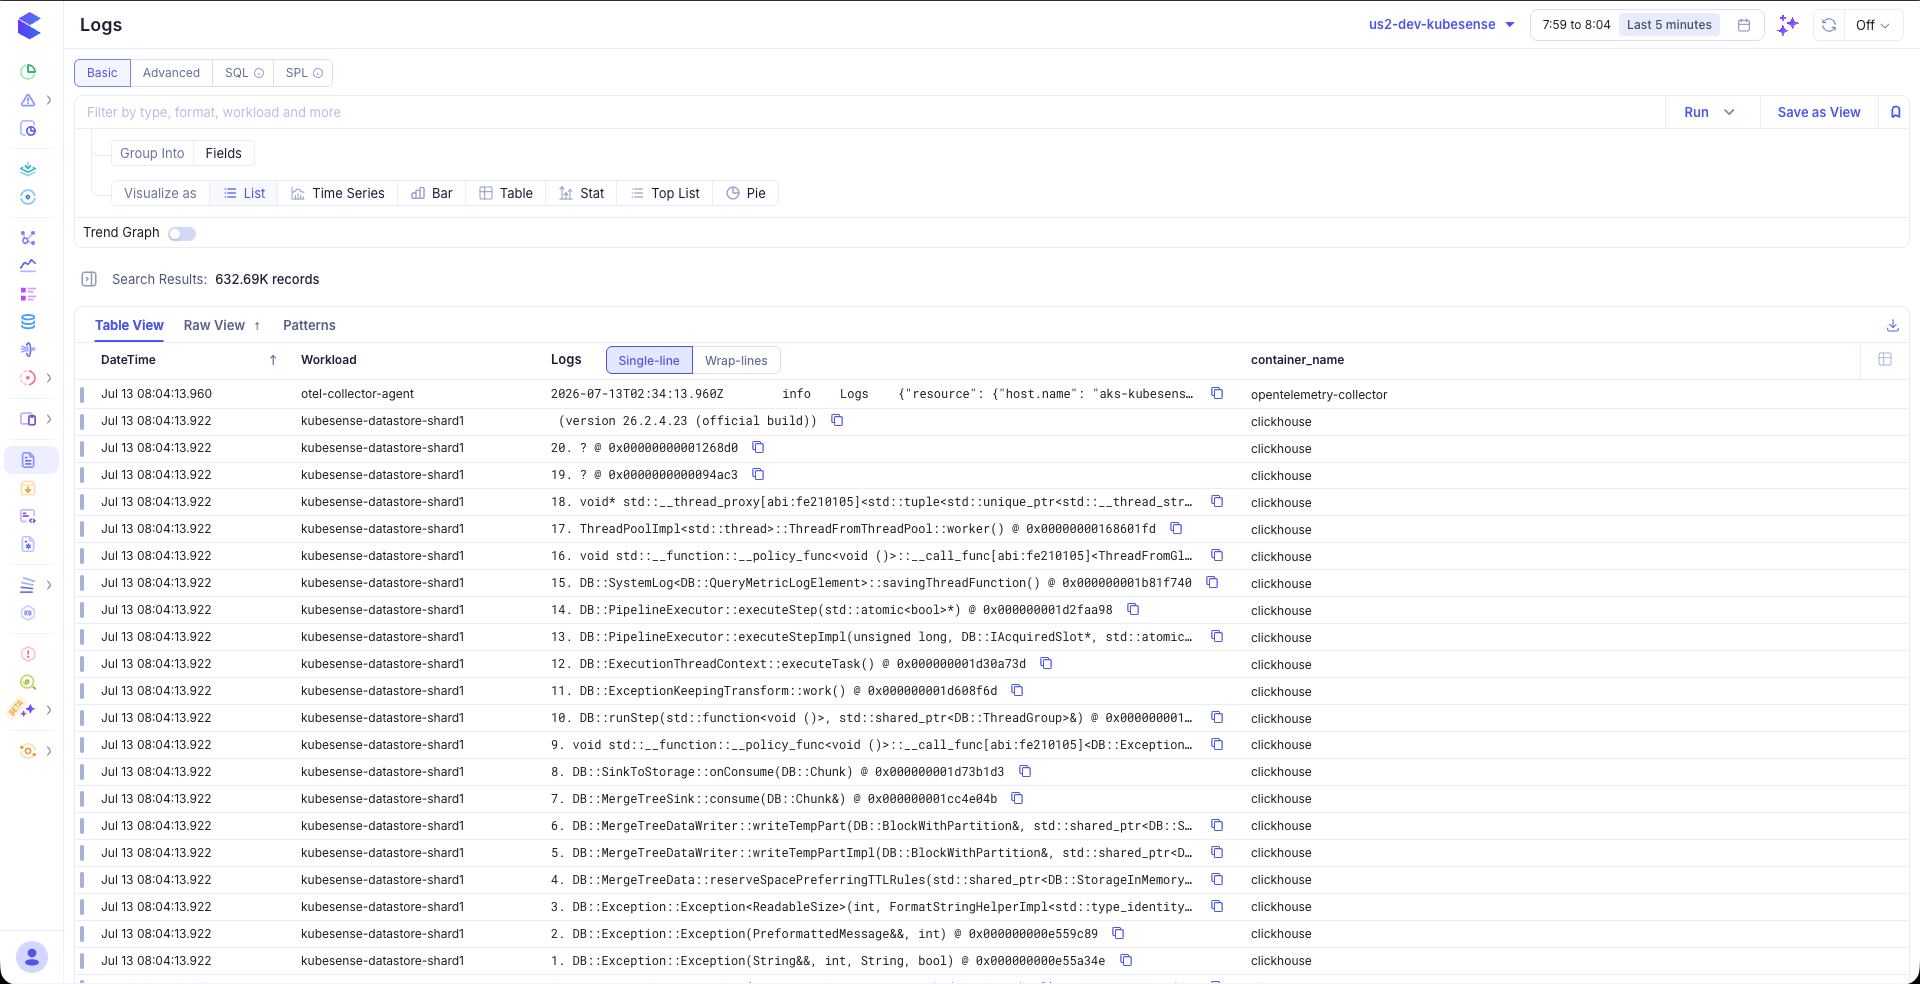
Each row in the log table represents a single log line, displayed with the following columns:
| Column | Description |
|---|---|
| DateTime | Millisecond-precision timestamp of the log entry |
| Instance | The pod or container instance that emitted the log |
| Workload | The Kubernetes workload name (Deployment, StatefulSet, DaemonSet, etc.) |
| Logs | The log message content |
View Modes
The log table supports two display modes, which you can toggle using the buttons in the table header:
- Single-line — Each log entry is displayed on a single row. Long messages are truncated with an ellipsis. This mode is ideal for scanning large volumes of logs quickly.
- Wrap-lines — The full log message is displayed with word wrapping, so you can read complete error messages, stack traces, and JSON payloads without expanding individual entries.
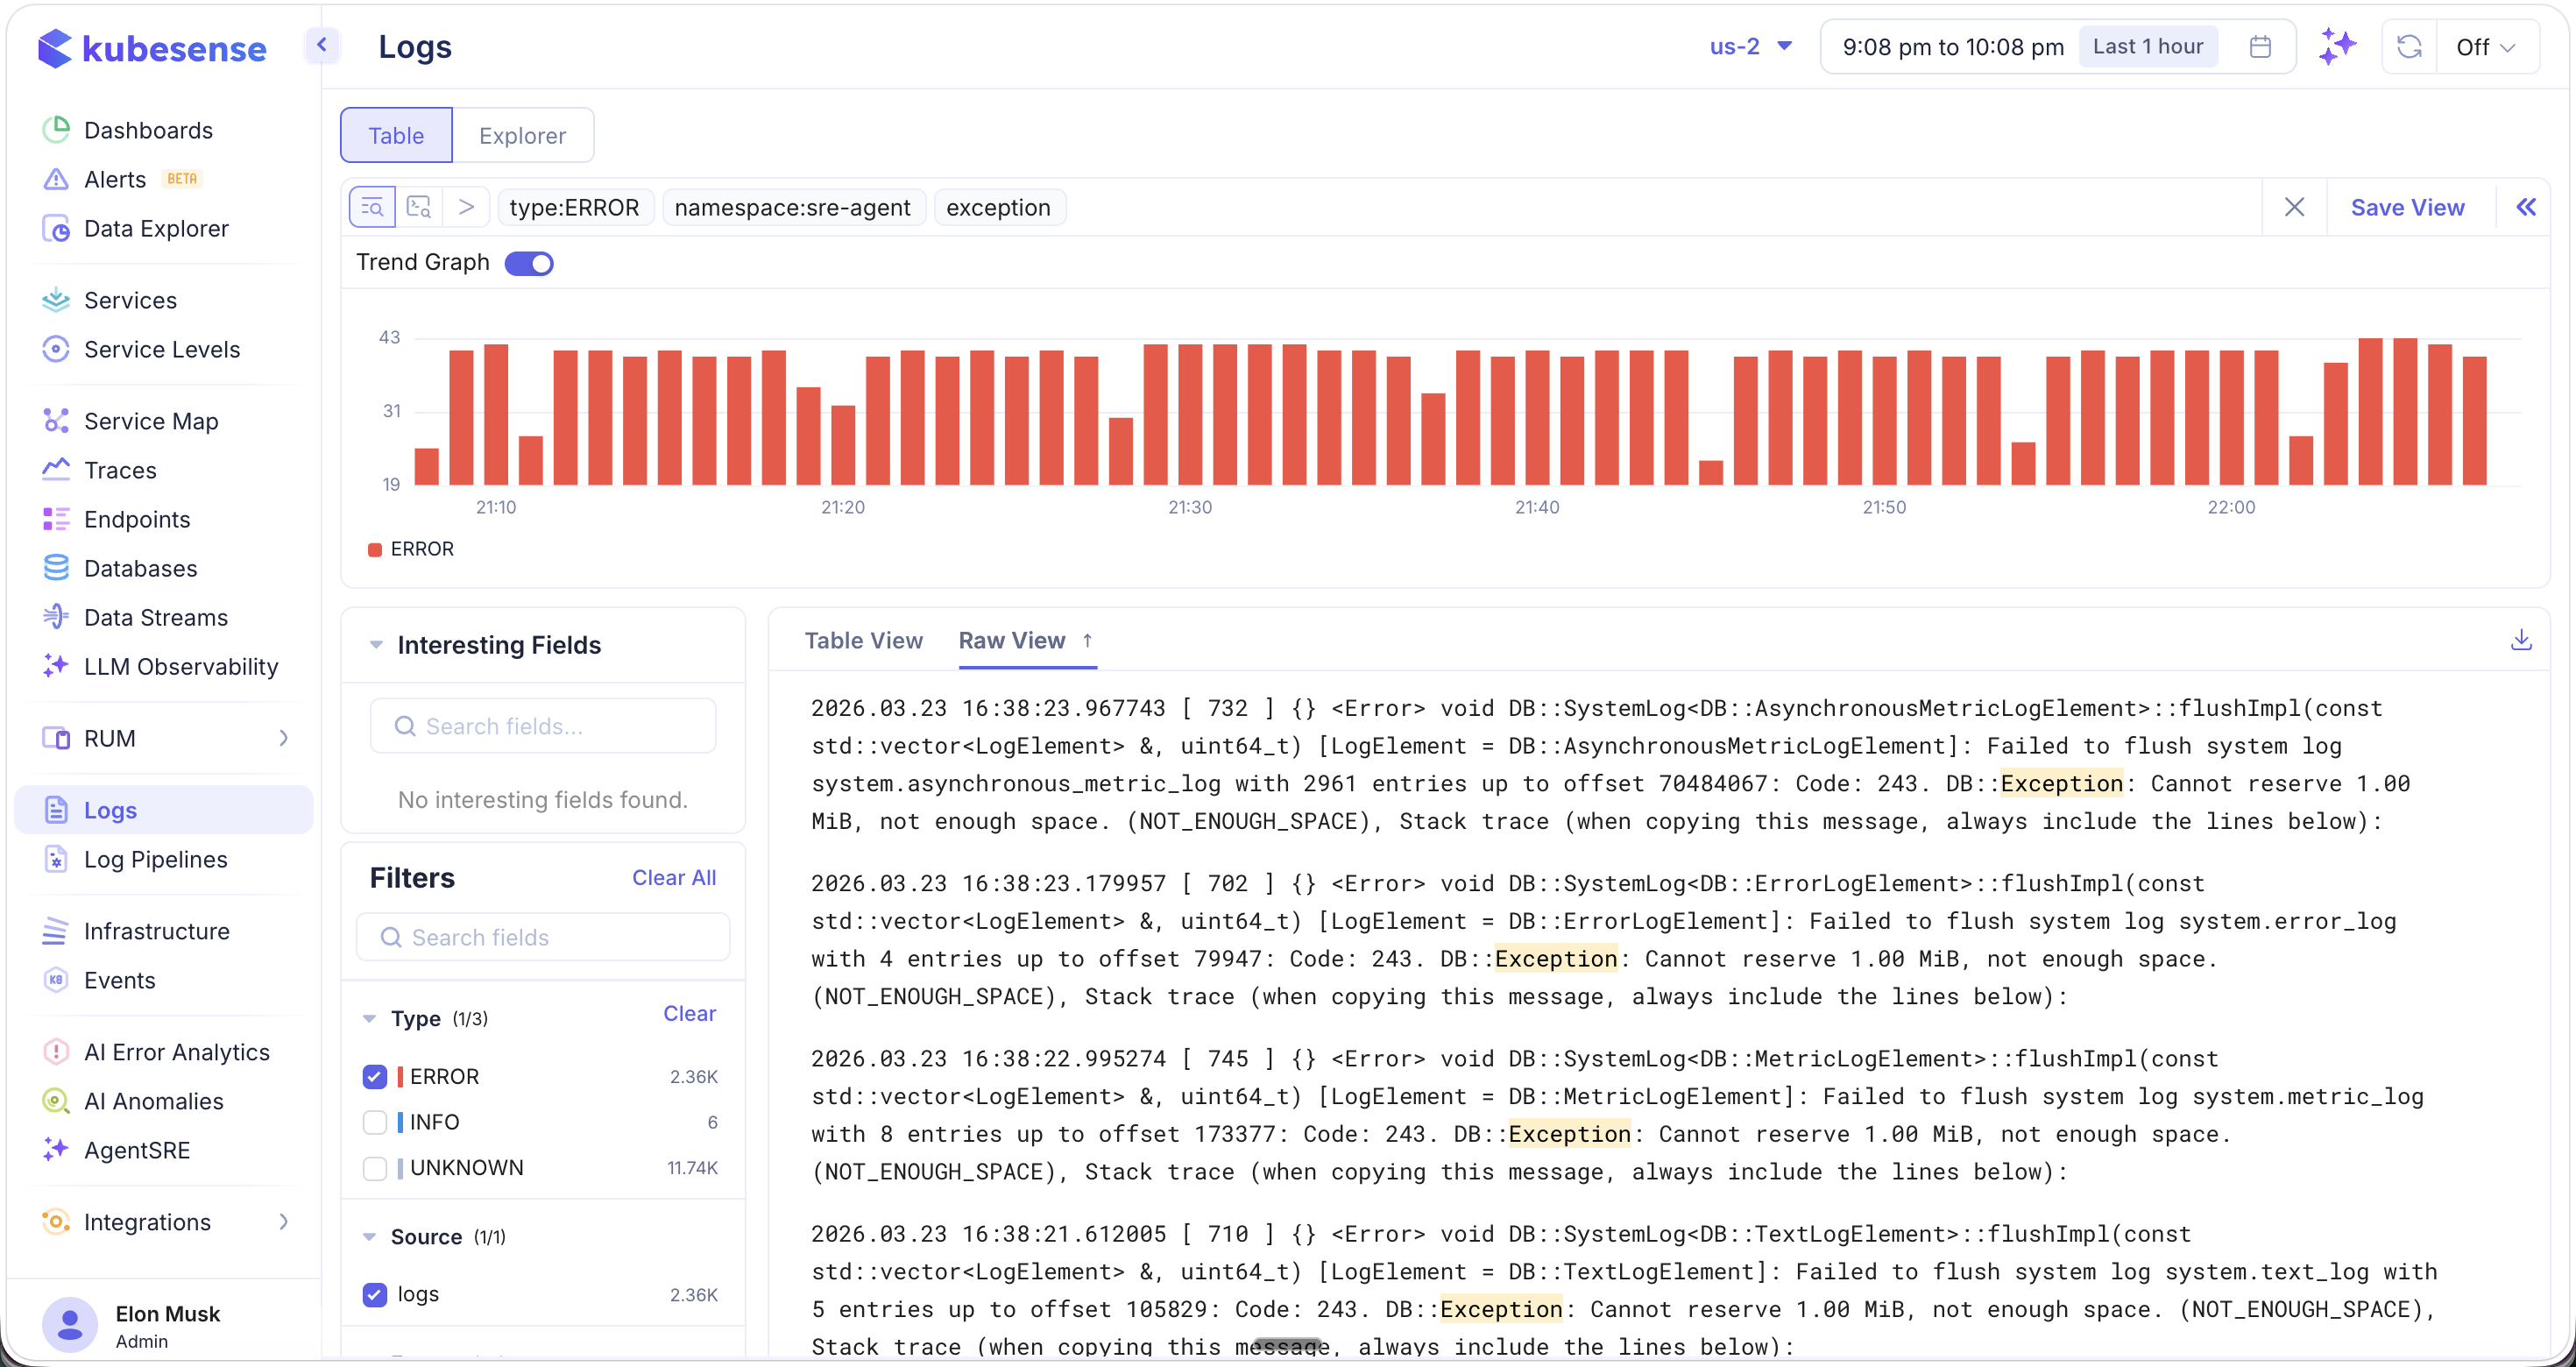
When performing a free-text search, matching keywords are highlighted in yellow within the log body in both view modes, making it easy to locate the relevant portion of each log entry.
Raw View
Switch to the Raw View tab to see logs as continuous, unstructured text output — similar to tailing a log file directly. Each log entry is displayed as a full-width text block without table column separators. This view is particularly useful for reading multi-line stack traces and verbose error messages.