Filters & Interesting Fields
The left sidebar of the Log Explorer provides a powerful faceted filtering system and automatic field extraction. Together, these features let you rapidly narrow down millions of log entries to find exactly what you need.
Filter Panel
Each filter category shows the count of matching log entries, making it easy to identify patterns and narrow down your investigation. You can select multiple values within each filter and combine filters across categories.
Type
Filter logs by severity level. KubeSense recognizes 10 log levels:
| Level | Description |
|---|---|
| ALERT | Critical alerts requiring immediate attention |
| DEBUG | Debug-level diagnostic messages |
| ERROR | Error conditions that need investigation |
| INFO | Informational messages about normal operations |
| INFORMATION | Extended informational messages |
| NOTICE | Normal but significant conditions |
| TRACE | Fine-grained trace-level messages |
| UNKNOWN | Logs with unrecognized or missing severity |
| WARN | Warning conditions that may require attention |
| WARNING | Extended warning messages |
Each level displays a count (e.g., ERROR 98.74K, INFO 81.71K) so you can immediately see the distribution of log severity across your infrastructure.
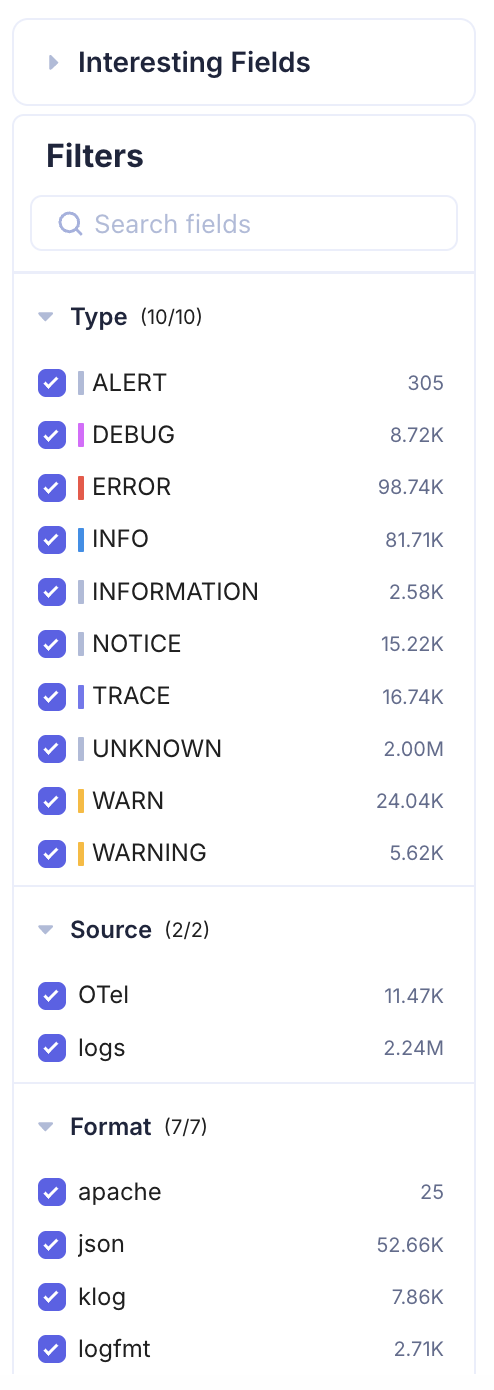
Source
Filter by the source of log ingestion:
- OTel — Logs collected via OpenTelemetry SDKs and the OpenTelemetry Collector
- logs — Logs collected directly from container stdout/stderr or file-based log collection
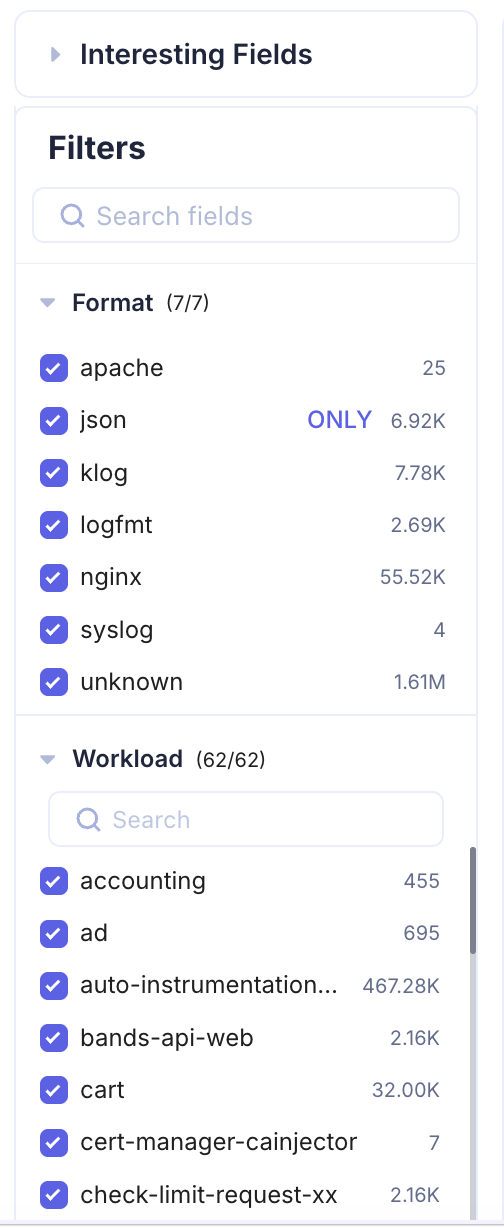
Format
Filter by the detected log format. KubeSense automatically identifies the format of each log entry:
- apache — Apache HTTP Server access and error logs
- json — Structured JSON log entries
- klog — Kubernetes-style klog format
- logfmt — Key-value pair logfmt format
- nginx — Nginx access and error logs
- syslog — Standard syslog format
- unknown — Logs that do not match a recognized format
Workload
Filter by Kubernetes workload name. This filter includes a search box for quickly finding specific workloads when you have a large number of deployments. The count next to each workload shows how many log entries it has emitted in the selected time range.
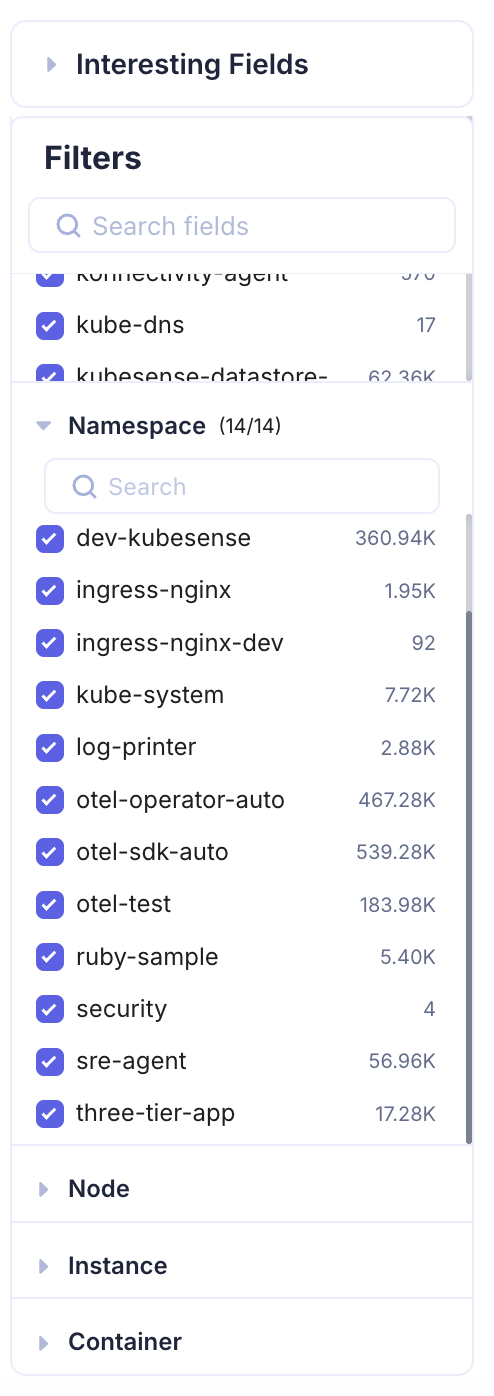
Namespace
Filter by Kubernetes namespace to scope your investigation to a specific environment or team.
Node, Instance, and Container
Additional infrastructure-level filters let you drill down to specific nodes, pod instances, or containers. These filters are especially useful when troubleshooting node-level issues or investigating a specific replica of a workload.
Interesting Fields
The Interesting Fields section is a powerful feature that automatically extracts and surfaces key attributes from your log data. KubeSense parses your logs in real time, identifies recurring fields and attributes, and presents them as expandable facets.
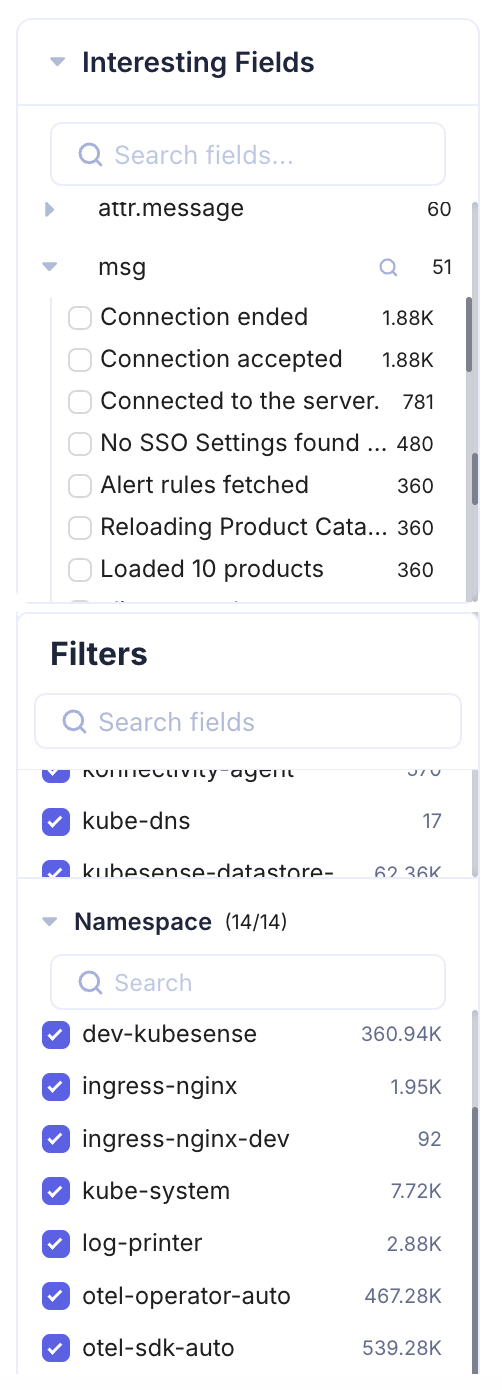
When you expand an interesting field, you see the distinct values for that attribute along with their occurrence counts. For example, if your logs contain a msg attribute, the Interesting Fields section might show:
| Value | Count |
|---|---|
| Connection ended | 1.88K |
| Connection accepted | 1.88K |
| Connected to the server | 781 |
| No SSO Settings found | 480 |
| Alert rules fetched | 360 |
This is invaluable for identifying:
- Anomalous patterns — A sudden spike in a specific message after a deployment
- Error distribution — Which error messages dominate during an incident
- Behavioral changes — New message patterns that appear after a release
- Noise reduction — High-frequency messages that may be candidates for log pipeline filtering
You can also use the search box within Interesting Fields to quickly locate specific attributes across your log data.