Alert Events & Triage
The Alert Events page is the operational view of alerting: every alert instance (each unique firing series — e.g. one pod or workload of a grouped rule), whether currently firing or already resolved, with built-in triage so on-call engineers can acknowledge, assign, and drill into each incident.
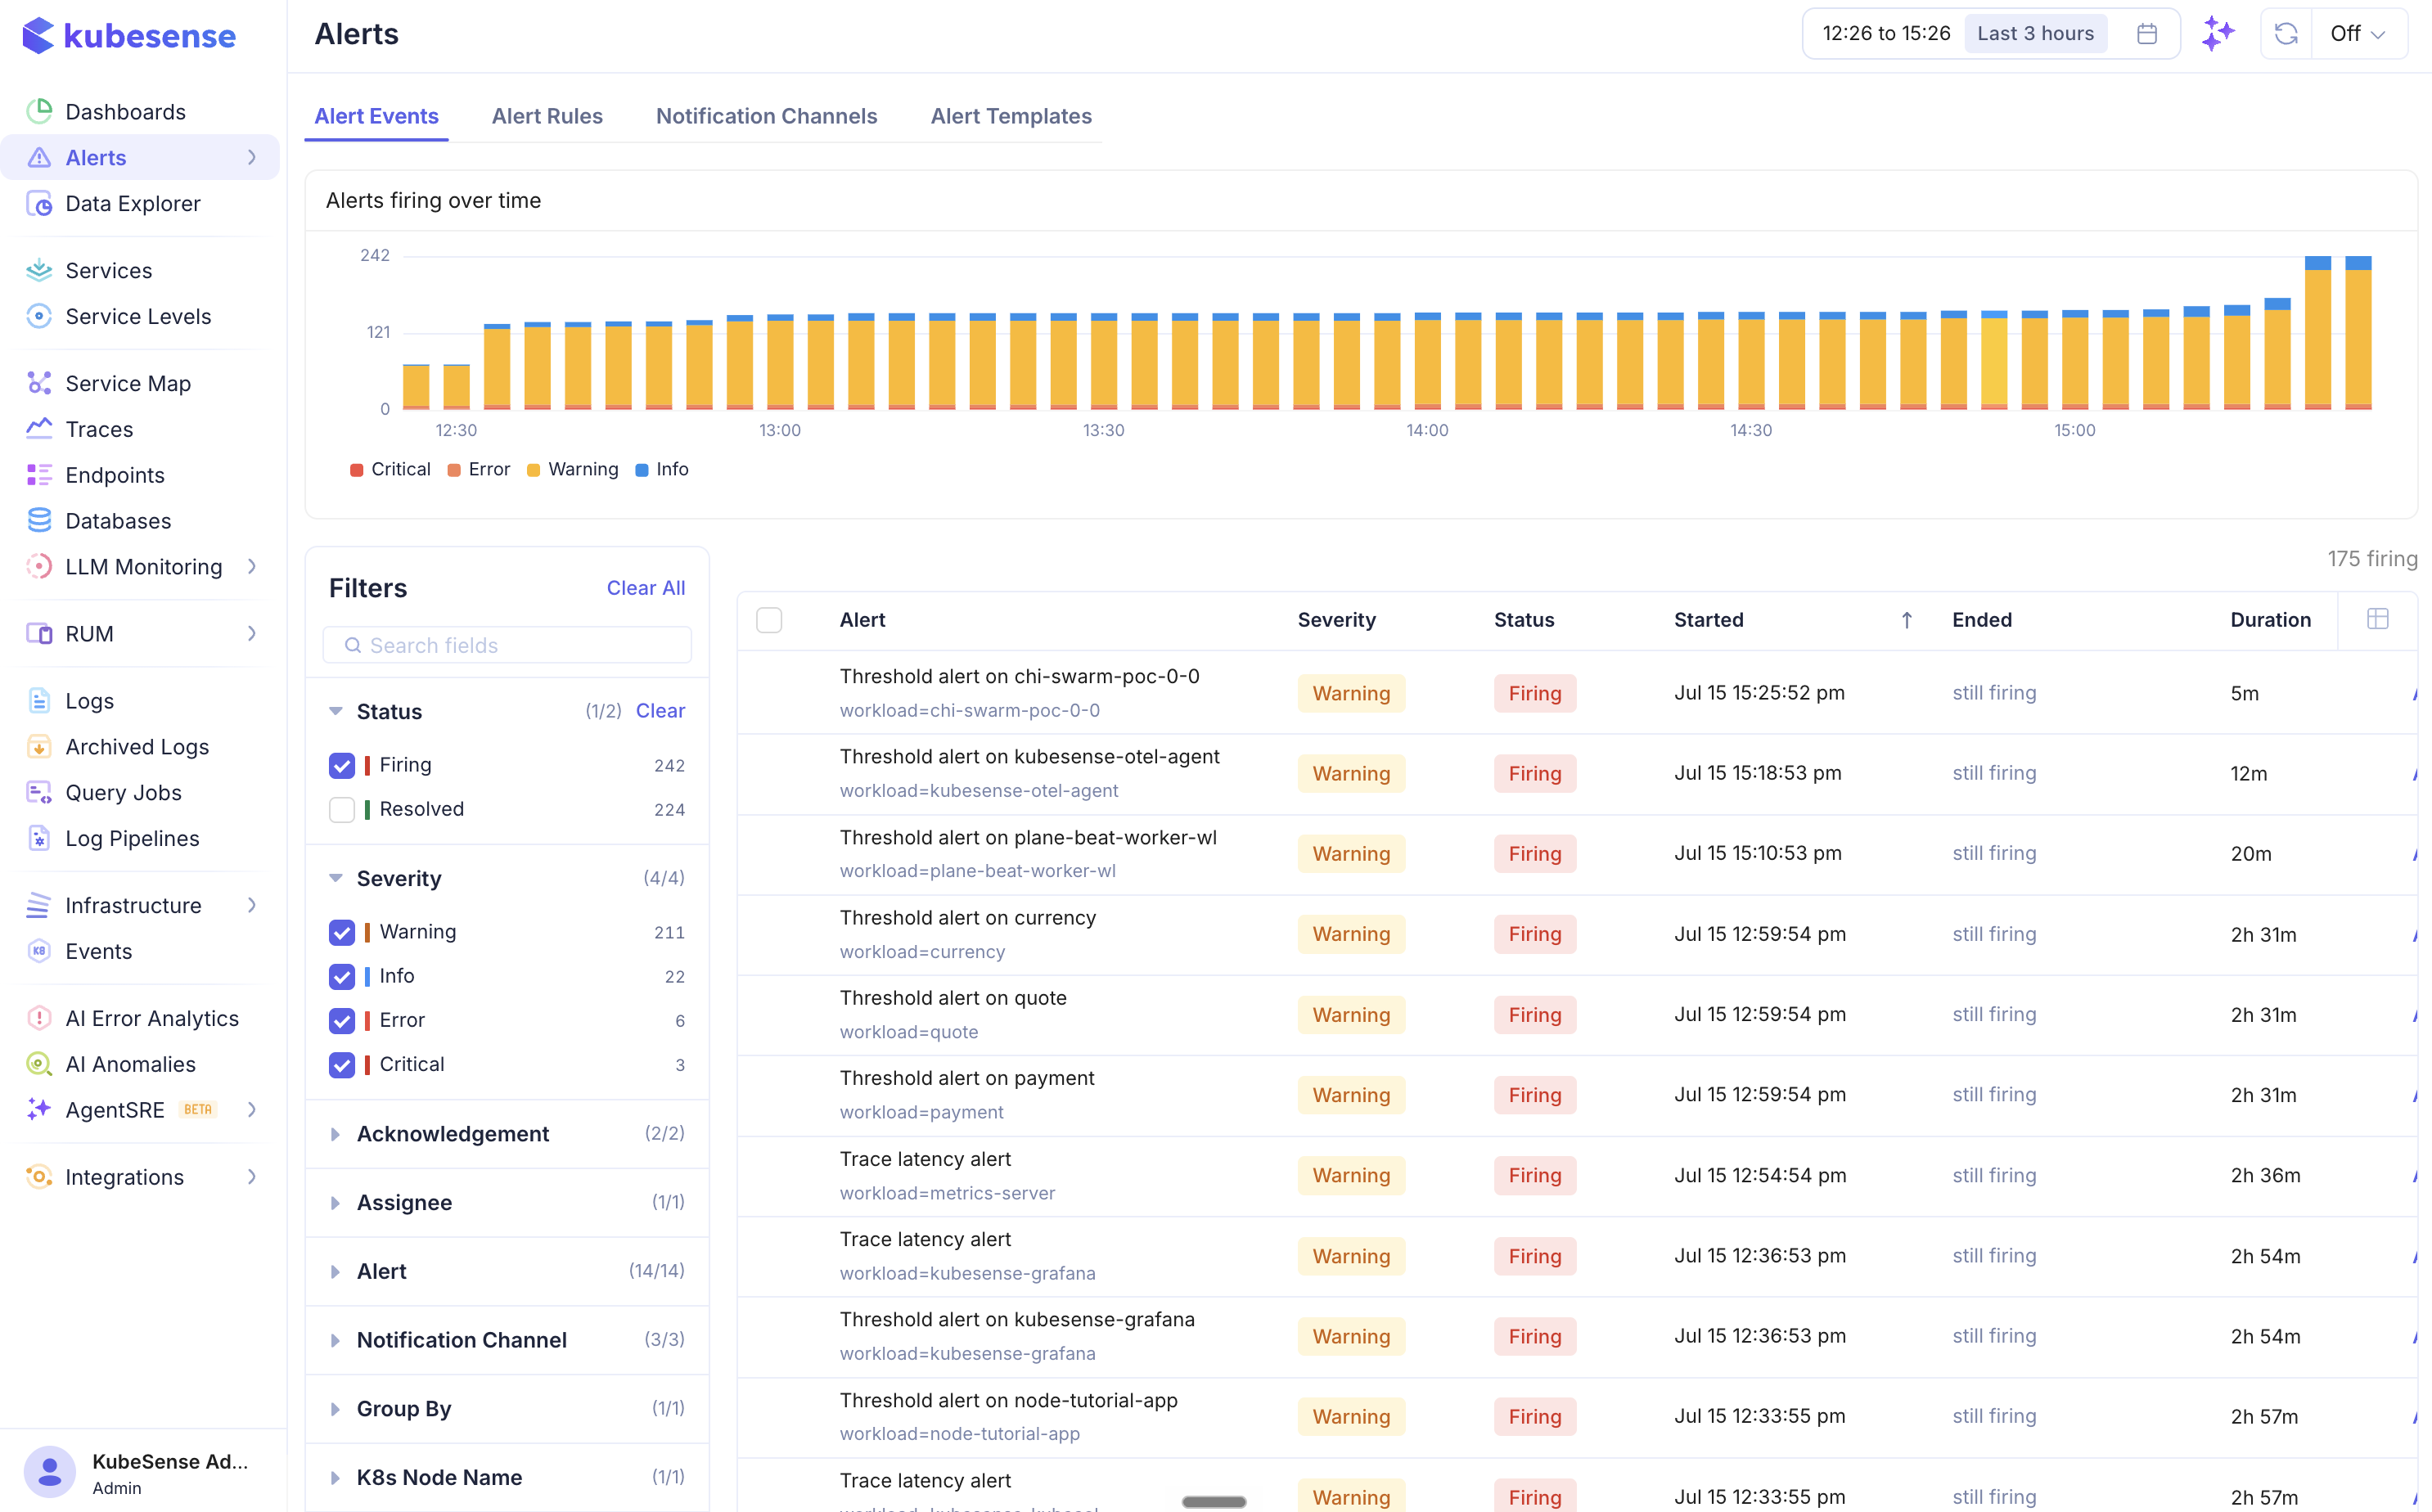
The Alerts area is organised into four tabs:
| Tab | Purpose |
|---|---|
| Alert Events | Alert instances (firing and resolved) in the selected time window, with triage |
| Alert Rules | Create and manage rule definitions |
| Notification Channels | Configure Slack, Teams, Email, PagerDuty, Datadog On-Call, Google Chat, Webhook |
| Alert Templates | Customise notification message content per channel type |
Alert Events list
The page lands showing firing alerts only — include Resolved in the Status filter to see full history. An instance appears whenever its firing interval overlaps the selected time window.
| Column | Description |
|---|---|
| Alert | Rule name (with {{label}} placeholders resolved) plus the labels that distinguish this instance from its siblings (e.g. pod=checkout-6f7b…) |
| Severity | critical, error, warning, info |
| Status | Firing or Resolved |
| Started / Ended | Firing interval (still firing while active) |
| Duration | How long the instance has been (or was) firing |
| Acknowledged By | Who acknowledged it — or an inline Acknowledge action |
| Assignee | Inline user picker to hand the incident to a teammate |
Above the table, the Alerts firing over time chart shows severity-stacked counts of concurrently firing alerts across the window, honoring the active filters.
Filtering
The left sidebar provides explorer-style faceted filters — the same model as the Logs and Traces pages. Every value starts selected; uncheck values to narrow, or hover a value and click Only to isolate it. Groups include Status, Severity, Acknowledgement, Assignee, Alert, Notification Channel, plus a dynamic group for every label your alerts carry (workload, namespace, pod, …). Counts are cross-filtered: each group shows how many alerts each value would match given all the other groups' selections.
Triage
| Action | Effect |
|---|---|
| Acknowledge | Marks the instance as owned and stops further notifications for it (an instance-scoped silence) until it resolves or is unacknowledged. An optional note is stored and shown alongside the acknowledger. |
| Unacknowledge | Removes the acknowledgement and re-enables notifications. |
| Assign | Assigns the instance to a user; the assignee is visible in the list and on the detail page. |
| Bulk acknowledge | Select multiple firing rows with the checkboxes and acknowledge them in one action. |
Acknowledging is per instance: acknowledging one pod's alert never silences the same rule's other pods.
Alert detail page
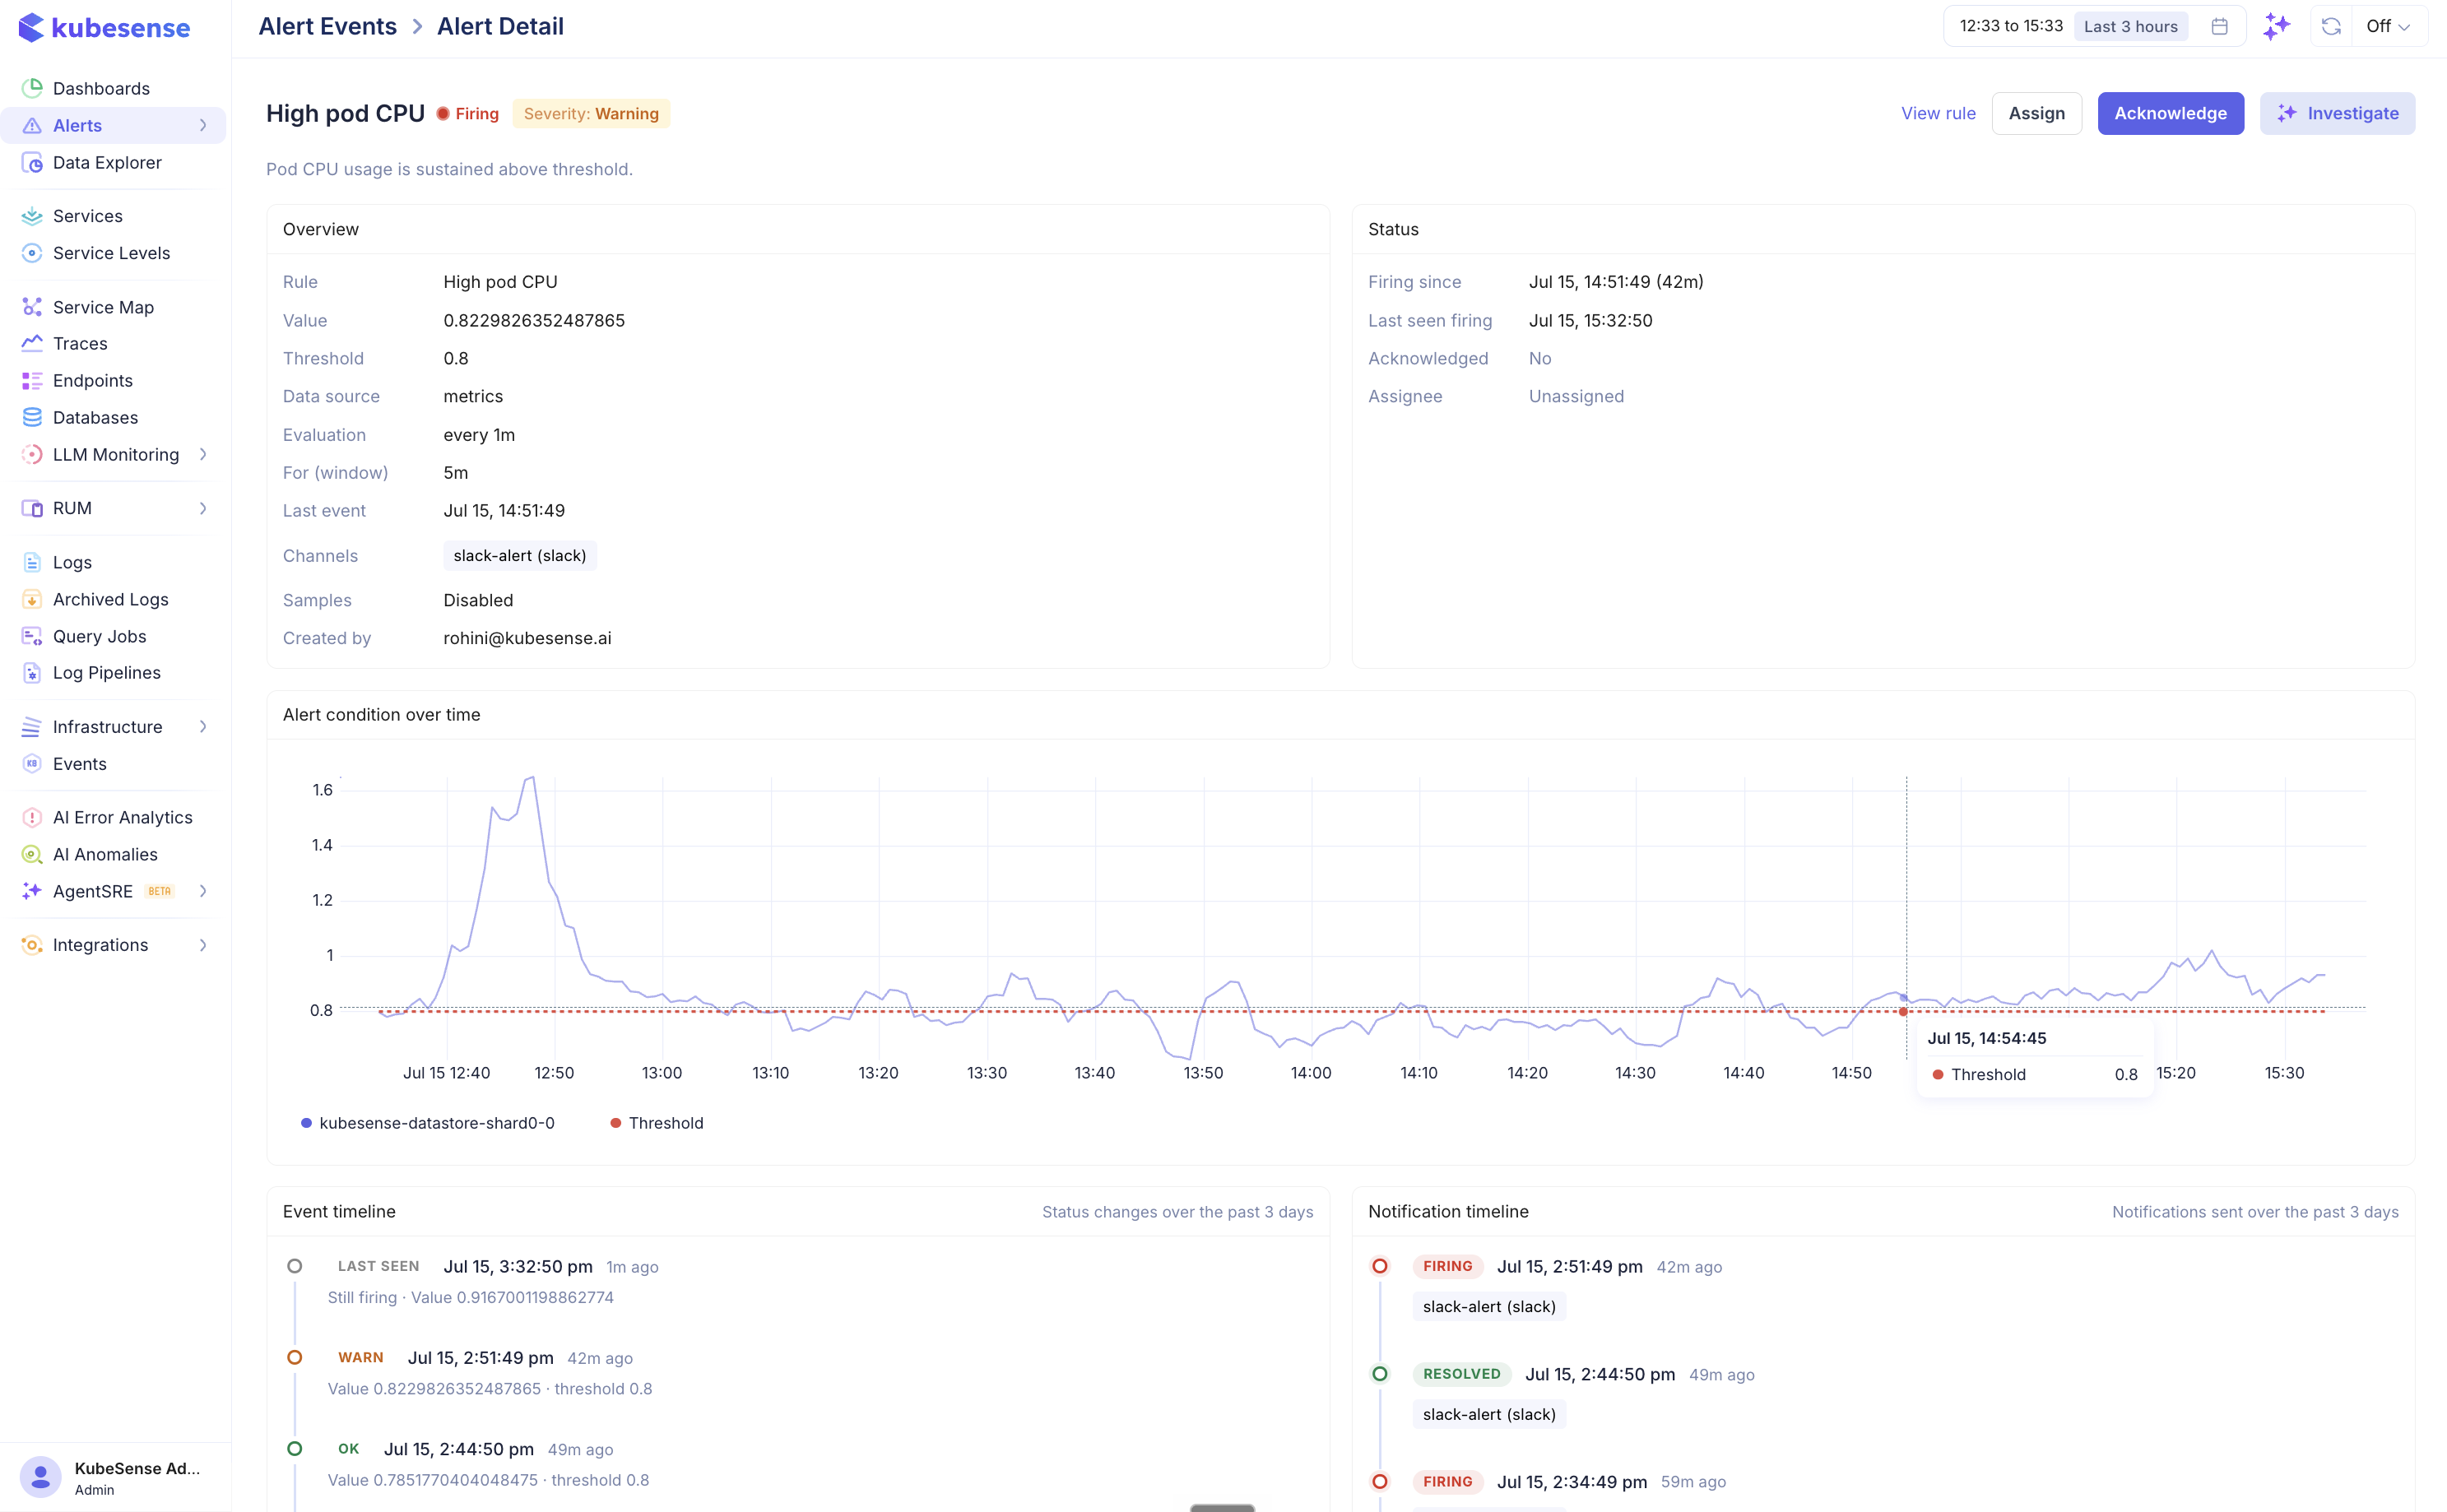
Clicking any row — or the View in Kubesense link in a Slack/Teams/Email/Chat notification — opens the detail page for that specific instance.
| Section | Content |
|---|---|
| Header | Status pill, severity, and actions: Acknowledge / Unacknowledge, Assign, View rule, Open dashboard (when the rule is linked to a dashboard panel), Runbook (when a runbook URL annotation is set) |
| Description | The rule's markdown description with placeholders resolved for this instance — the runbook, rendered. Sits directly under the title; long ones collapse behind a Show more toggle |
| Overview | Rule, current value vs threshold, data source, evaluation interval, lookback window, notification channels, sample attachment setting, creator |
| Status | Firing since (with duration), last seen firing, acknowledgement (by whom, when, note), assignee |
| Alert condition over time | Replays the rule's query scoped to this instance's labels, with the threshold drawn as a dashed line — see exactly what the evaluator saw |
| Event timeline | The instance's firing ⇄ resolved transitions over the past 3 days, each with the value and threshold at that moment |
| Notification timeline | When notifications were dispatched and to which channels |
| Incidents — same rule (all instances) | Puts this instance in context: a frequency chart of concurrent firing across all of the rule's instances (12h–30d ranges), stats for total incidents and currently firing, and a drillable list of sibling instances. Click a chart bar to narrow the list to that time bucket. |
| Labels | The instance's label set |
| Sample logs | When the rule has Attach samples enabled, the matching log/trace rows captured at fire time |
Rule detail page
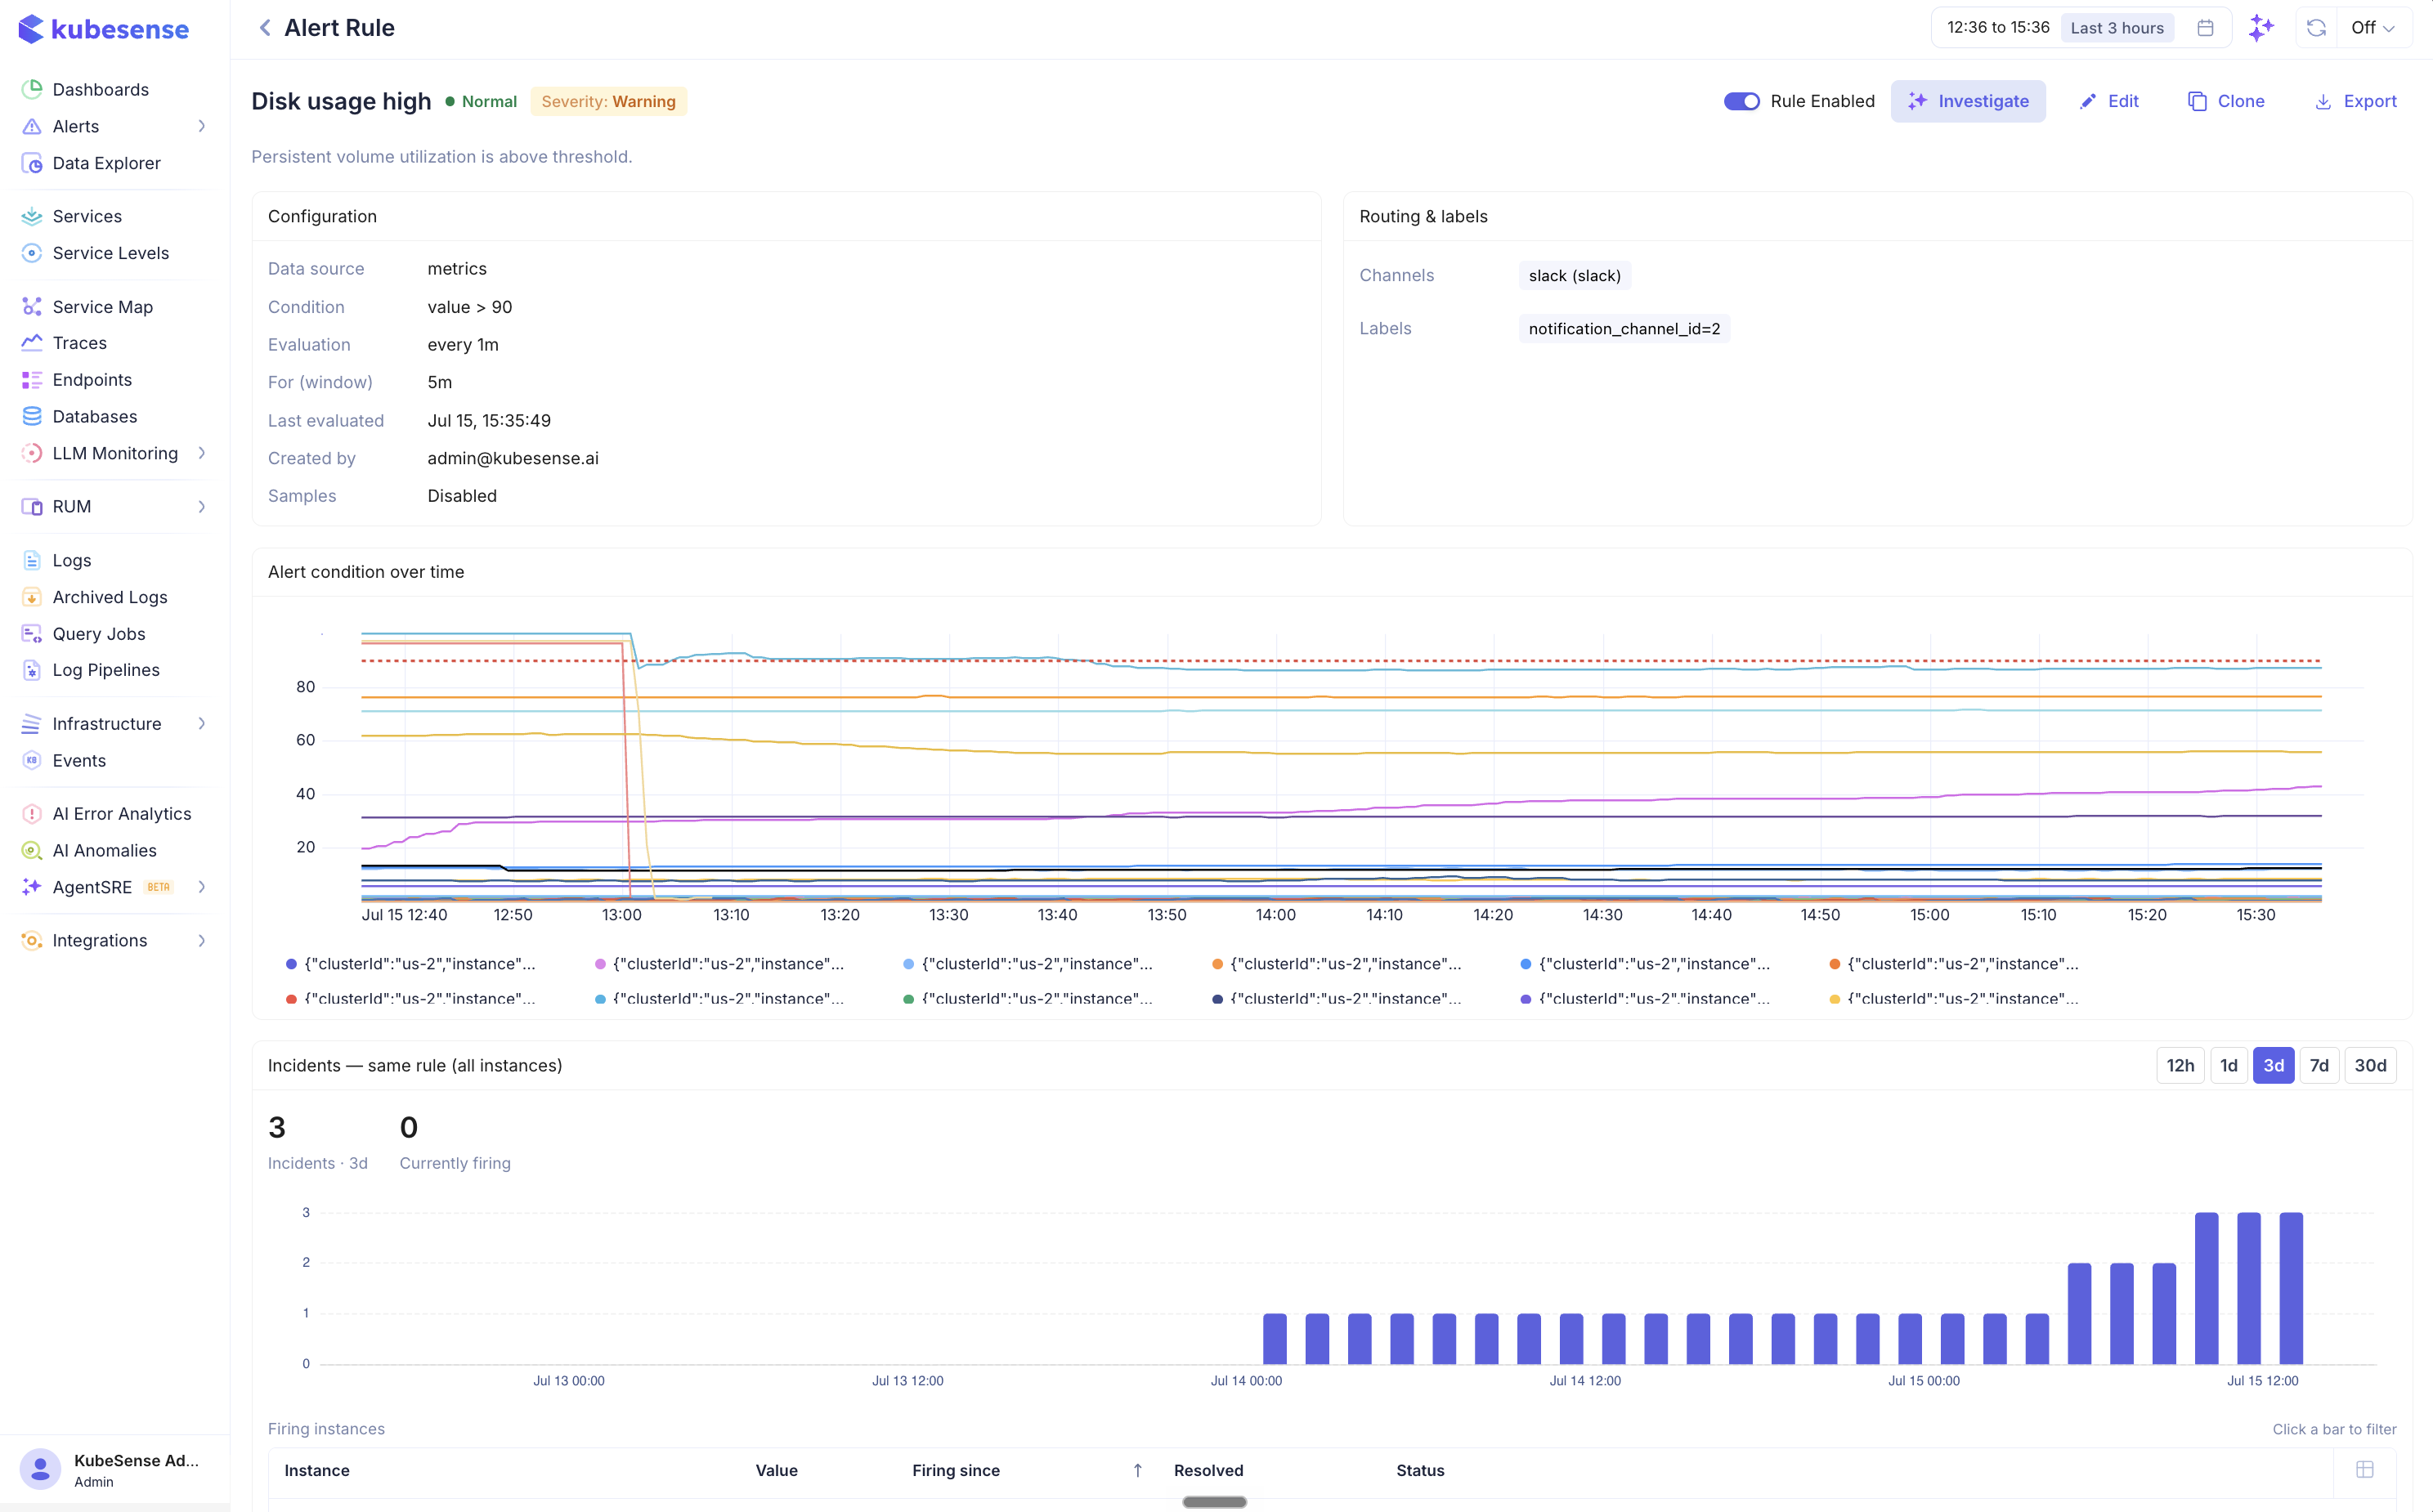
From the Alert Rules tab (or View rule on an alert), each rule has its own read-only detail page: its markdown description, the configuration summary (condition, evaluation cadence, window, samples), routing and labels, the live condition chart, and the same incidents view across all its instances. Header actions: enable/disable toggle, Edit, Clone, and Export (downloads the rule as re-importable JSON).