
Traces
The LLM Monitoring > Tracing view shows the individual requests received from Langfuse, OpenLIT, or another OTel-instrumented application.
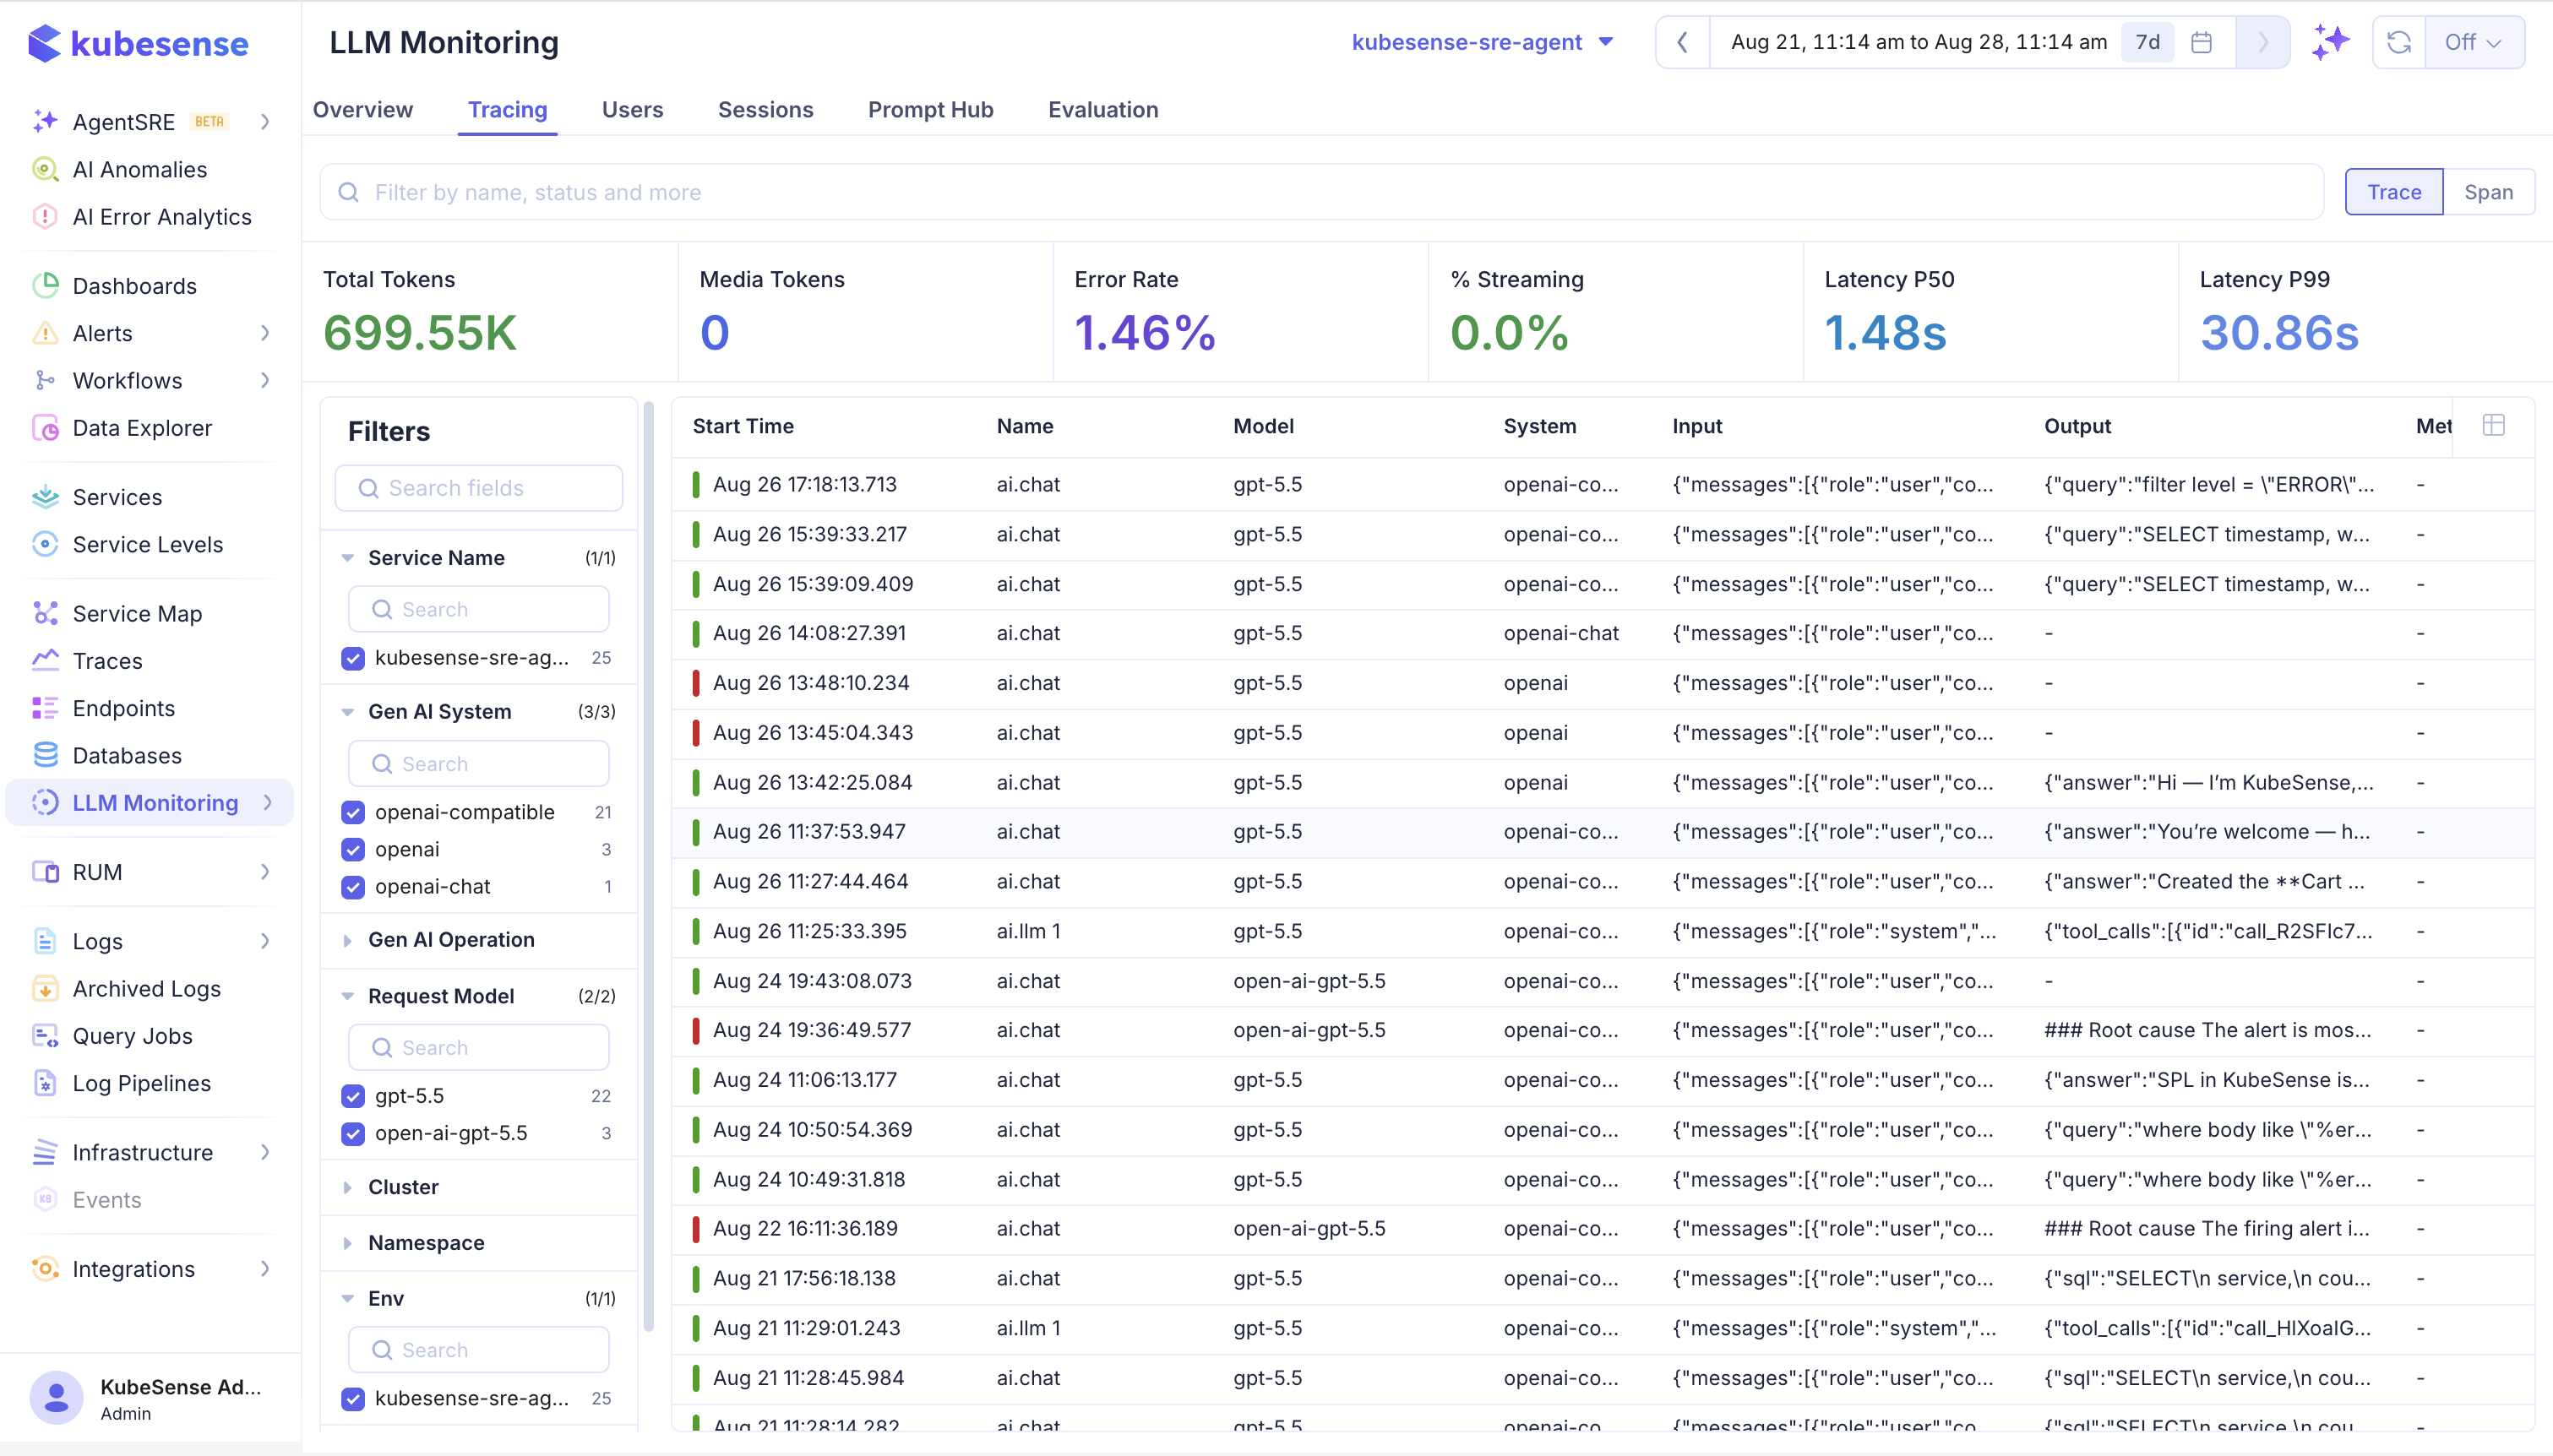
The tracing page is the main investigation surface for incoming LLM telemetry. Select an application and time range from the page header, then use the Trace or Span toggle to change the level of data shown.
Trace list
Filter and search by application, service, model, provider, operation, environment, user, session, status, and time range. Each result can include:
- Trace and span IDs, parent-child relationships, and duration
- Generation or span name and observation type
- Request and response model
- Input, output, token counts, and estimated cost
- User, session, conversation, tags, and metadata
- Status, error message, and finish reasons
The search field accepts a free-text search across trace information. The Filters panel provides searchable facets such as Service Name, Gen AI System, Gen AI Operation, Request Model, Cluster, Namespace, and Environment. Expand a facet to select one or more values; the count beside a value indicates how many records match it.
Trace summary metrics
The summary row above the table provides a quick view of the selected result set:
| Metric | Meaning |
|---|---|
| Total Tokens | Combined input, output, reasoning, cached, and other recorded token usage |
| Media Tokens | Audio and image token usage, when reported by the provider or SDK |
| Error Rate | Percentage of tracked records with an error status |
| % Streaming | Percentage of model calls marked as streaming |
| Latency P50 | Median trace latency |
| Latency P99 | High-tail trace latency for the slowest one percent |
Use these values to decide whether to investigate volume, usage, reliability, streaming behavior, or latency first. Summary metrics change with the selected time range, application, view, and filters.
Trace table columns
The trace table shows the start time, operation name, model, GenAI system, input, output, metadata, latency, tokens, and cost. A green or red marker beside the start time indicates a successful or failed record. Long input, output, and metadata values are truncated in the table; open the record to inspect the complete payload.
The Tokens and Cost cells provide a breakdown on hover. Token details can include input, output, audio, cached, and reasoning usage. Cost details can include input, output, cache-read, and reasoning cost. These values explain why the row total may differ between two calls to the same model.
Trace details
Open a trace to inspect its span tree. A trace can contain the full LLM workflow, including prompt preparation, model generation, retrieval or vector database calls, tool execution, and post-processing. The parent span relationship is preserved from the incoming OTel payload.
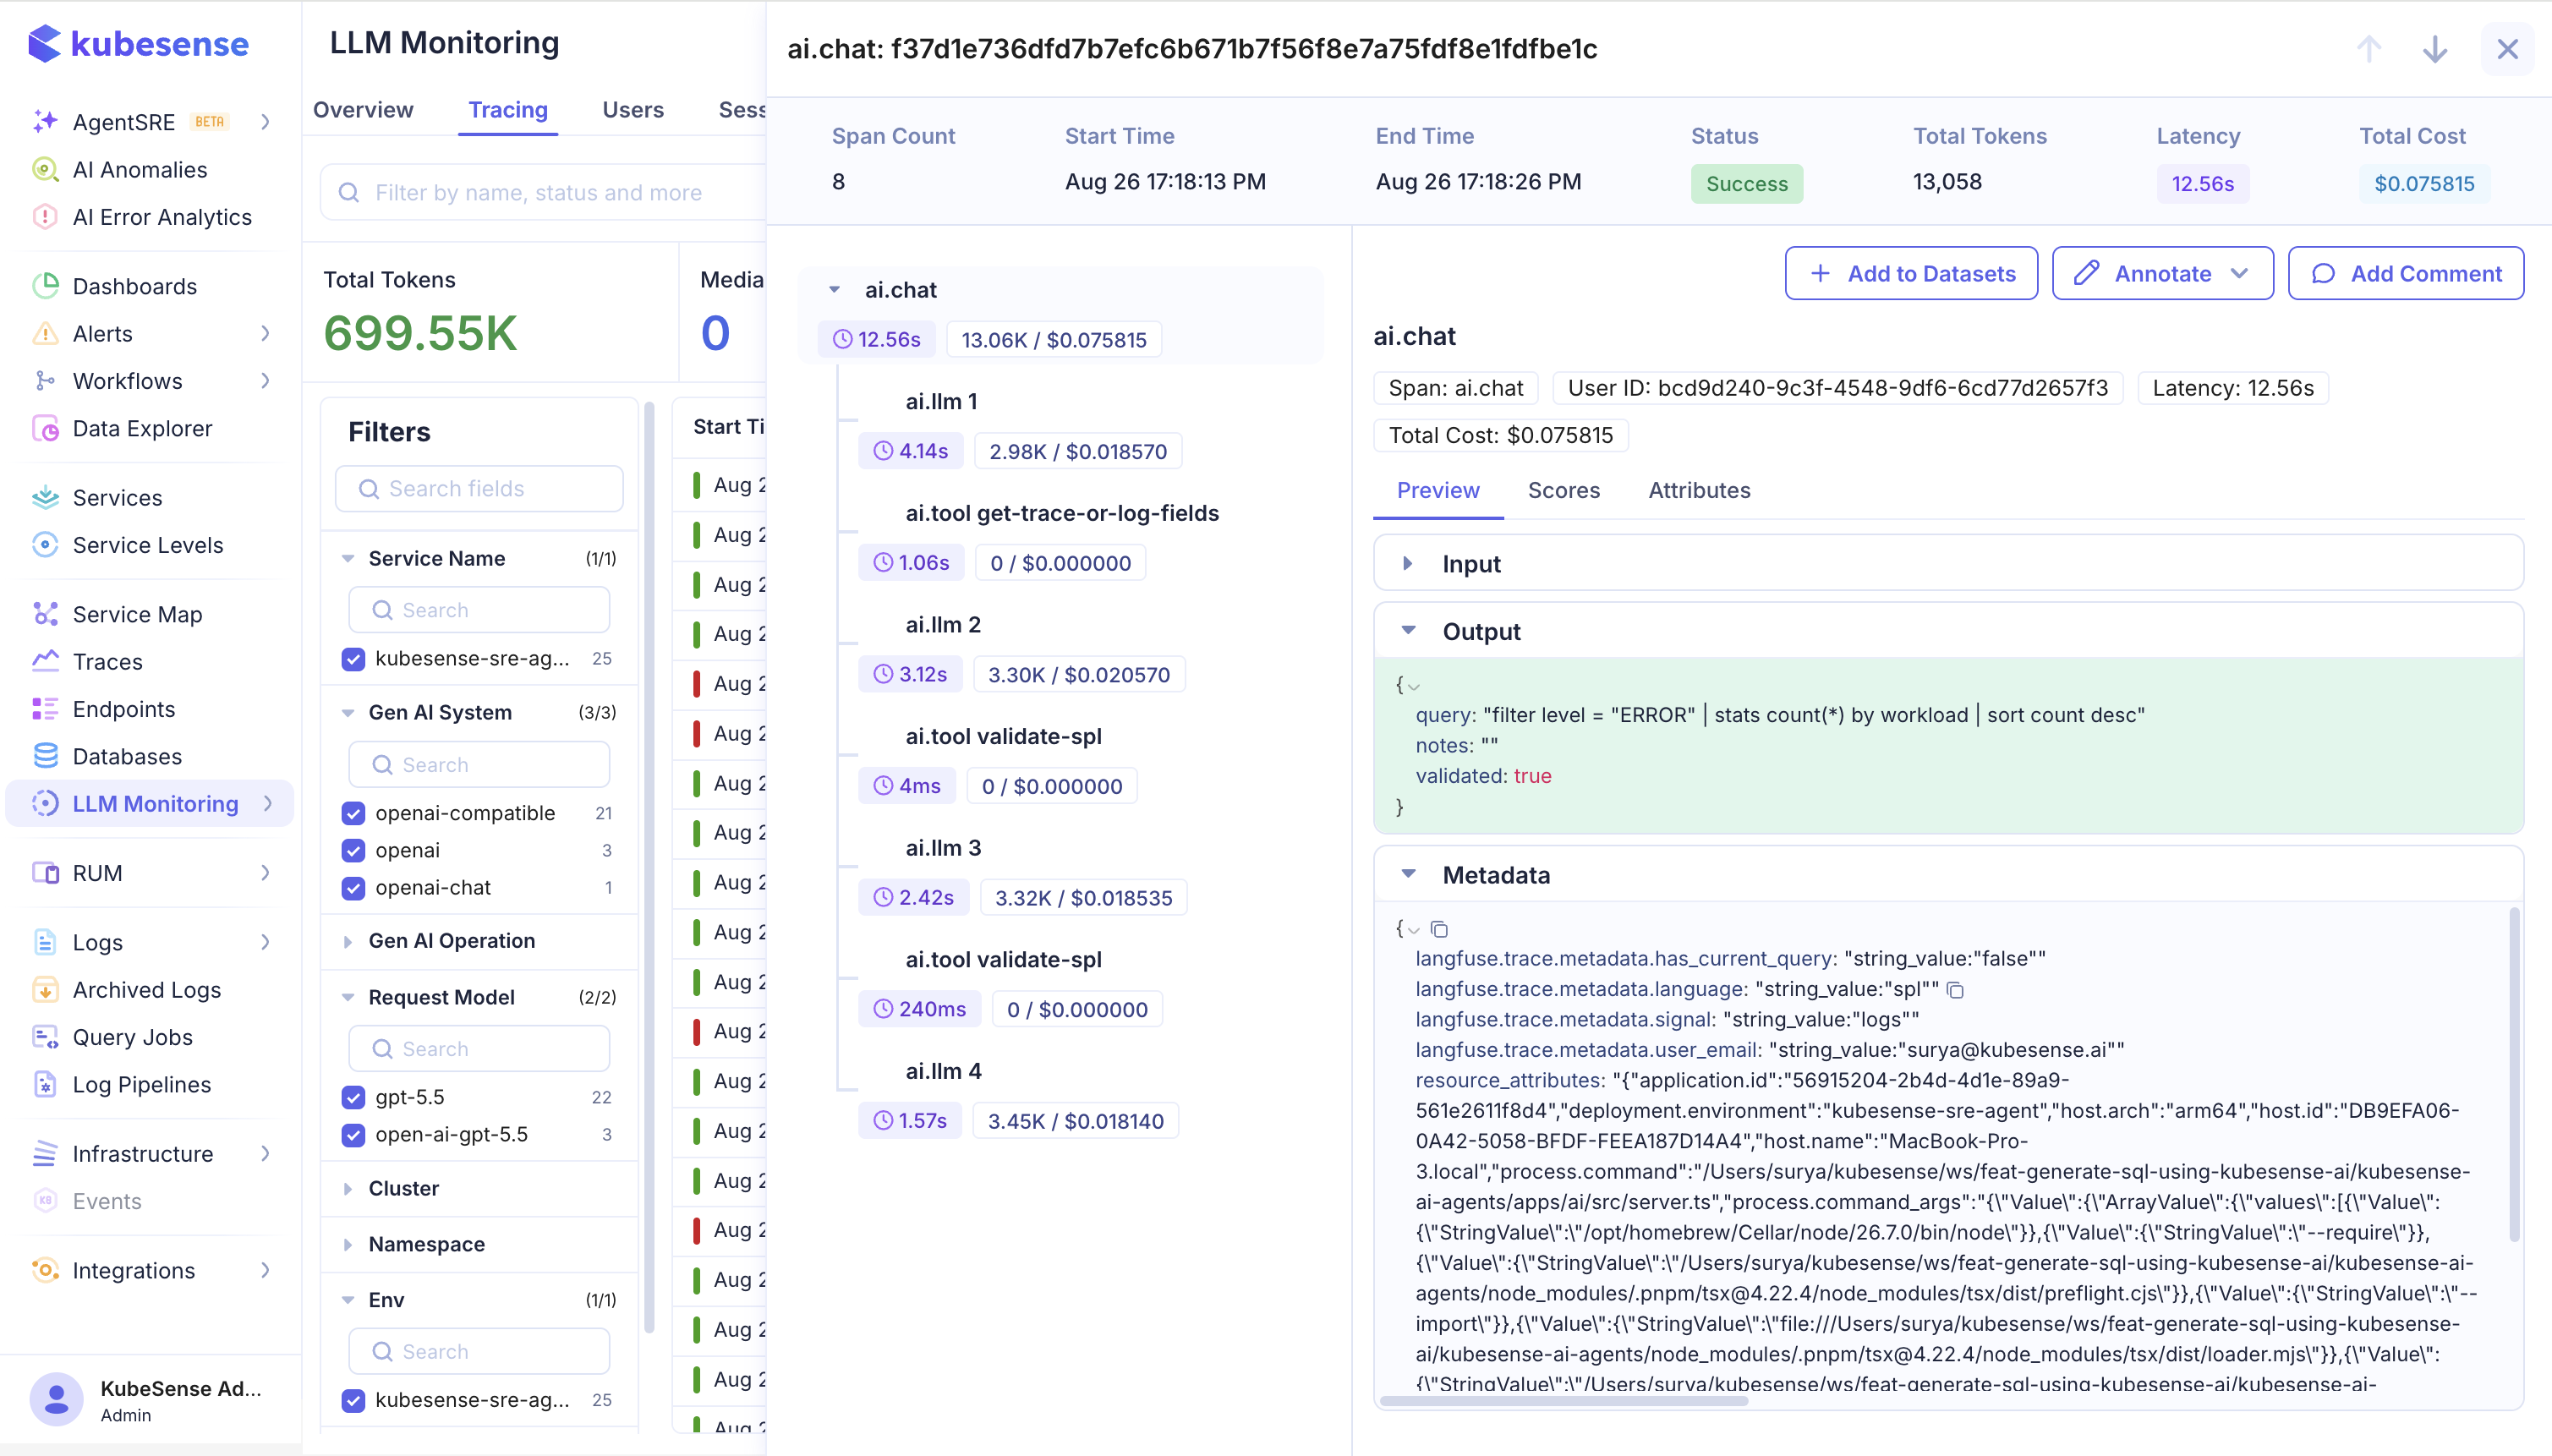
The detail view combines the trace summary with the operation hierarchy. The header shows the span count, start and end times, status, total tokens, latency, and total cost. The left side displays the parent operation and its child generations or tools, with duration and token/cost badges for each node.
The right side shows the selected operation. Use the available actions to add the trace to a dataset, annotate it, or add a comment. The detail tabs provide:
| Tab | Contents |
|---|---|
| Preview | Formatted input, output, and metadata; JSON and Markdown content are rendered appropriately |
| Scores | Scores attached to the trace or observation |
| Attributes | OTel resource, scope, provider, SDK, and other unmapped attributes |
Expand Input, Output, or Metadata to inspect the payload. Metadata can show user context, application context, Langfuse-compatible fields, and resource attributes that help explain how the span was produced.
Generation details may include streaming state, time to first token, temperature, token limits, tool calls, response ID, and provider-specific attributes. KubeSense keeps unmapped attributes available as additional span attributes.
Trace view versus span view
Use Trace view to understand the complete request and its total cost, latency, and child operations. Use Span view to find a specific generation, retrieval step, tool call, or framework operation across traces. Span view is useful when a single operation type is the source of a regression.
Investigate an error
- Filter the list by Status or use the error summary metric to confirm the scope of the problem.
- Sort or scan the table by start time, latency, tokens, or cost.
- Open a failed trace and locate the red operation in the span tree.
- Inspect the selected span's status message, input, output, attributes, and provider details.
- Compare the failing operation with a successful trace using the same model and environment.
- Add the trace to a dataset or annotation queue when it should be reviewed or used for regression testing.
Content and privacy
Input and output content is stored when the SDK exports it.
OpenLIT captures message content by default. Disable it with the OpenTelemetry GenAI opt-in variable, or bound it with a maximum length:
export OTEL_INSTRUMENTATION_GENAI_CAPTURE_MESSAGE_CONTENT=false
export OPENLIT_MAX_CONTENT_LENGTH=2000
Langfuse captures content on the observations you create. Redact it with the SDK's masking hooks: Langfuse(mask=...) covers values set through the Langfuse APIs, and Langfuse(mask_otel_spans=...) runs at export time and also covers spans produced by third-party OpenTelemetry instrumentation. In JavaScript, pass mask to LangfuseSpanProcessor. Setting LANGFUSE_OBSERVE_DECORATOR_IO_CAPTURE_ENABLED=false stops the @observe decorator from recording function arguments and return values.
Choose the capture setting before production traffic is sent. Redacting content in the application or SDK processor is recommended when prompts or completions contain sensitive data.
Source labels
KubeSense derives the source from resource attributes only: telemetry.sdk.name set to langfuse or openlit, or the presence of langfuse.sdk.name or openlit.sdk.name. Everything else is labelled otel.
OpenLIT sets telemetry.sdk.name=openlit automatically. The Langfuse SDK does not override telemetry.sdk.name, so Langfuse traffic appears as otel unless you add telemetry.sdk.name=langfuse to OTEL_RESOURCE_ATTRIBUTES. Use the service name or the langfuse.* attributes when you need to separate workloads reliably.
Span types
The observation type comes from the langfuse.observation.type attribute. The Langfuse SDKs set it from as_type in Python and asType in JavaScript:
| Type | Purpose |
|---|---|
span | A unit of work inside a trace |
generation | A model request and its response |
event | A discrete point-in-time event |
agent | A step that decides application flow and orchestrates tools |
tool | A function or external tool invocation |
chain | A link between application steps, such as retriever output feeding a model call |
retriever | A data-retrieval step that queries a knowledge source |
embedding | An embedding-generation call, with model and token tracking |
evaluator | A step that assesses the quality of a model output |
guardrail | A check that protects against malicious or disallowed content |
Spans from OpenLIT and other OTel instrumentation do not carry this attribute. KubeSense classifies them from the GenAI attributes instead, using gen_ai.operation.name for the operation and gen_ai.type for the category. Unrecognized attributes remain available in the span's additional attributes so instrumentation can evolve without losing data.
What to inspect in a slow trace
Check the waterfall order first. Then compare:
- Time to first token versus total duration for streamed responses
- Prompt and completion token counts
- Model requested versus model returned
- Retrieval result count and vector database duration
- Tool calls and their return status
- Finish reason, status message, and provider response ID
For repeated issues, filter by model, operation, environment, or release and save a representative trace for evaluation or annotation.
Trace retention and payload size
LLM content can be substantially larger than ordinary trace attributes. Keep prompts, outputs, tool definitions, and metadata bounded in the application. Use sampling for high-volume, low-value traffic and disable message capture when content is not needed for debugging.