
Conversations
Conversations is the chat experience inside Agent SRE. Ask questions about your infrastructure, services, logs, traces, metrics, and alerts in plain language, and Agent SRE answers using your actual observability data — running the queries for you and returning results inline. It's the fastest way to investigate without writing queries or switching between dashboards.
Conversations is one of the two tabs in Agent SRE, alongside Investigations. External sources such as Confluence, Jira and custom MCP servers are connected on the Integrations page.
Starting a Conversation
Open Agent SRE and select the Conversation tab. You're greeted with a welcome screen and a single input box to get started.
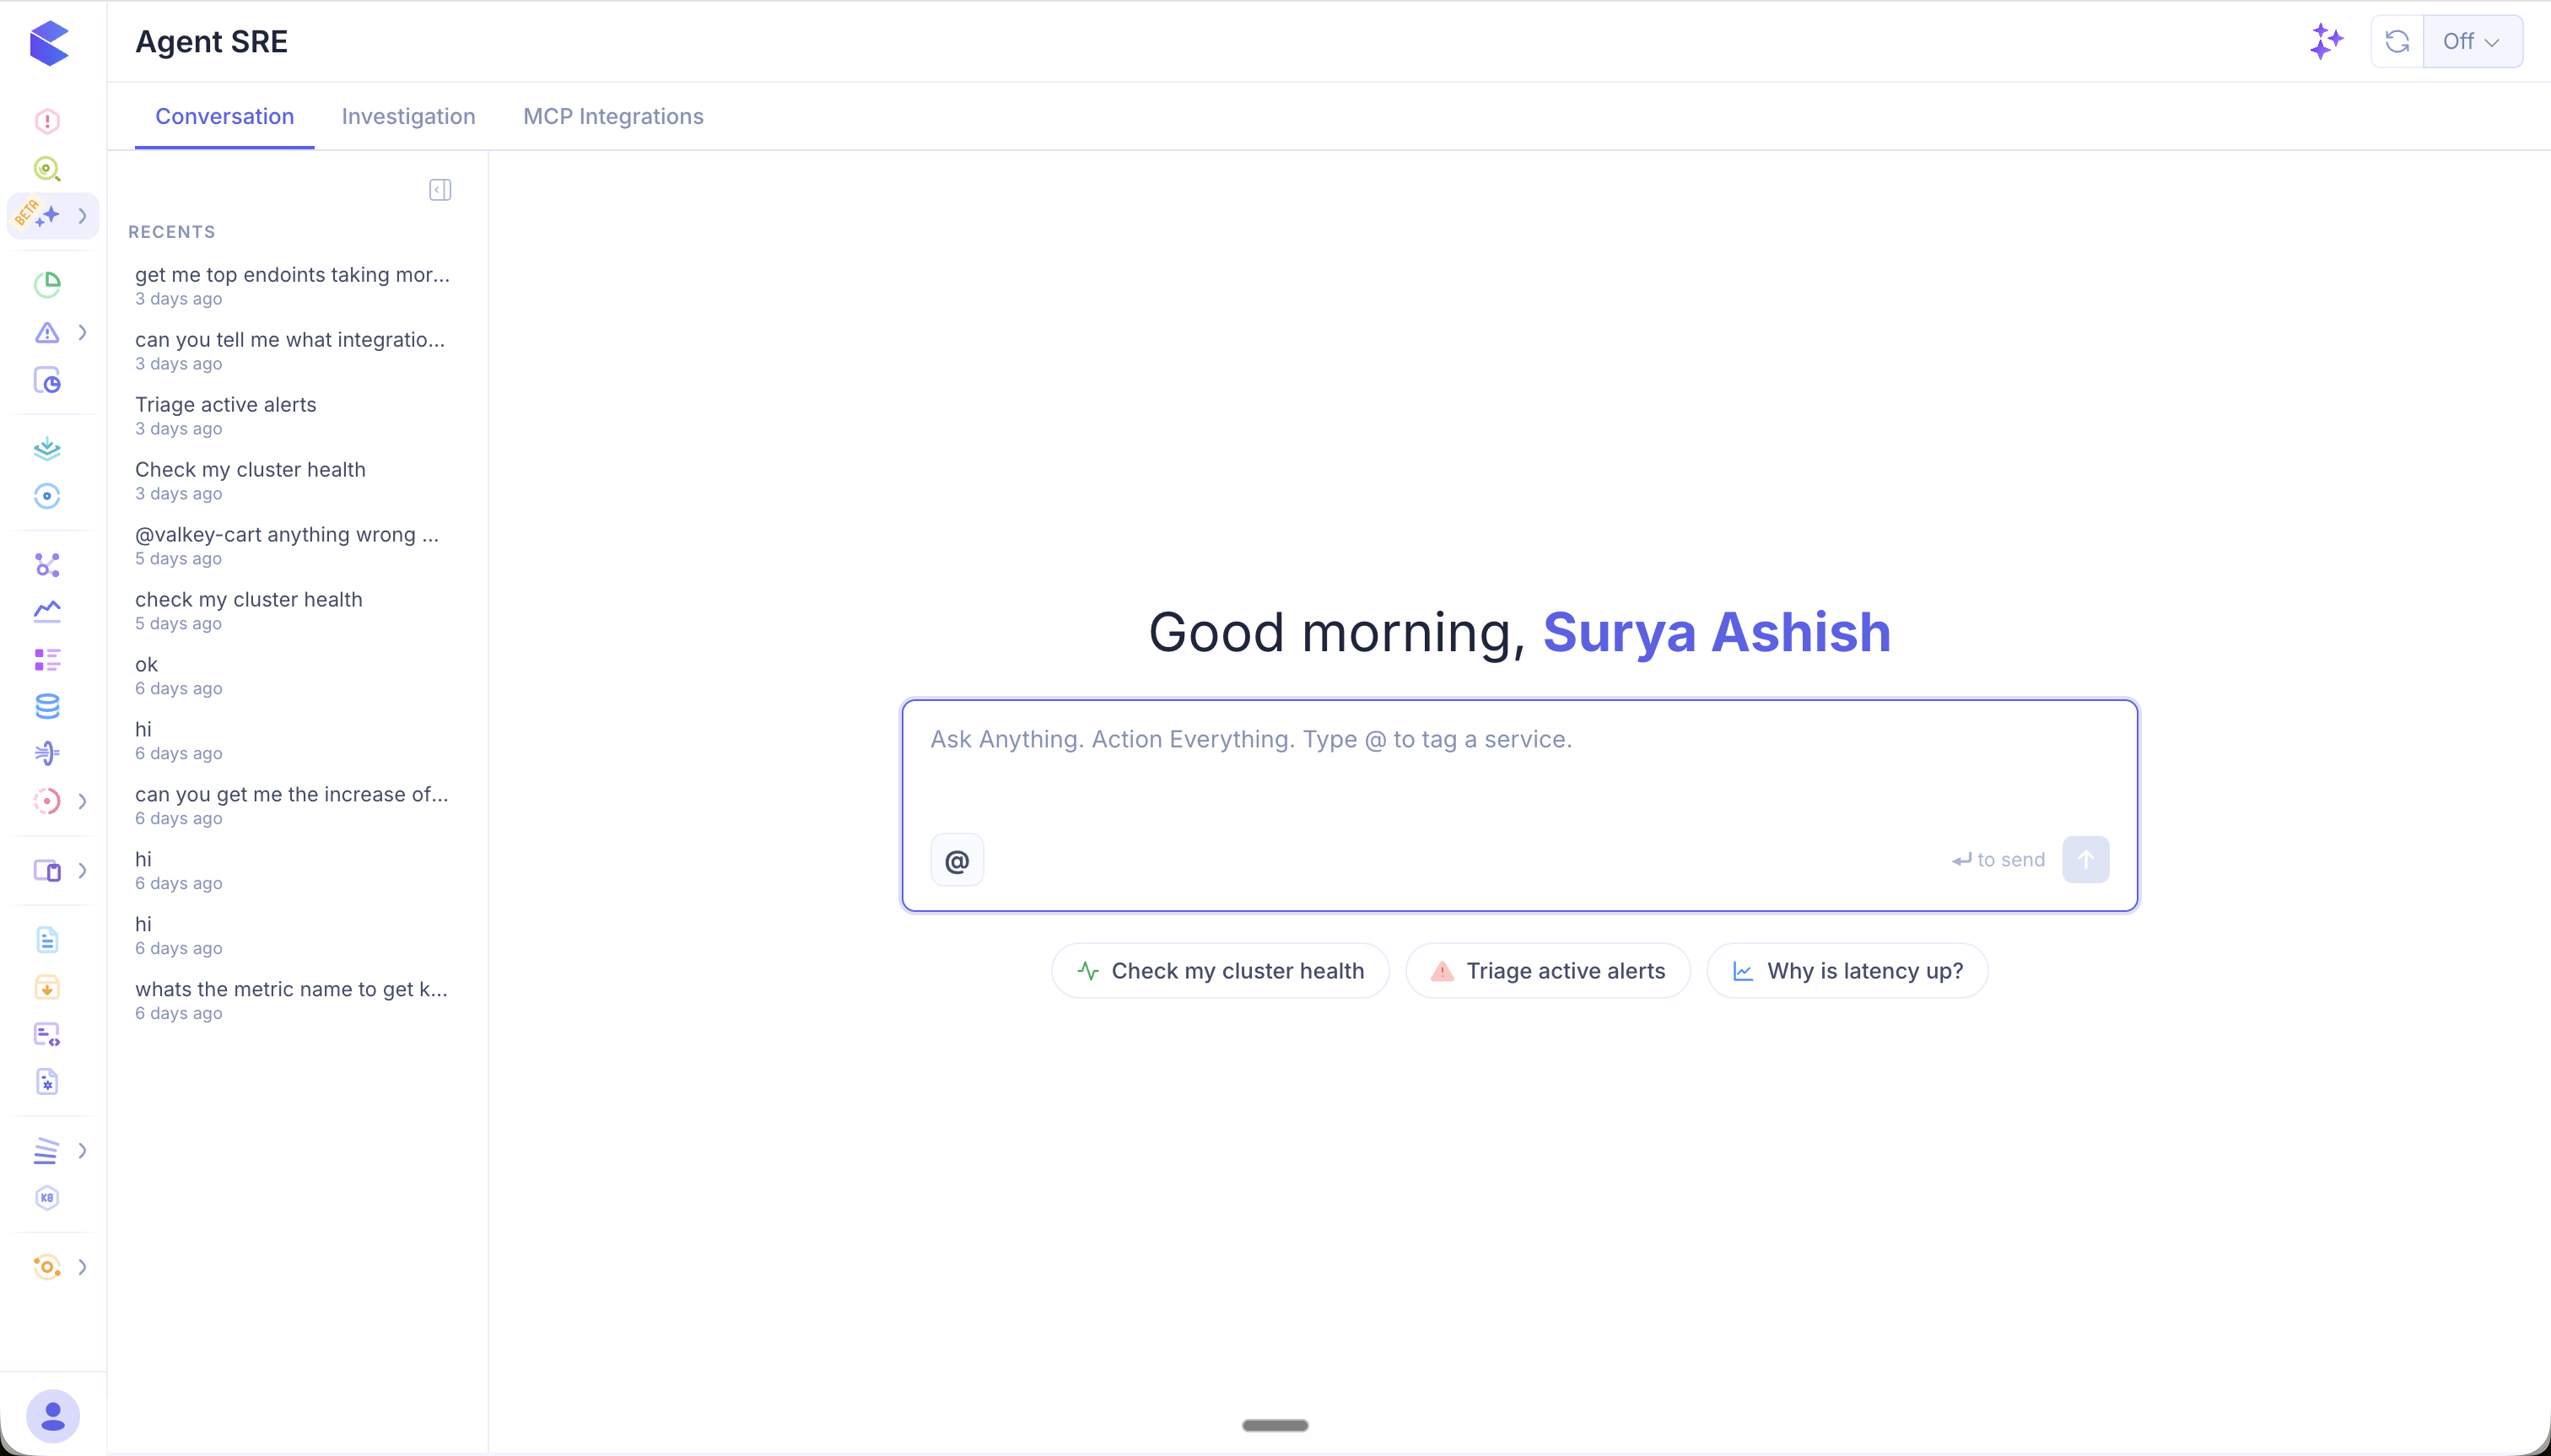
Type your question into the box — "Ask Anything. Action Everything." — and press Enter to send.
Quick-start prompts
Below the input box are one-click prompts for common tasks, so you can start an investigation without typing:
- Check my cluster health
- Triage active alerts
- Why is latency up?
Click any prompt to run it immediately.
Tagging a service
Type @ in the input box to tag a specific service and scope your question to it. For example, @valkey-cart is anything wrong with it? focuses the conversation on the valkey-cart service. Tagging helps Agent SRE target the right telemetry and return more relevant answers.
Working in a Conversation
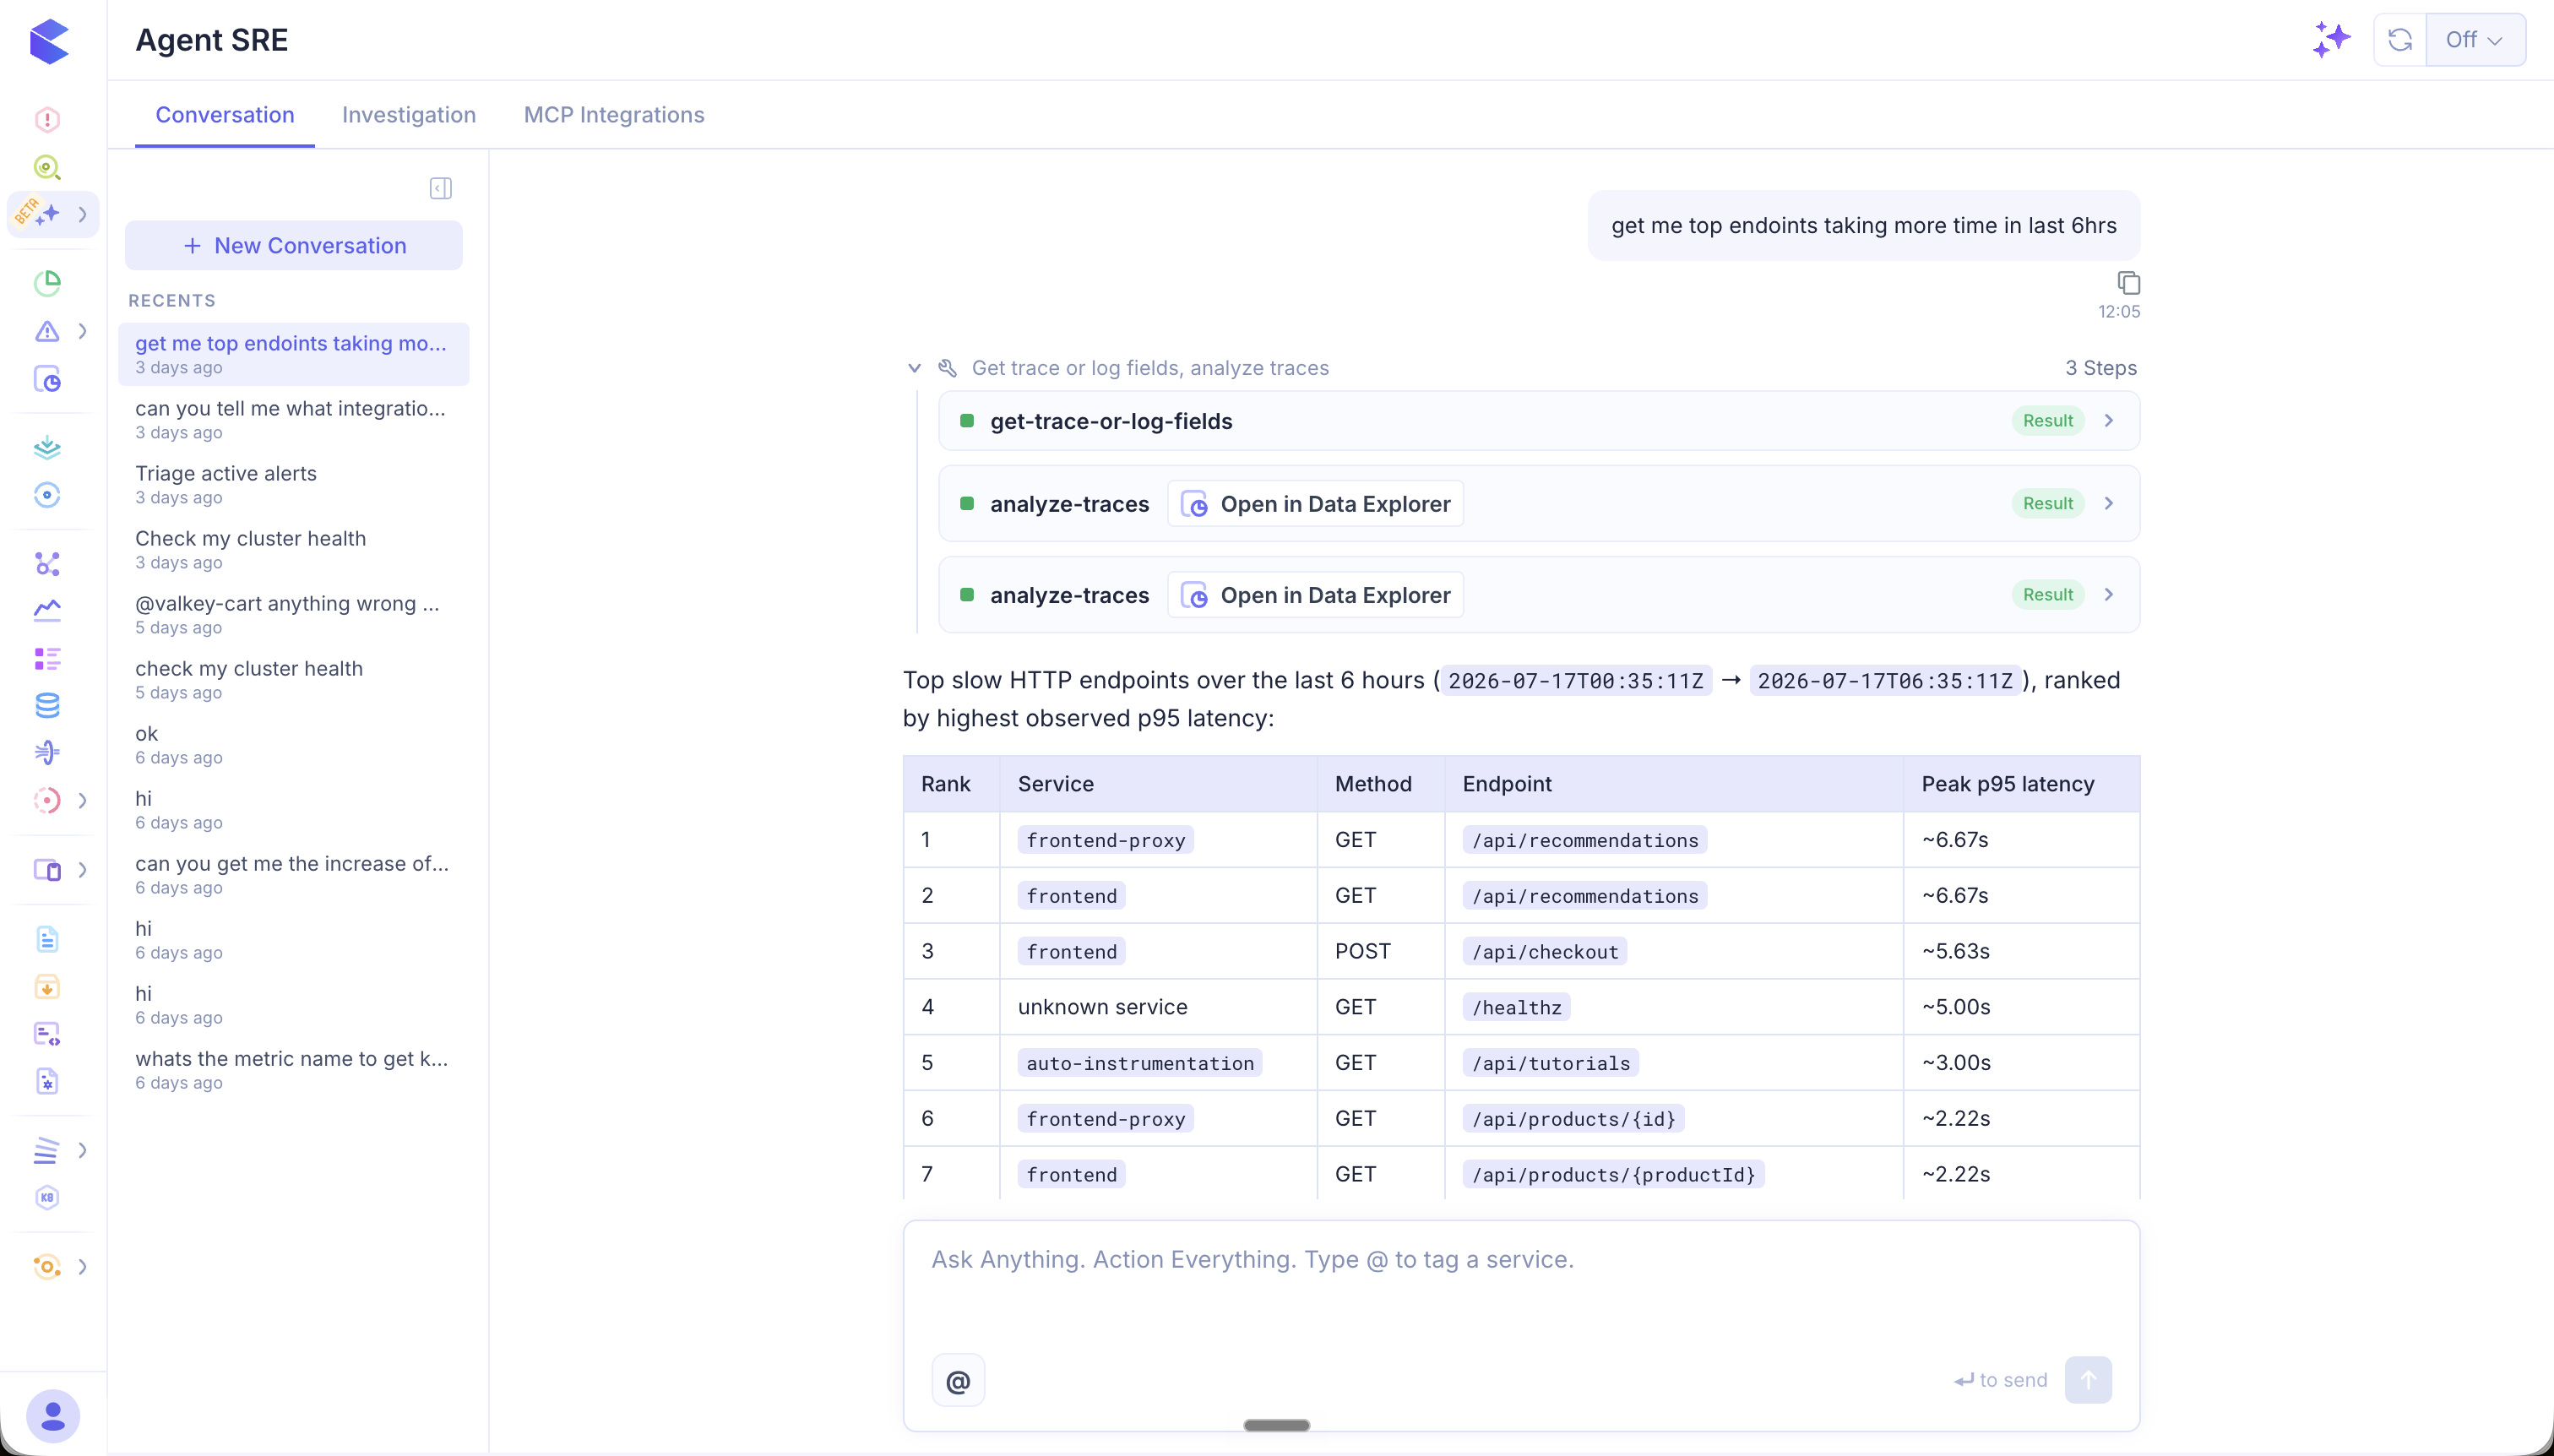
Once you send a message, the conversation opens into a dedicated chat view. Your question appears at the top, and Agent SRE responds below with its reasoning, the steps it ran, and the results.
Steps
Agent SRE breaks each answer into the steps it took to reach it. Each step is expandable and shows the underlying tool it called — for example get-fields or analyze-traces — along with a Result you can open to inspect the raw data behind the answer.
This makes every answer transparent: you can see exactly which queries ran and verify the data yourself, rather than trusting a black-box response.
Open in Data Explorer
Where a step queries logs, traces, or metrics, an Open in Data Explorer button lets you jump straight into the full Data Explorer with that query pre-loaded. Use it to dig deeper, adjust filters, change the time range, or visualize the results.
Results
Agent SRE presents its findings inline — as a natural-language summary and, where relevant, as formatted tables. For example, asking "get me top endpoints taking more time in last 6hrs" returns a ranked table of the slowest endpoints with their service, HTTP method, path, and peak p95 latency.
Continuing the Conversation
The input box stays available at the bottom of every conversation. Ask follow-up questions to refine or extend the investigation — Agent SRE keeps the context of the conversation, so you can build on previous answers naturally.
Recents
The left sidebar lists your Recents — every past conversation, labeled by its opening question and timestamped (e.g. "3 days ago"). Click any entry to reopen that conversation and pick up where you left off.
Use + New Conversation at the top of the sidebar to start fresh at any time. You can collapse the sidebar to give the chat more room.
Example Questions
Conversations can answer questions across all your observability data:
| Category | Example Questions |
|---|---|
| Cluster health | "Check my cluster health", "Are all my nodes healthy?" |
| Alerts | "Triage active alerts", "What's firing right now?" |
| Latency & performance | "Why is latency up?", "Get me the top endpoints taking more time in the last 6 hours" |
| Services | "@valkey-cart is anything wrong with it?", "Show me errors for the checkout service" |
| Integrations | "Can you tell me what integrations are configured?" |
Tips
- Tag services with
@to scope questions and get more precise answers. - Expand the steps to see exactly how Agent SRE reached its answer and to verify the underlying data.
- Use Open in Data Explorer when you want to take an answer further with full querying and visualization.
- Ask follow-ups — the conversation retains context, so you don't need to repeat details.