
Investigations
Investigations is the deep-analysis experience inside Agent SRE. Where Conversations is an interactive back-and-forth chat you drive yourself, an Investigation is an autonomous, multi-step analysis: from a single alert, Agent SRE forms competing hypotheses, tests each against your telemetry, and works the problem to a root-cause conclusion with a confidence score — no manual querying required.
Investigations is one of the two tabs in Agent SRE, alongside Conversations. External sources such as Confluence, Jira and custom MCP servers are connected on the Integrations page.
Standing notes about your environment, which every investigation reads before it starts, live in Investigation Settings under the gear icon on this tab.
Conversations vs. Investigations
- Conversations — quick, interactive questions and follow-ups where you steer each step.
- Investigations — you hand Agent SRE a symptom (a firing alert), and it runs an end-to-end root cause analysis on its own, then presents its reasoning and conclusion.
The Investigation list
Open Agent SRE and select the Investigation tab to see every investigation that has been run.
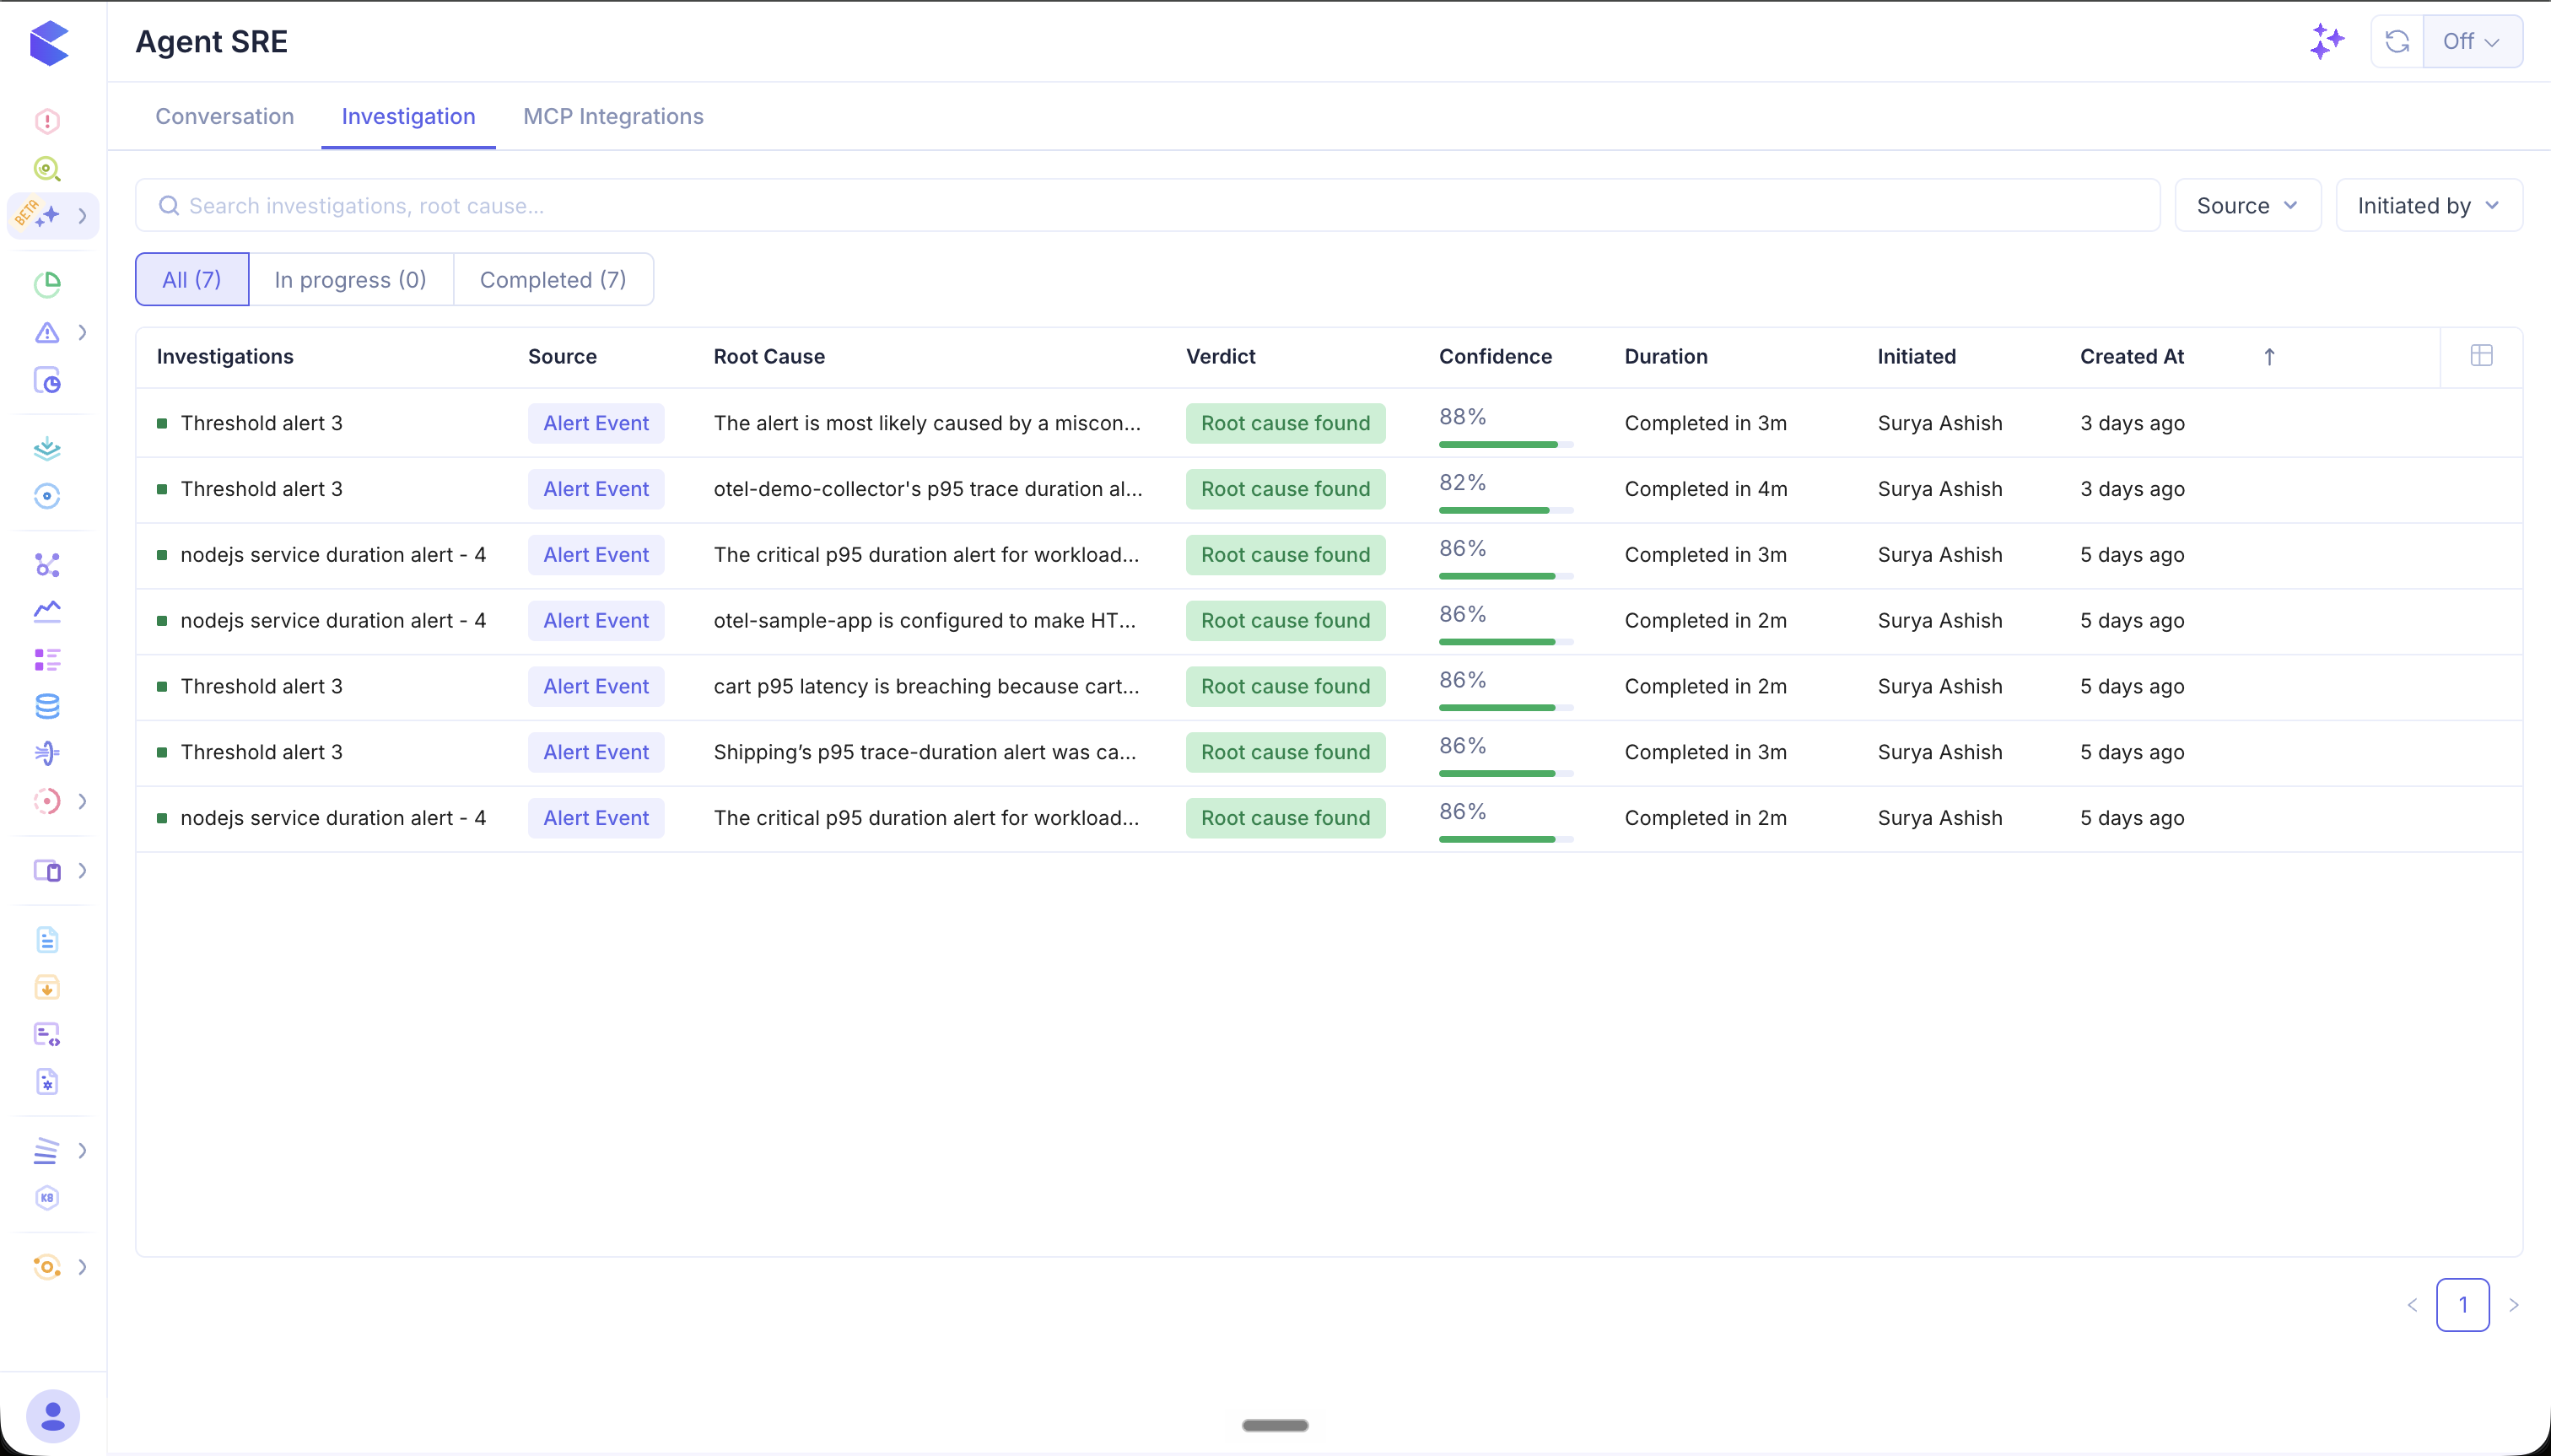
- Search — find investigations by name or root cause text.
- Filters — narrow by Source and Initiated by.
- Status tabs — switch between All, In progress, and Completed.
Each row summarizes one investigation:
| Column | Description |
|---|---|
| Investigations | The investigation name (from the alert it was started from) |
| Source | What triggered it — e.g. an Alert Event |
| Root Cause | A one-line summary of the conclusion |
| Verdict | The outcome, e.g. Root cause found |
| Confidence | How confident Agent SRE is in the conclusion, as a percentage |
| Duration | How long the investigation took (e.g. Completed in 3m) |
| Initiated | Who started it |
| Created At | When it was run |
Click any row to open the full investigation.
Starting an Investigation
Investigations are launched from a firing alert — either a single alert event or an alert rule.
From an alert event
Open an alert from Alert Events to see its detail page, then click Investigate in the top-right actions.
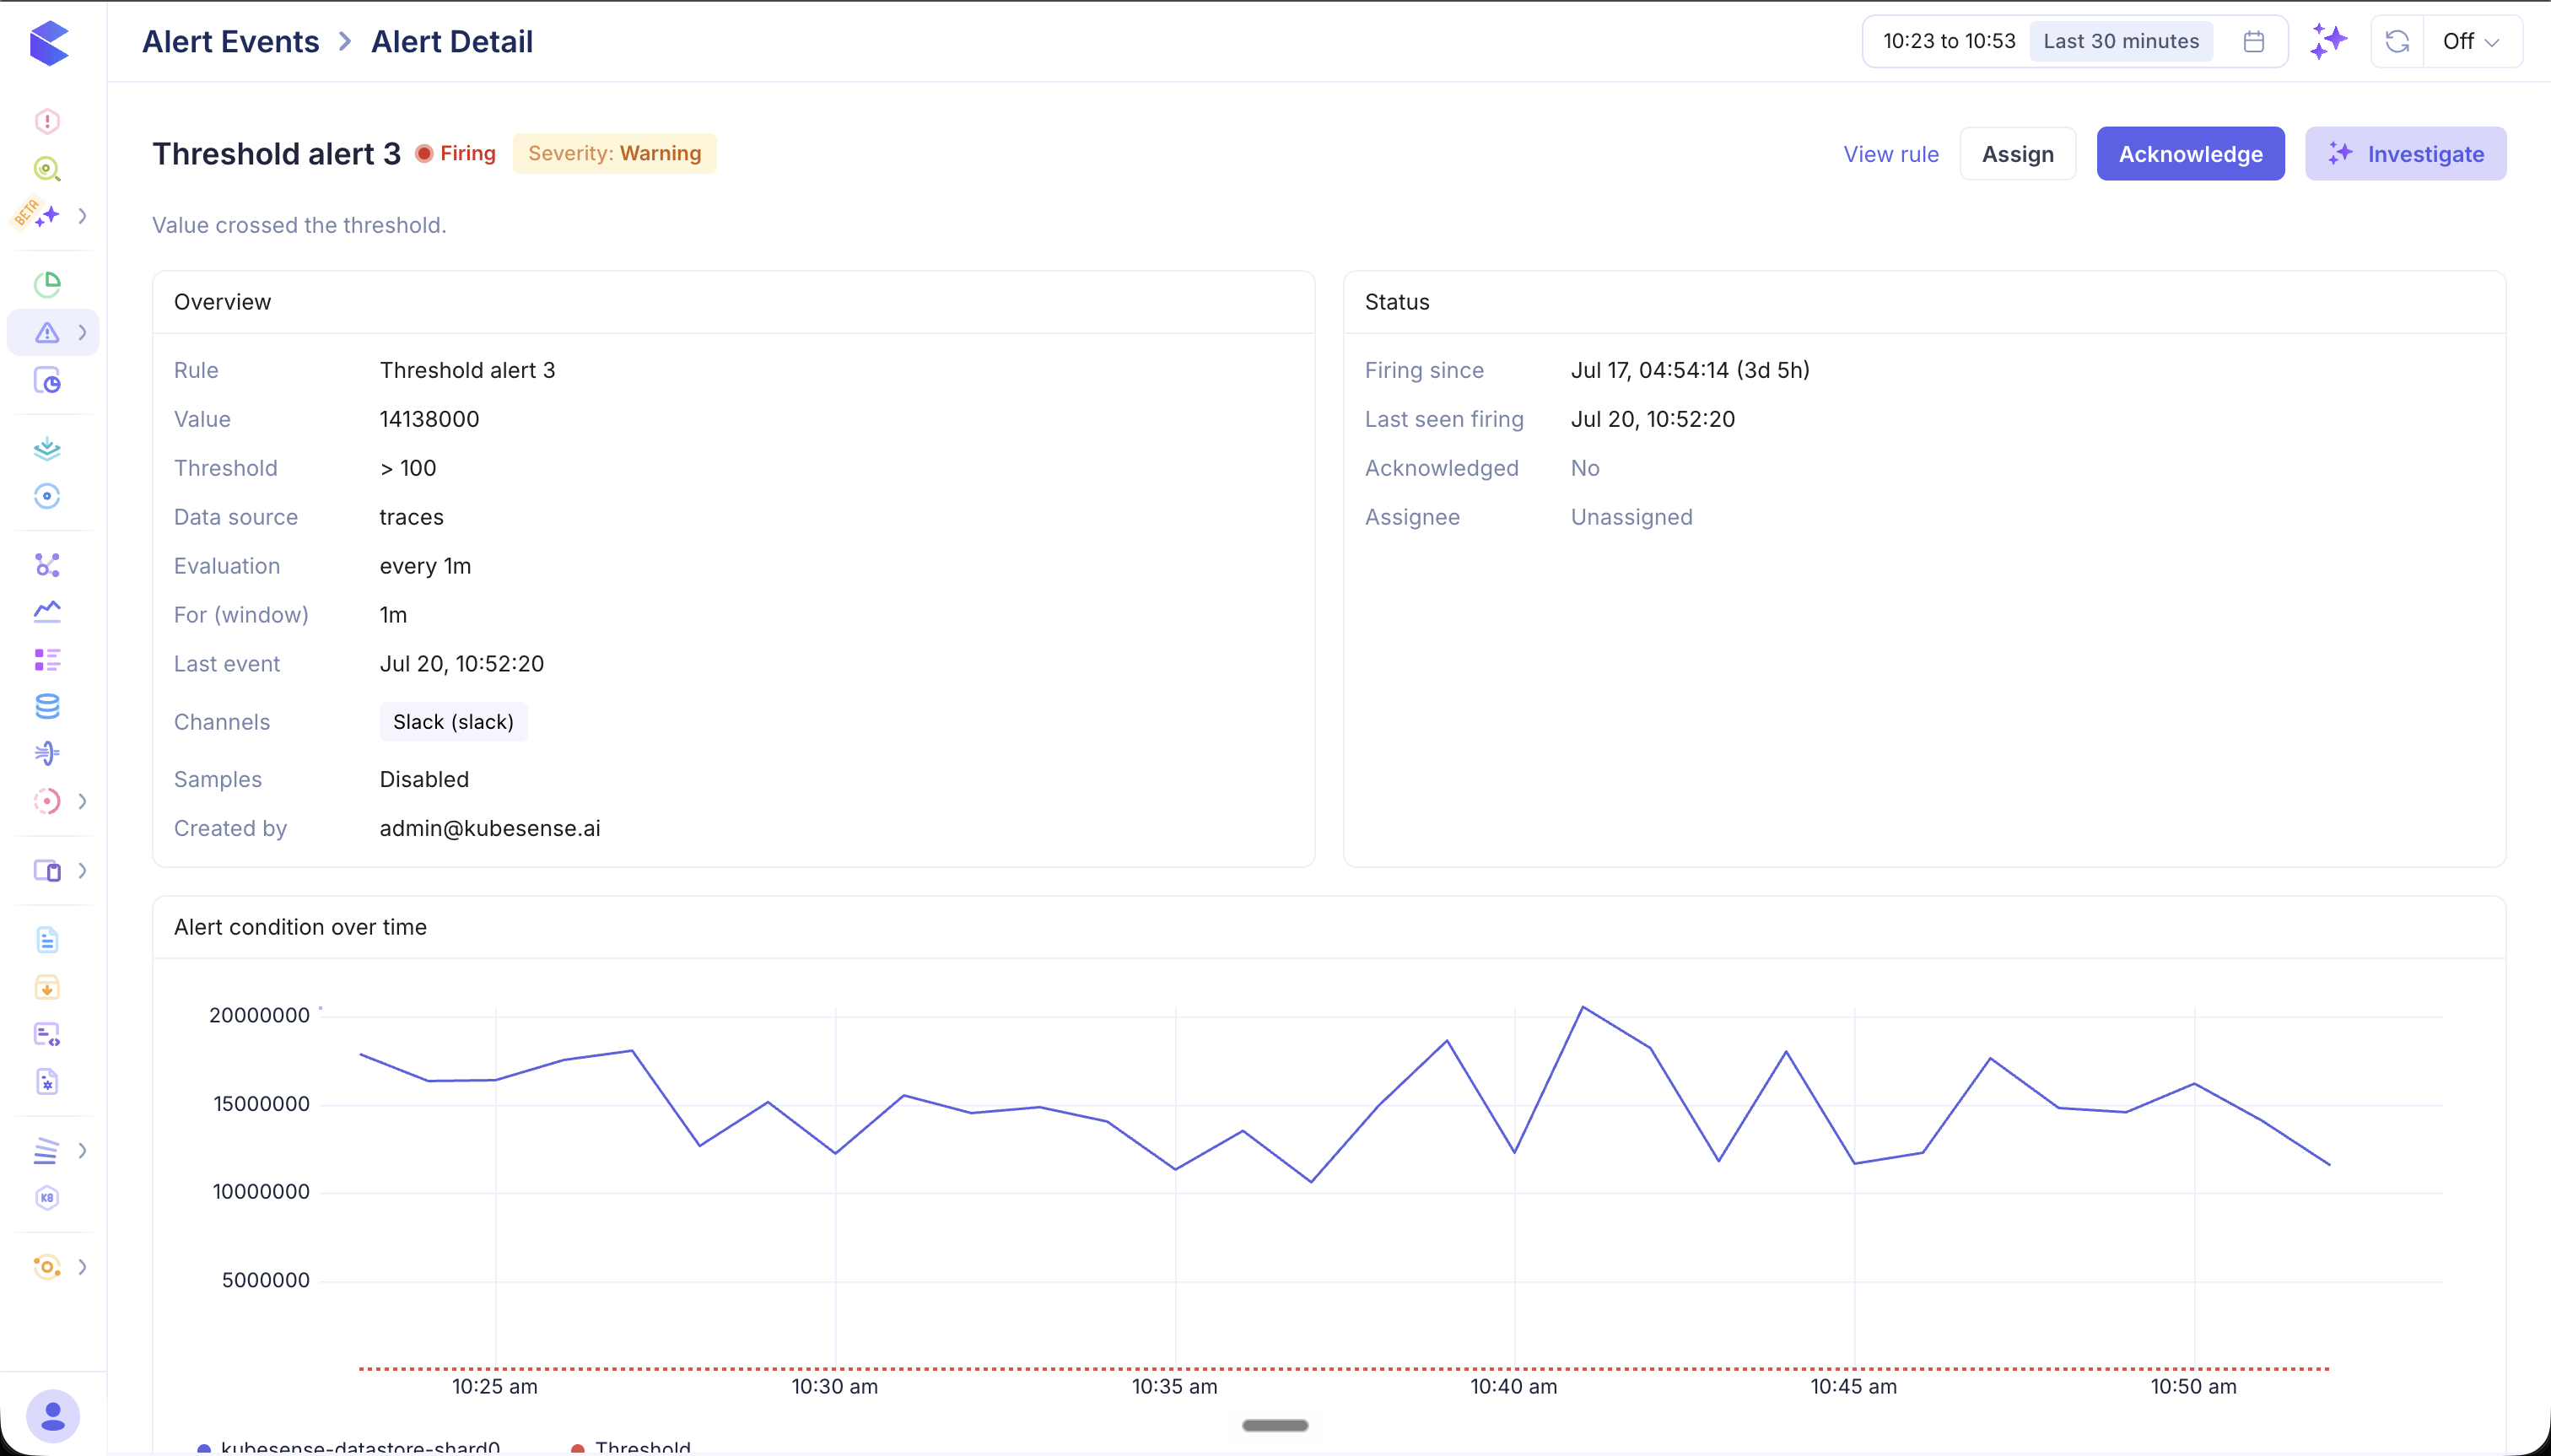
Agent SRE starts an investigation scoped to that specific firing event, using the alert's rule, threshold, data source, and labels as the starting context.
If the same alert and series has been investigated before, Agent SRE is handed the most recent concluded runs as leads. It tests the earlier root cause against current evidence first, and when the same cause reproduces the conclusion says so and names the earlier investigation, so a recurring problem reads as recurring rather than as a fresh discovery.
From an alert rule
On an Alert Rule page, use the Investigate dropdown. Because one rule can be firing for many series at once, you can choose the scope:
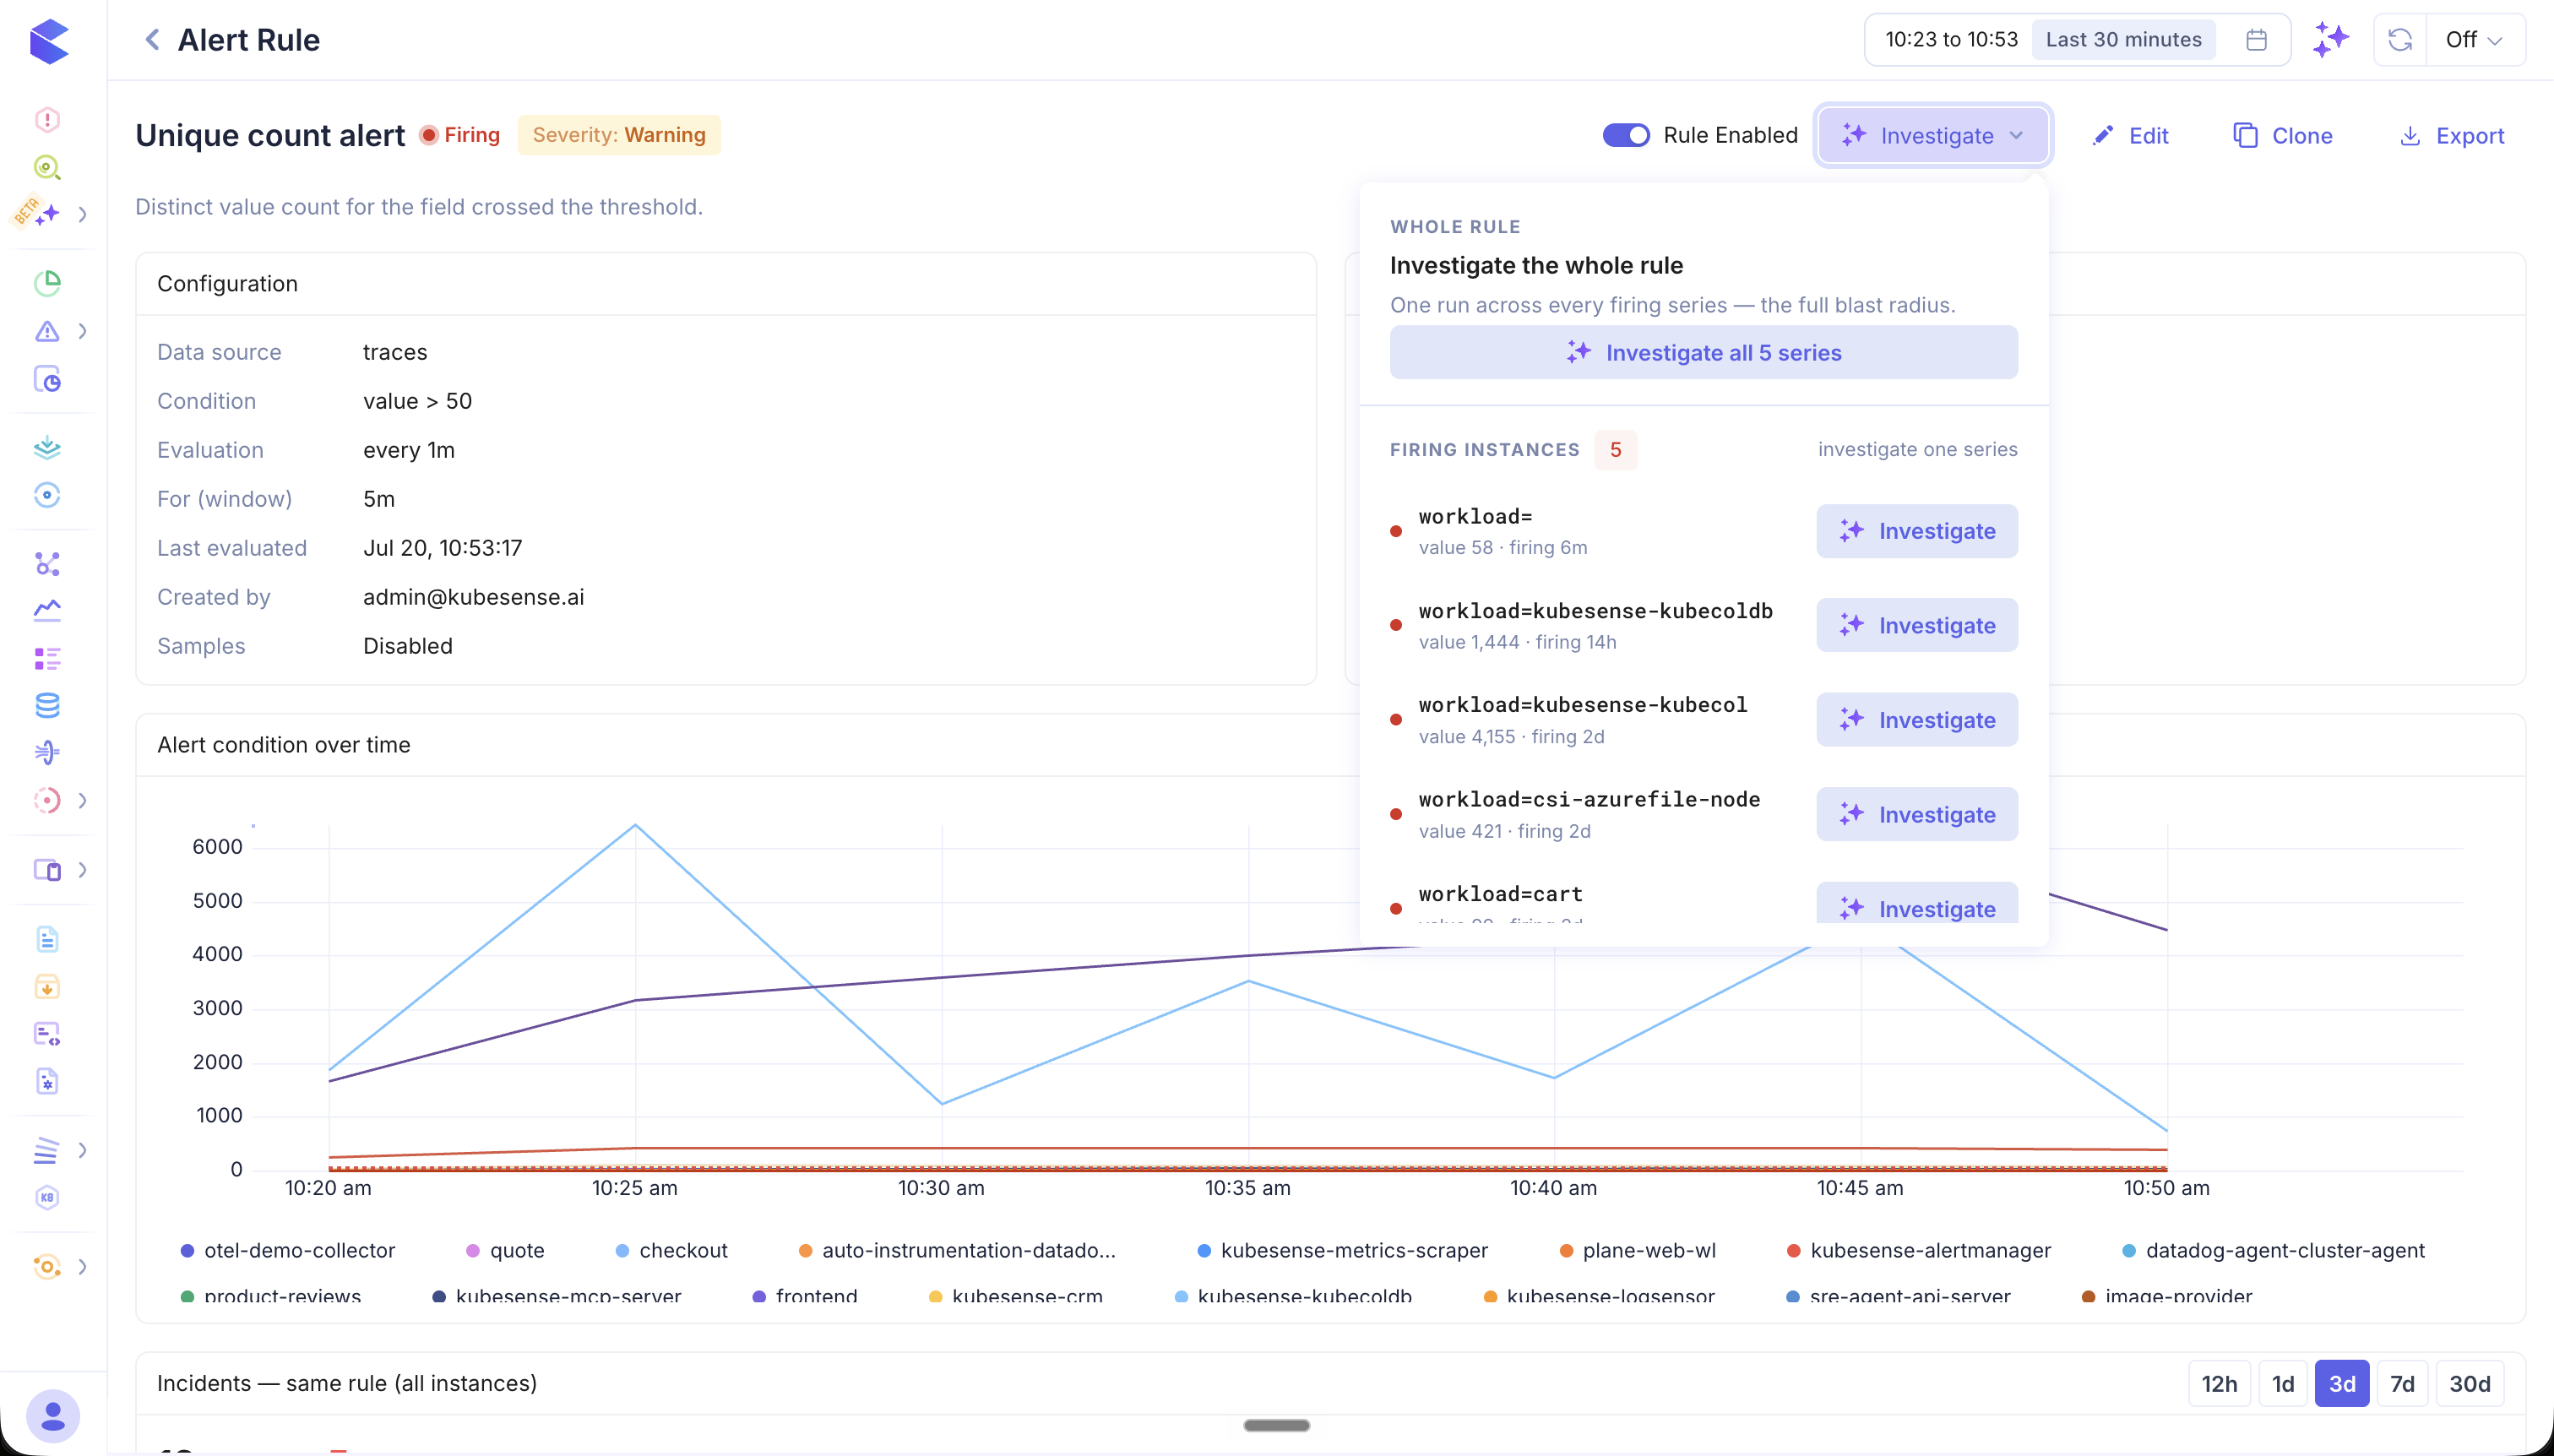
- Investigate the whole rule — one run across every firing series (the full blast radius). For example, Investigate all 5 series.
- Investigate one series — pick a single firing instance from the Firing instances list (each shows its labels, current value, and how long it has been firing) and investigate just that series.
Reading an Investigation
An investigation opens on its detail page, with the alert name, a completion status (e.g. COMPLETE), the Source, and who initiated it. Three views show the same analysis from different angles: the Hypothesis Tree, the Investigation Steps, and, once the run concludes, the Resolution.
Hypothesis Tree
The Hypothesis Tree shows how Agent SRE reasoned about the alert. Starting from the source alert, it branches into the competing hypotheses it considered, each tagged with a verdict, and converges on a final conclusion.
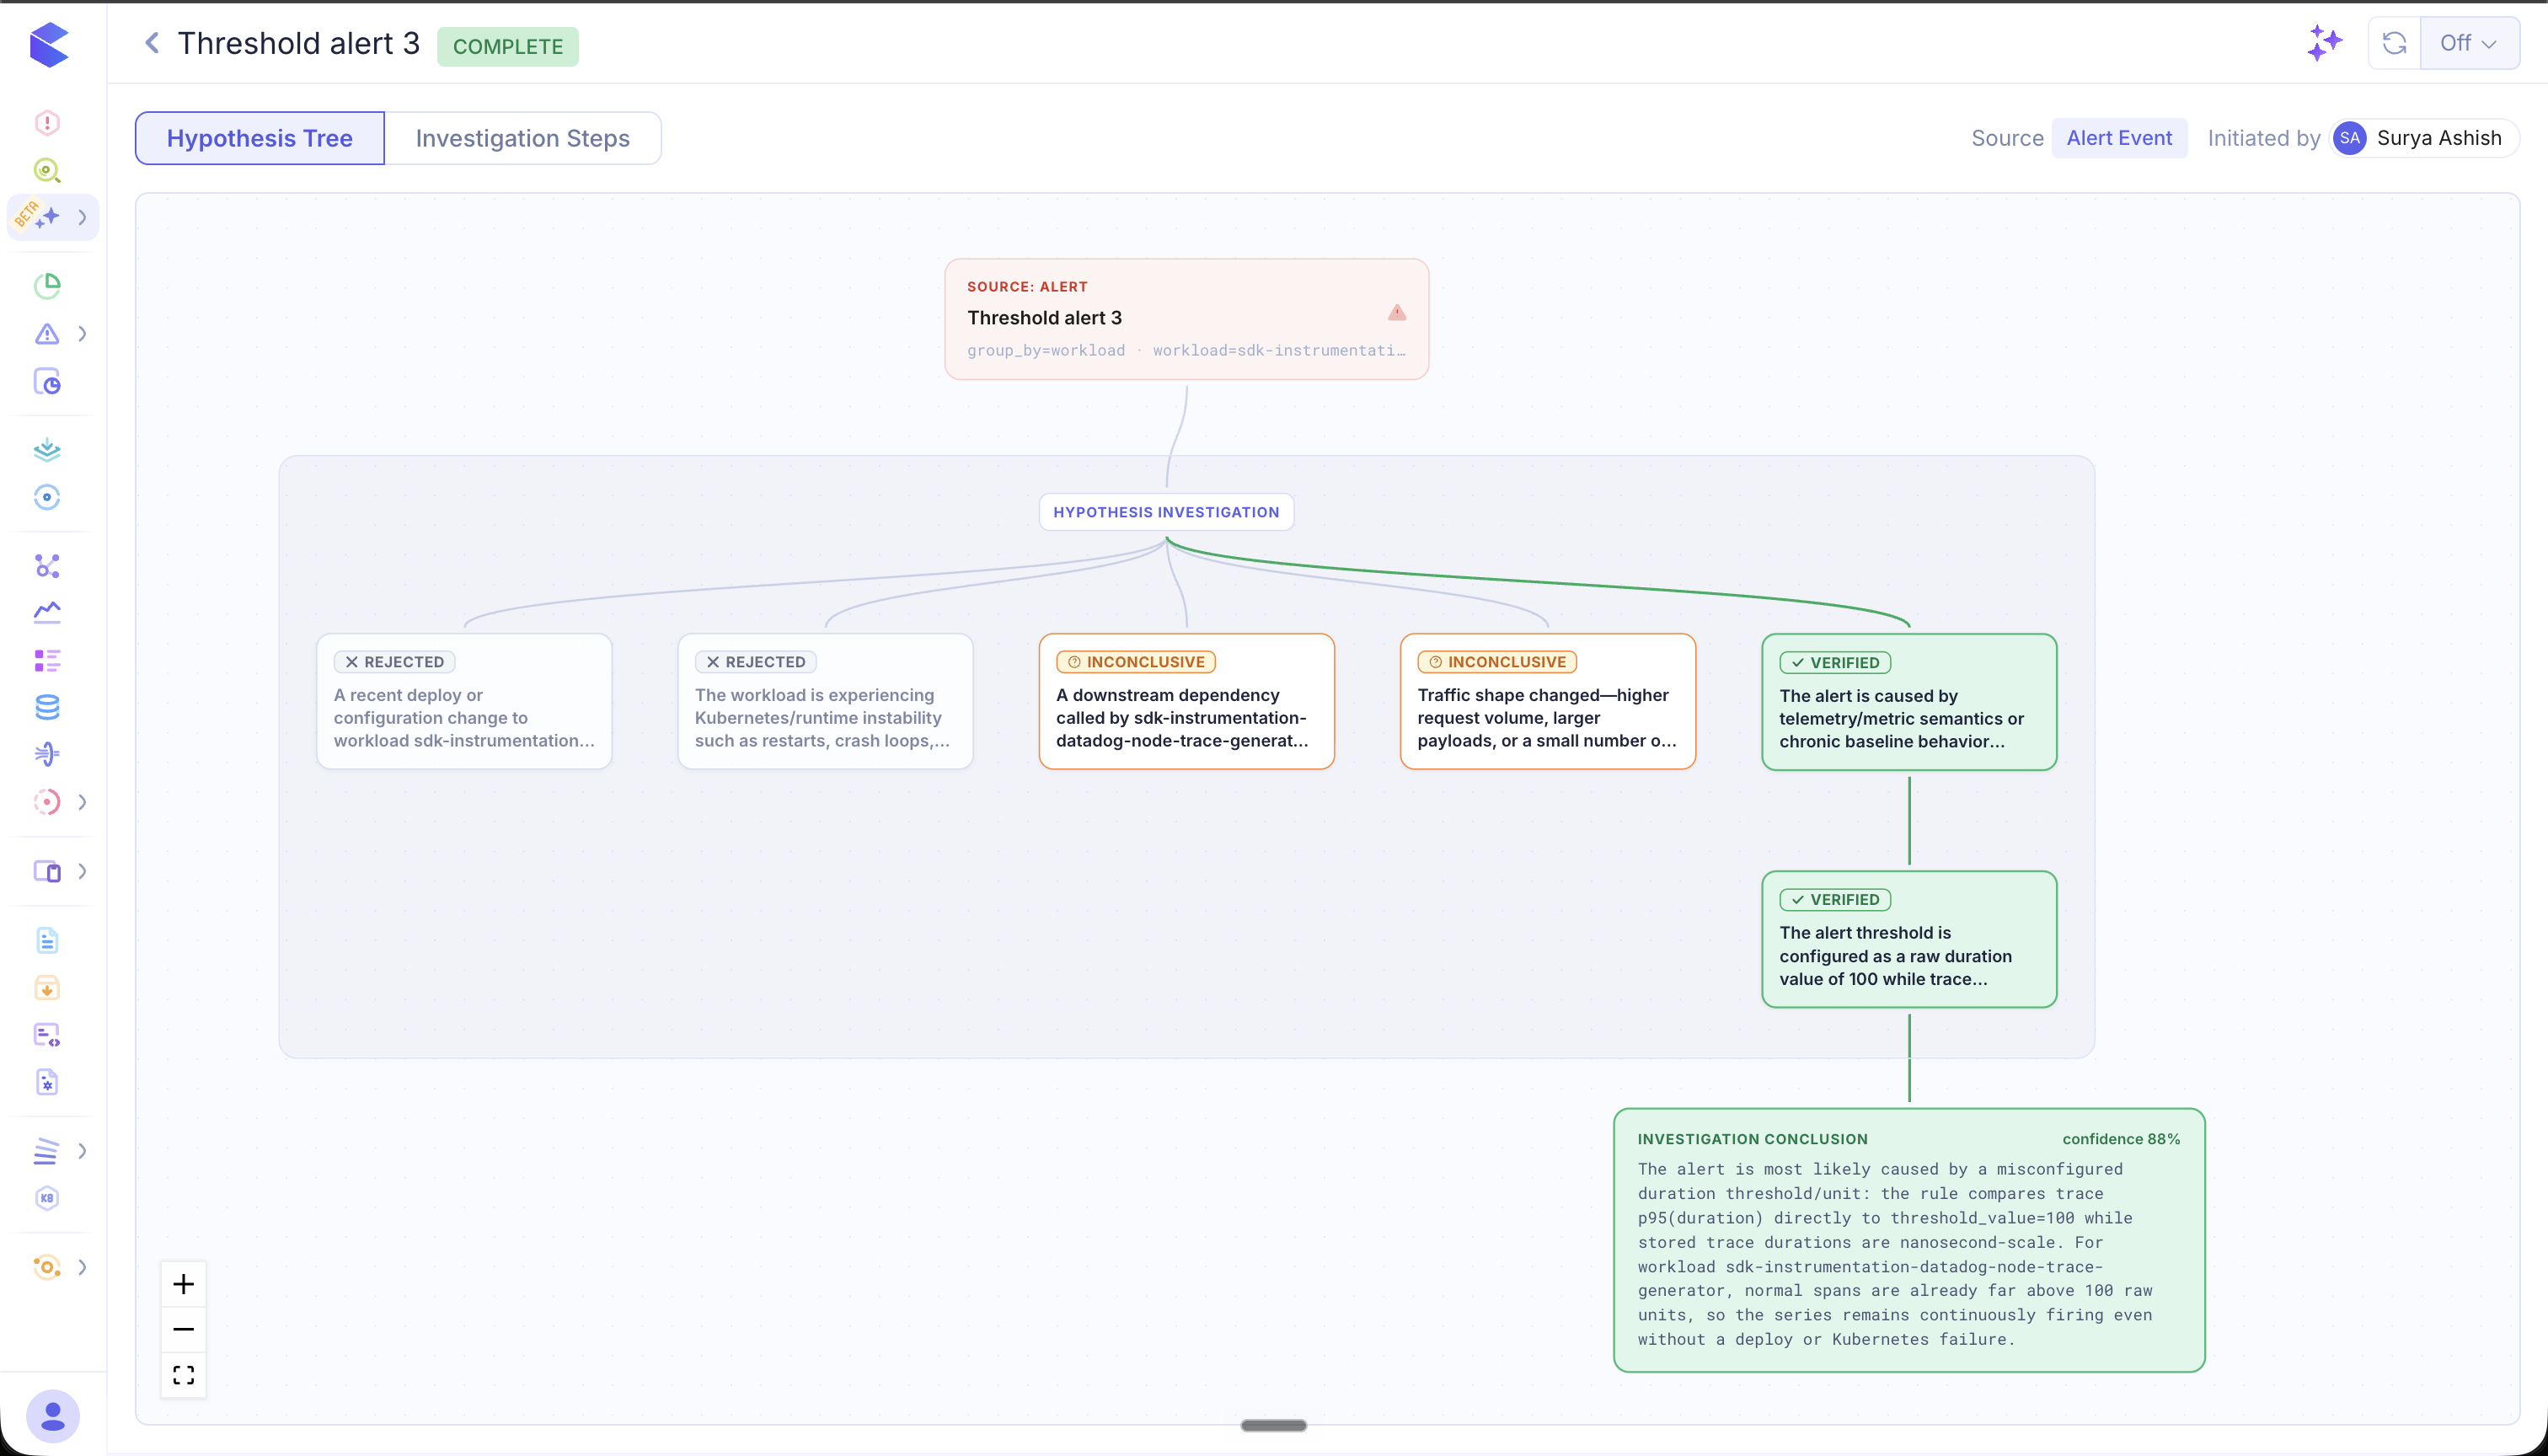
Each hypothesis carries one of three verdicts:
- Verified — supported by the evidence
- Rejected — ruled out by the evidence
- Inconclusive — not enough evidence to confirm or rule out
Verified hypotheses can lead to further, more specific hypotheses. The Investigation Conclusion node summarizes the most likely root cause and shows the overall confidence (e.g. 88%). Use the zoom controls to pan around large trees.
Click any hypothesis node to open a panel with the full detail behind it:
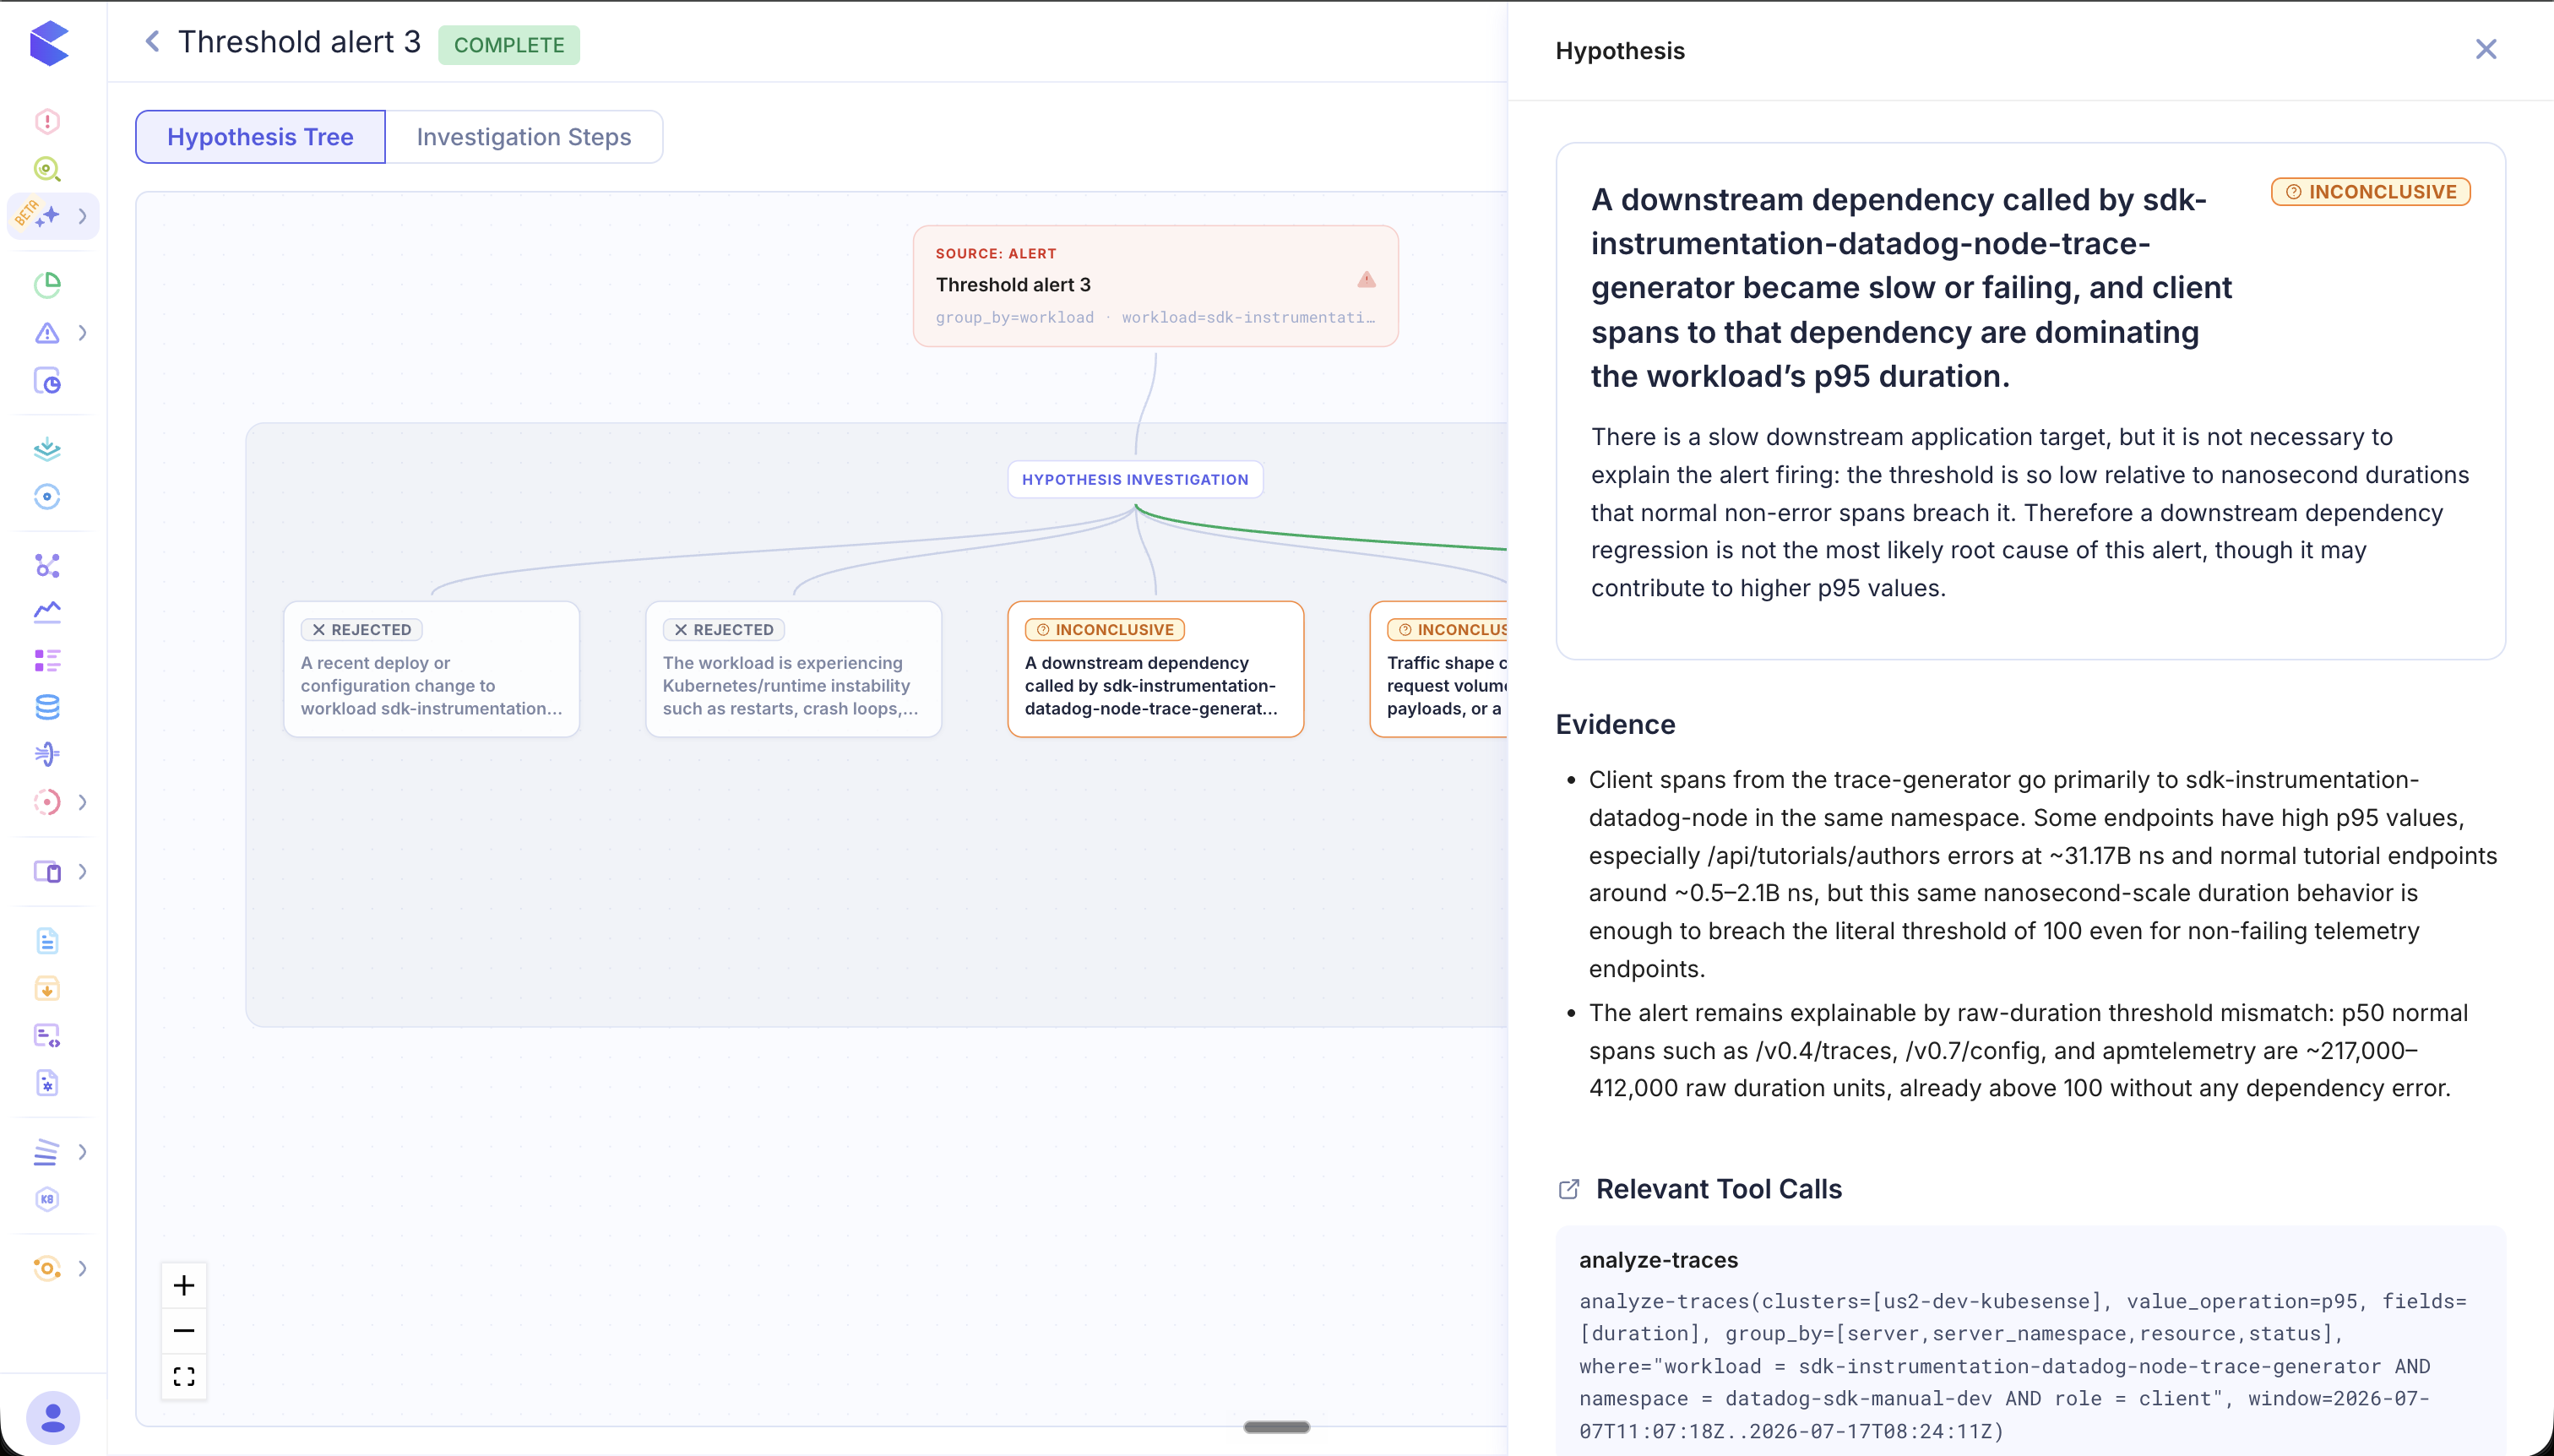
- The full hypothesis statement and its verdict, with Agent SRE's reasoning for that verdict.
- Evidence — the specific findings that support or refute the hypothesis (metrics, span behavior, values observed).
- Relevant Tool Calls — the exact queries Agent SRE ran to test it (e.g. an
analyze-tracescall with its filters, fields, grouping, and time window), so you can reproduce or verify the finding yourself.
Context
If your team has written a Context.md, the agent reads it before anything else.
When a Confluence or Jira integration is connected, Agent SRE reads runbooks, postmortems and tickets about the affected service before it forms hypotheses. Everything it read appears as a Context card between the source and the hypotheses, one row per page or issue with a link to open it, so you can see what the agent consulted and check it yourself.
Earlier investigations of the same alert appear in the same card, so you can see whether this has happened before.
Signals cited
The Context card also lists the data Agent SRE cited when it reached a verdict, in plain language — for example Logs(workload='ad'), Sep 09 14:06 - 14:16 or Metric: kube_pod_container_status_ready. Hover a row to see the exact query behind it.
The rows are split into two groups:
- Root cause — the signals behind the hypotheses it verified.
- Ruled out — the signals behind the ones it rejected or left inconclusive. These are kept deliberately: a query that came back empty is often what eliminates a service, and "we checked the database and it was fine" is frequently the first thing an on-call engineer wants to know.
This is the short list, not everything the agent ran. A run can make dozens of queries and legitimately spend most of them on dead ends, so only the ones a verdict actually cited earn a row.
Click a row to open that data where it lives, in a new tab — logs, traces and metrics open in the Data Explorer with the query and time window already applied; pods, nodes and workloads open in Infrastructure; alert rows open the rule or the firing series. A row with no destination stays as text.
The card starts expanded and collapses on click, independently of the hypothesis section below it.
Investigation Steps
The Investigation Steps view is the chronological trail of what Agent SRE actually did — from the initial Trigger to the final Conclusion.
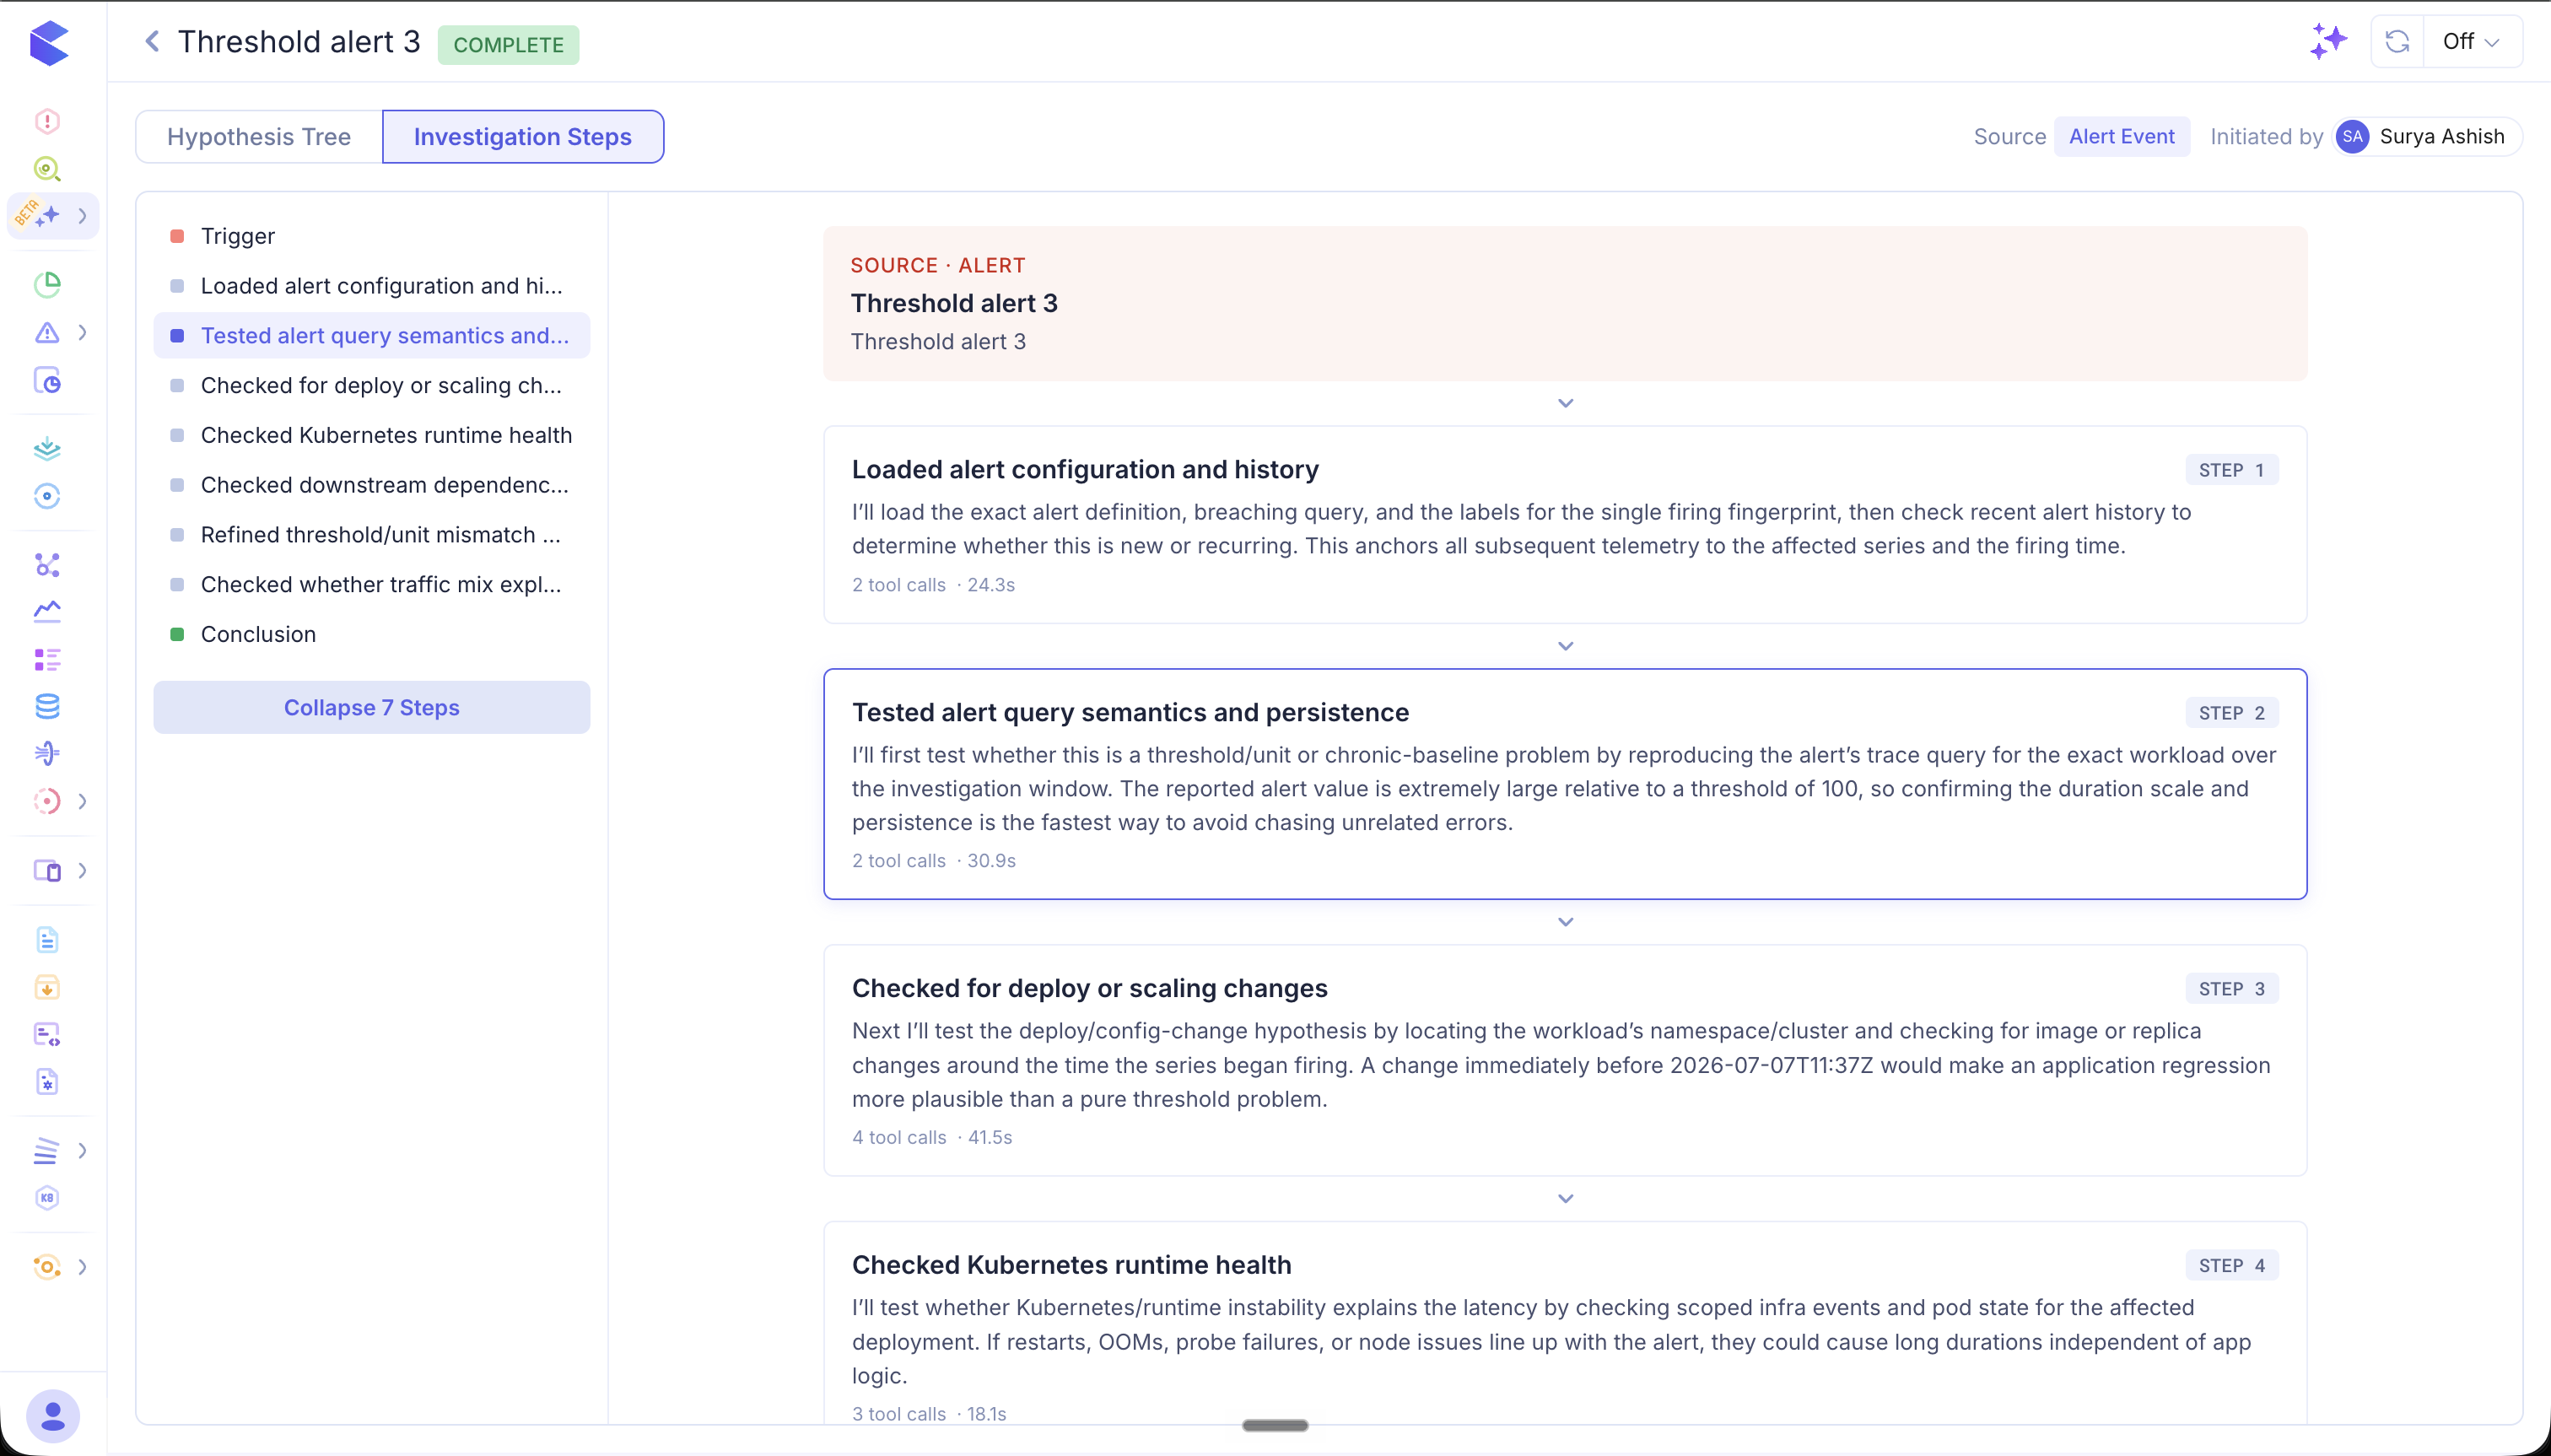
- The left panel lists every step (e.g. Loaded alert configuration, Tested alert query semantics, Checked for deploy or scaling changes, Checked downstream dependency latency) so you can jump straight to one.
- Each step card explains what was checked and why, and footnotes the number of tool calls it made and how long it took (e.g. 1 tool call · 18.6s).
- The final Investigation Conclusion restates the root cause and its confidence.
Click any step to open a panel with its full detail:
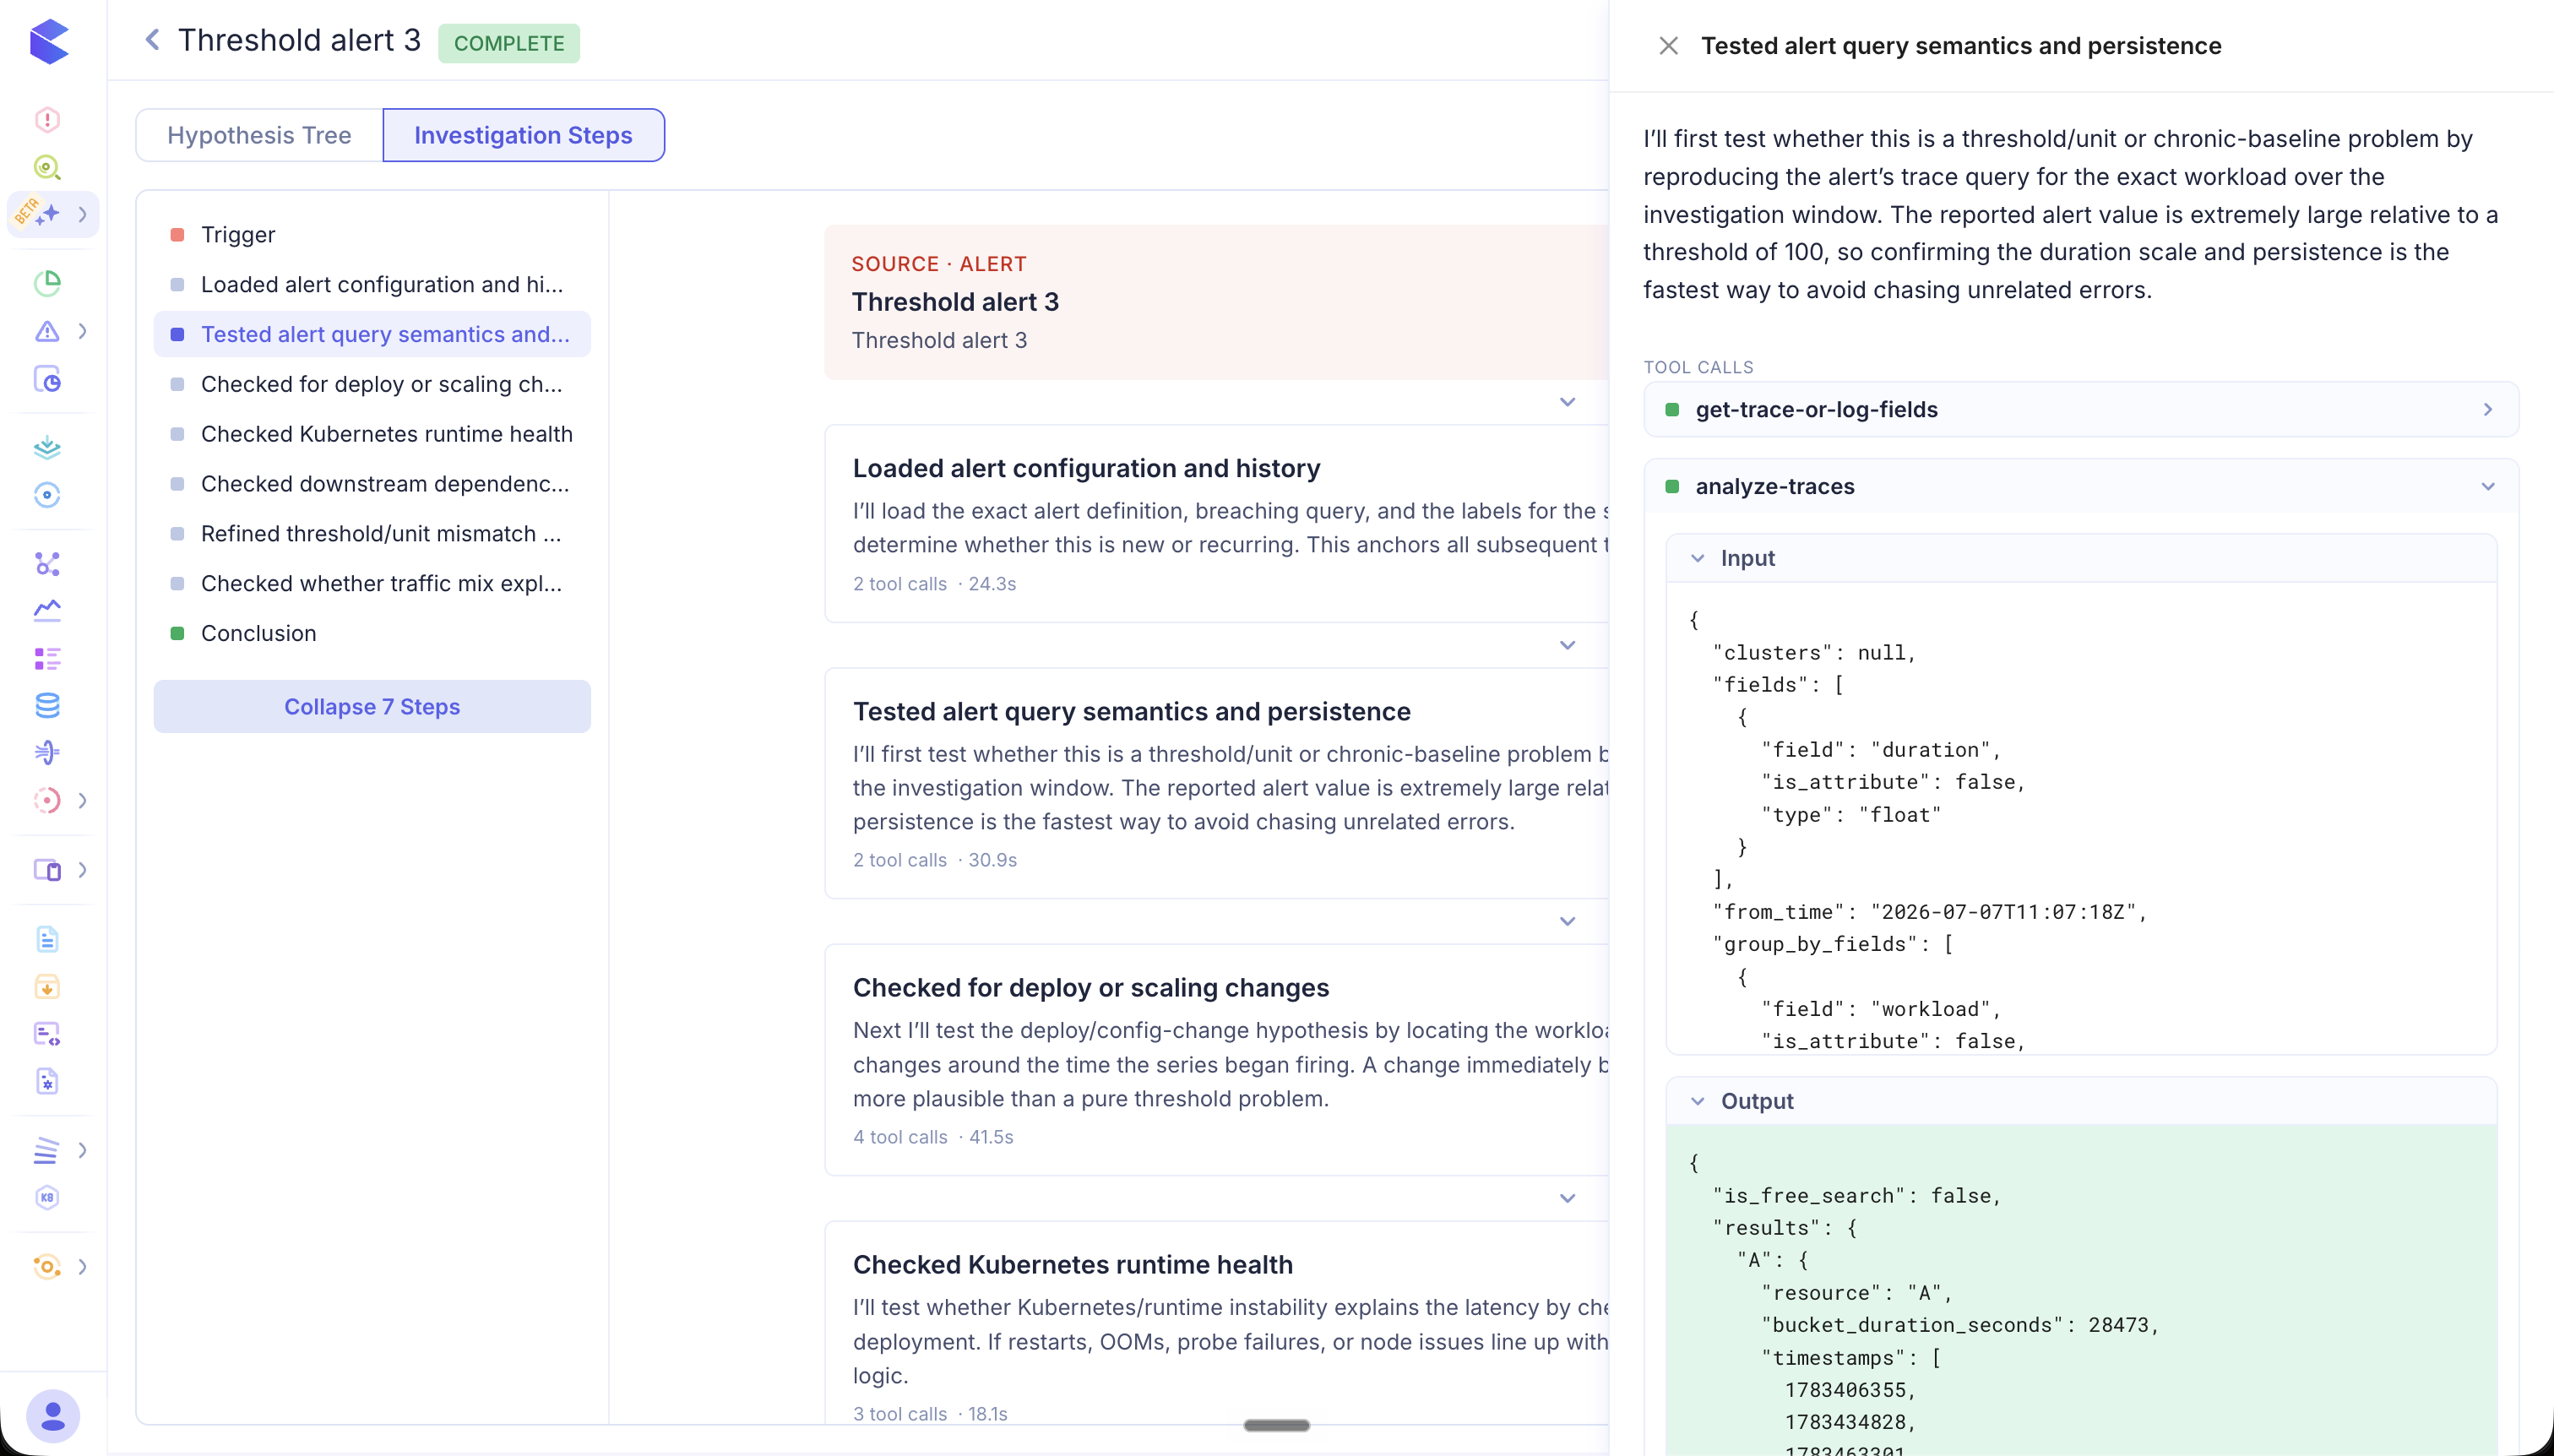
- The step's full reasoning — what Agent SRE set out to test and why.
- Tool Calls — every tool the step invoked (e.g.
get-fields,analyze-traces), each expandable to show the exact Input and Output JSON.
This makes every conclusion auditable: you can see exactly which signals were queried, which hypotheses were tested, and how Agent SRE arrived at its answer.
Resolution
When Agent SRE concludes, it writes a resolution document for the on-call engineer, shown on the Resolution tab (disabled until then). It is Markdown with fixed sections:
- What happened — the symptom the alert saw, and what was actually going on.
- Root cause — the cause and the evidence that proves it.
- Fix it now — numbered steps with the exact commands or actions.
- Verify — the metric or check that confirms the fix.
- Prevent it — follow-ups such as alert tuning, a config change, or a runbook update.
- Sources — links to every runbook, postmortem or ticket the agent read, and the telemetry queries behind the evidence.
Use Copy as Markdown to paste it into a ticket or a postmortem. An investigation that stopped before the agent reached a conclusion has no resolution.