
Experiments
An experiment runs a prompt version and model configuration across every item in a dataset and aggregates the results. It is how you compare a candidate against the current setup on identical inputs, rather than inferring quality from production traffic where the inputs are never the same twice.
See Concepts for the run and run-item objects.
Before you start
An experiment needs four things in place:
- A dataset with items whose input keys match the variables your prompt expects.
- A prompt version to test.
- An LLM connection for the application, since KubeSense calls the model on your behalf — see Installation.
- Optionally an evaluator to score each response.
Without an evaluator a run still produces traces, cost, and latency; it just has no quality signal beyond what you read yourself.
Run an experiment
Start a run from Run Experiment on the Experiments tab, or from Run experiment on a dataset — the same setup either way.
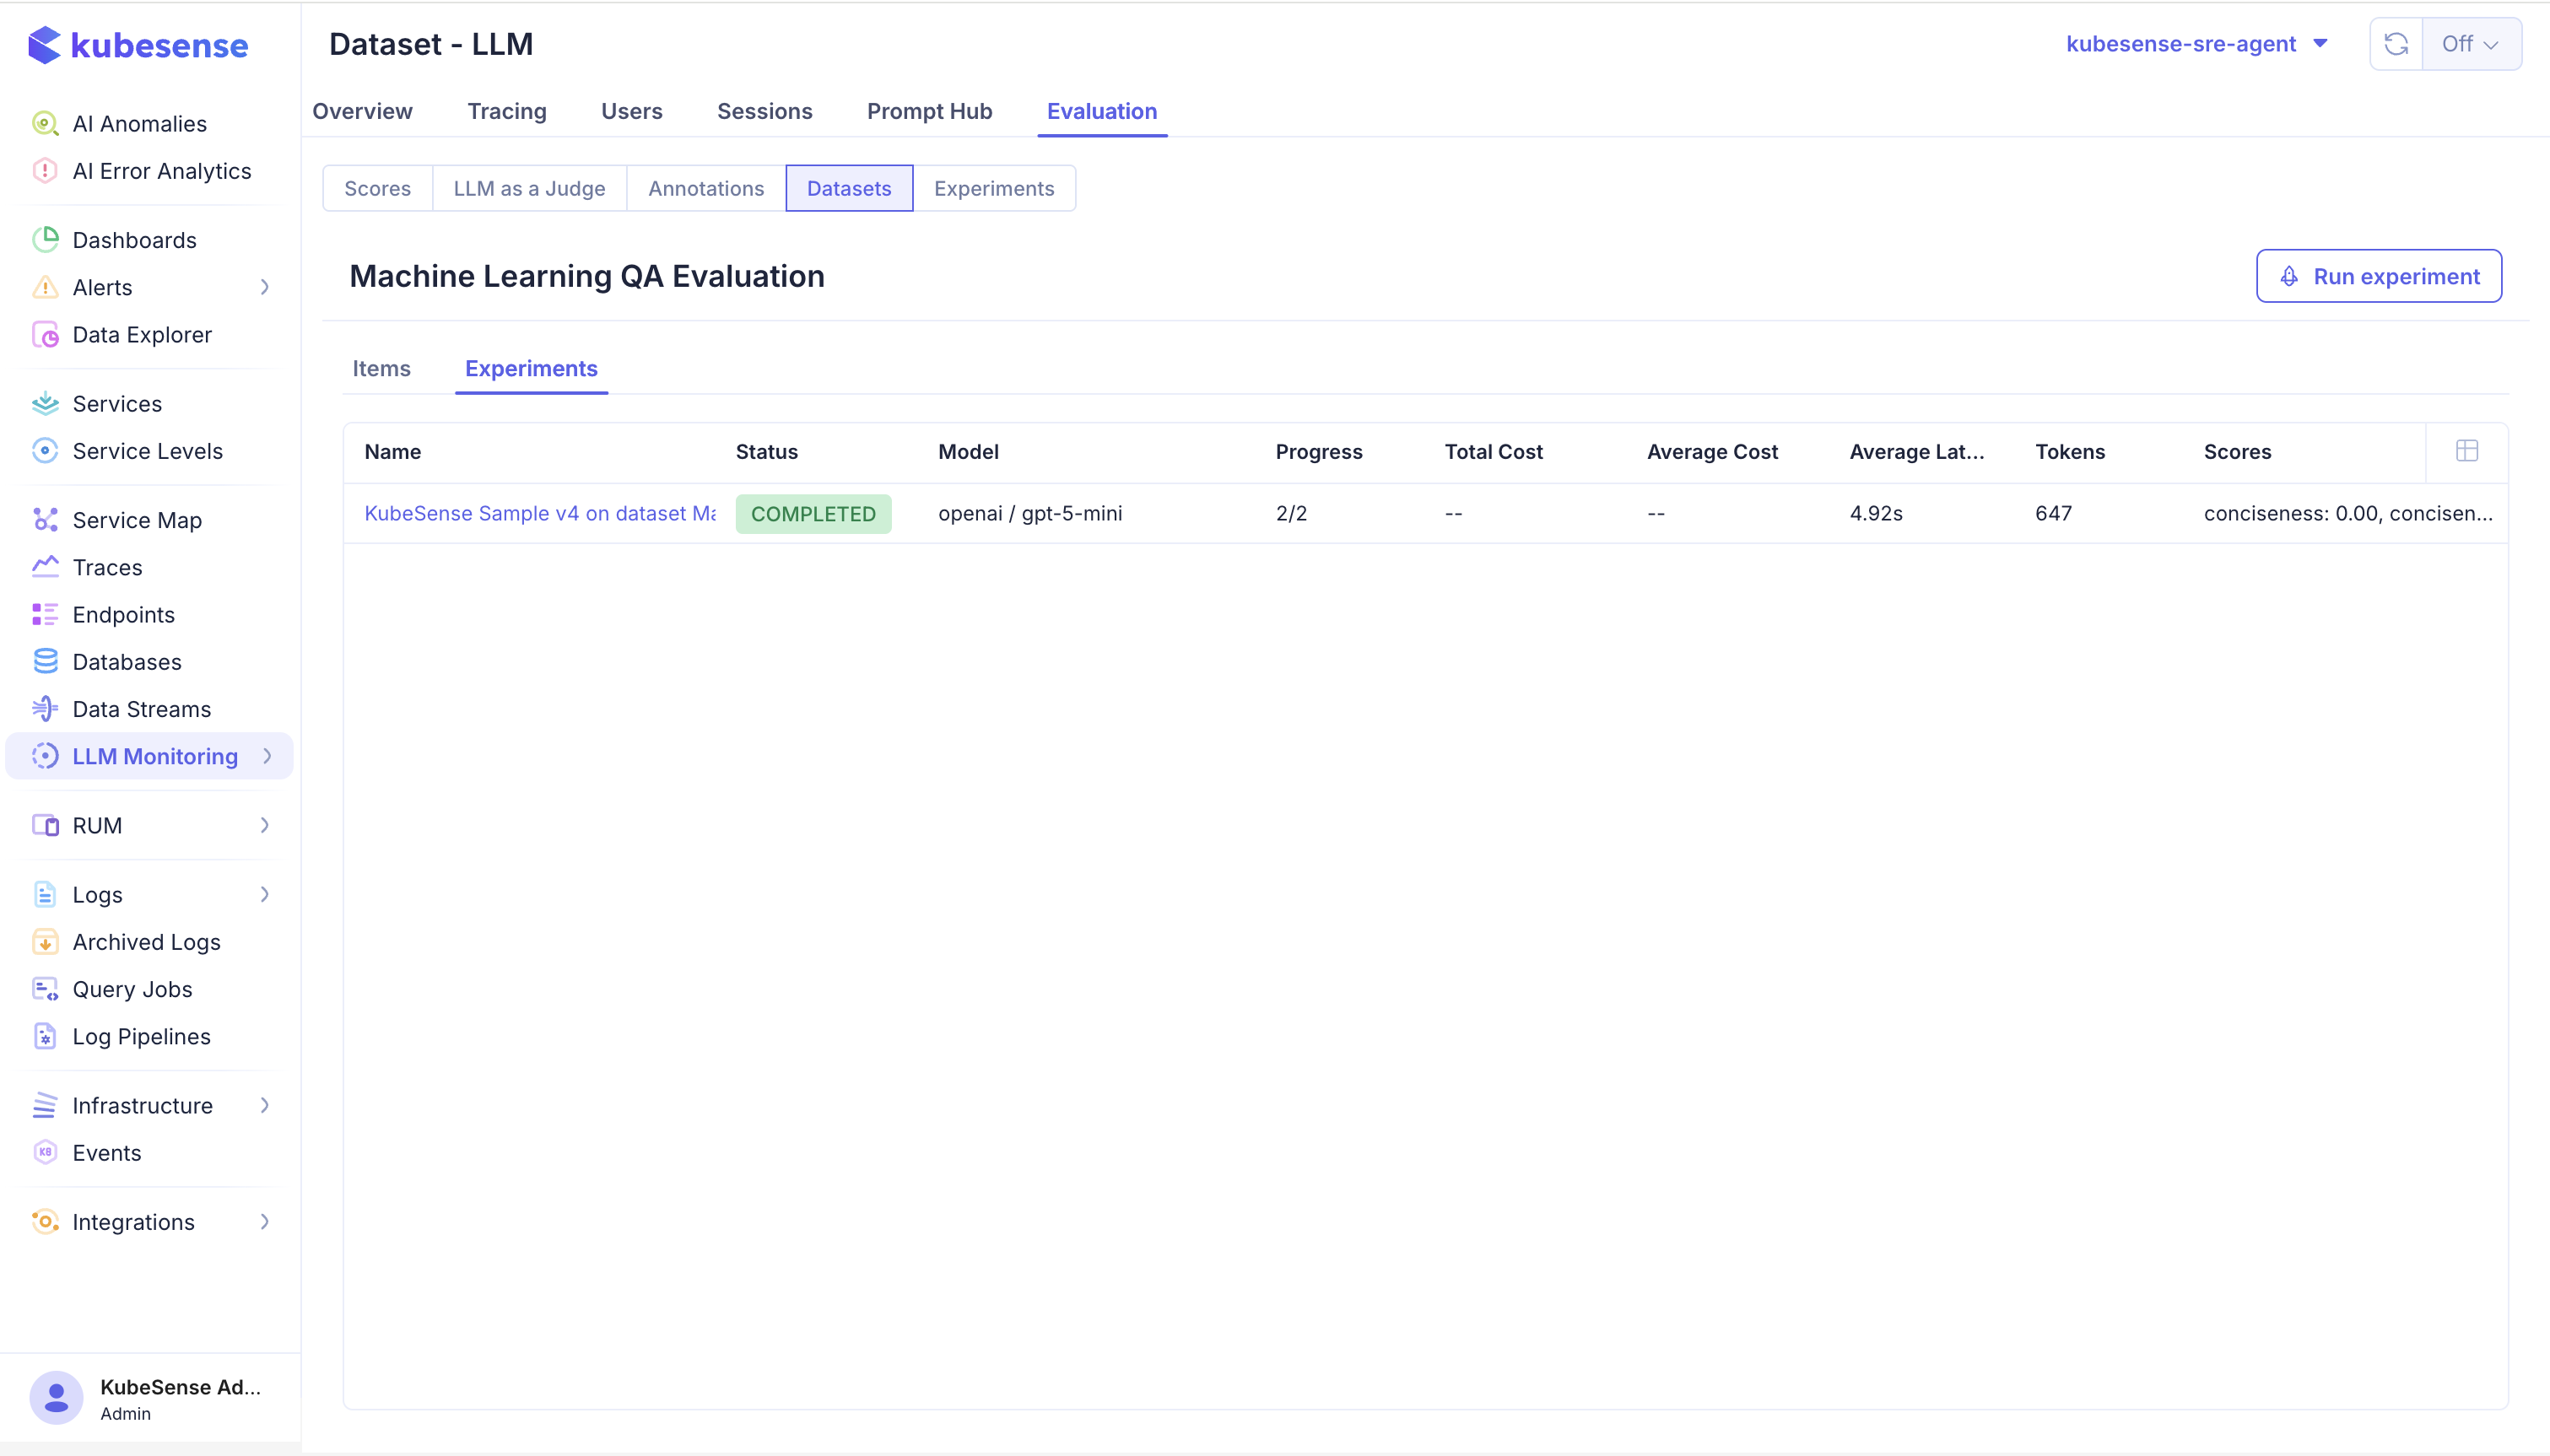
A dataset's own Experiments tab lists only the runs executed against it, which is the view you want when comparing candidates on one collection.
Walkthrough
A run is defined by:
| Field | Meaning |
|---|---|
| Name | What this run is testing — it is how you will tell runs apart later |
| Dataset | The items to run against |
| Prompt | The prompt version under test |
| Model config | The model and generation parameters to run it with |
| Structured output schema | Optional JSON Schema constraining the response shape |
| Evaluator | Optional rubric scoring each response |
Change one thing per run. A run that changes the prompt and the model tells you the pair is better or worse, not which one caused it.
Name runs so the variable is visible — v4 gpt-5-mini beats test 3. A month later the name is all you have.
note: A run executes against the dataset as it exists at that moment. Adding or editing items afterwards does not change a completed run, and two runs are only comparable if the dataset did not change between them.
The experiments list
LLM Monitoring > Evaluation > Experiments lists every run for the application.
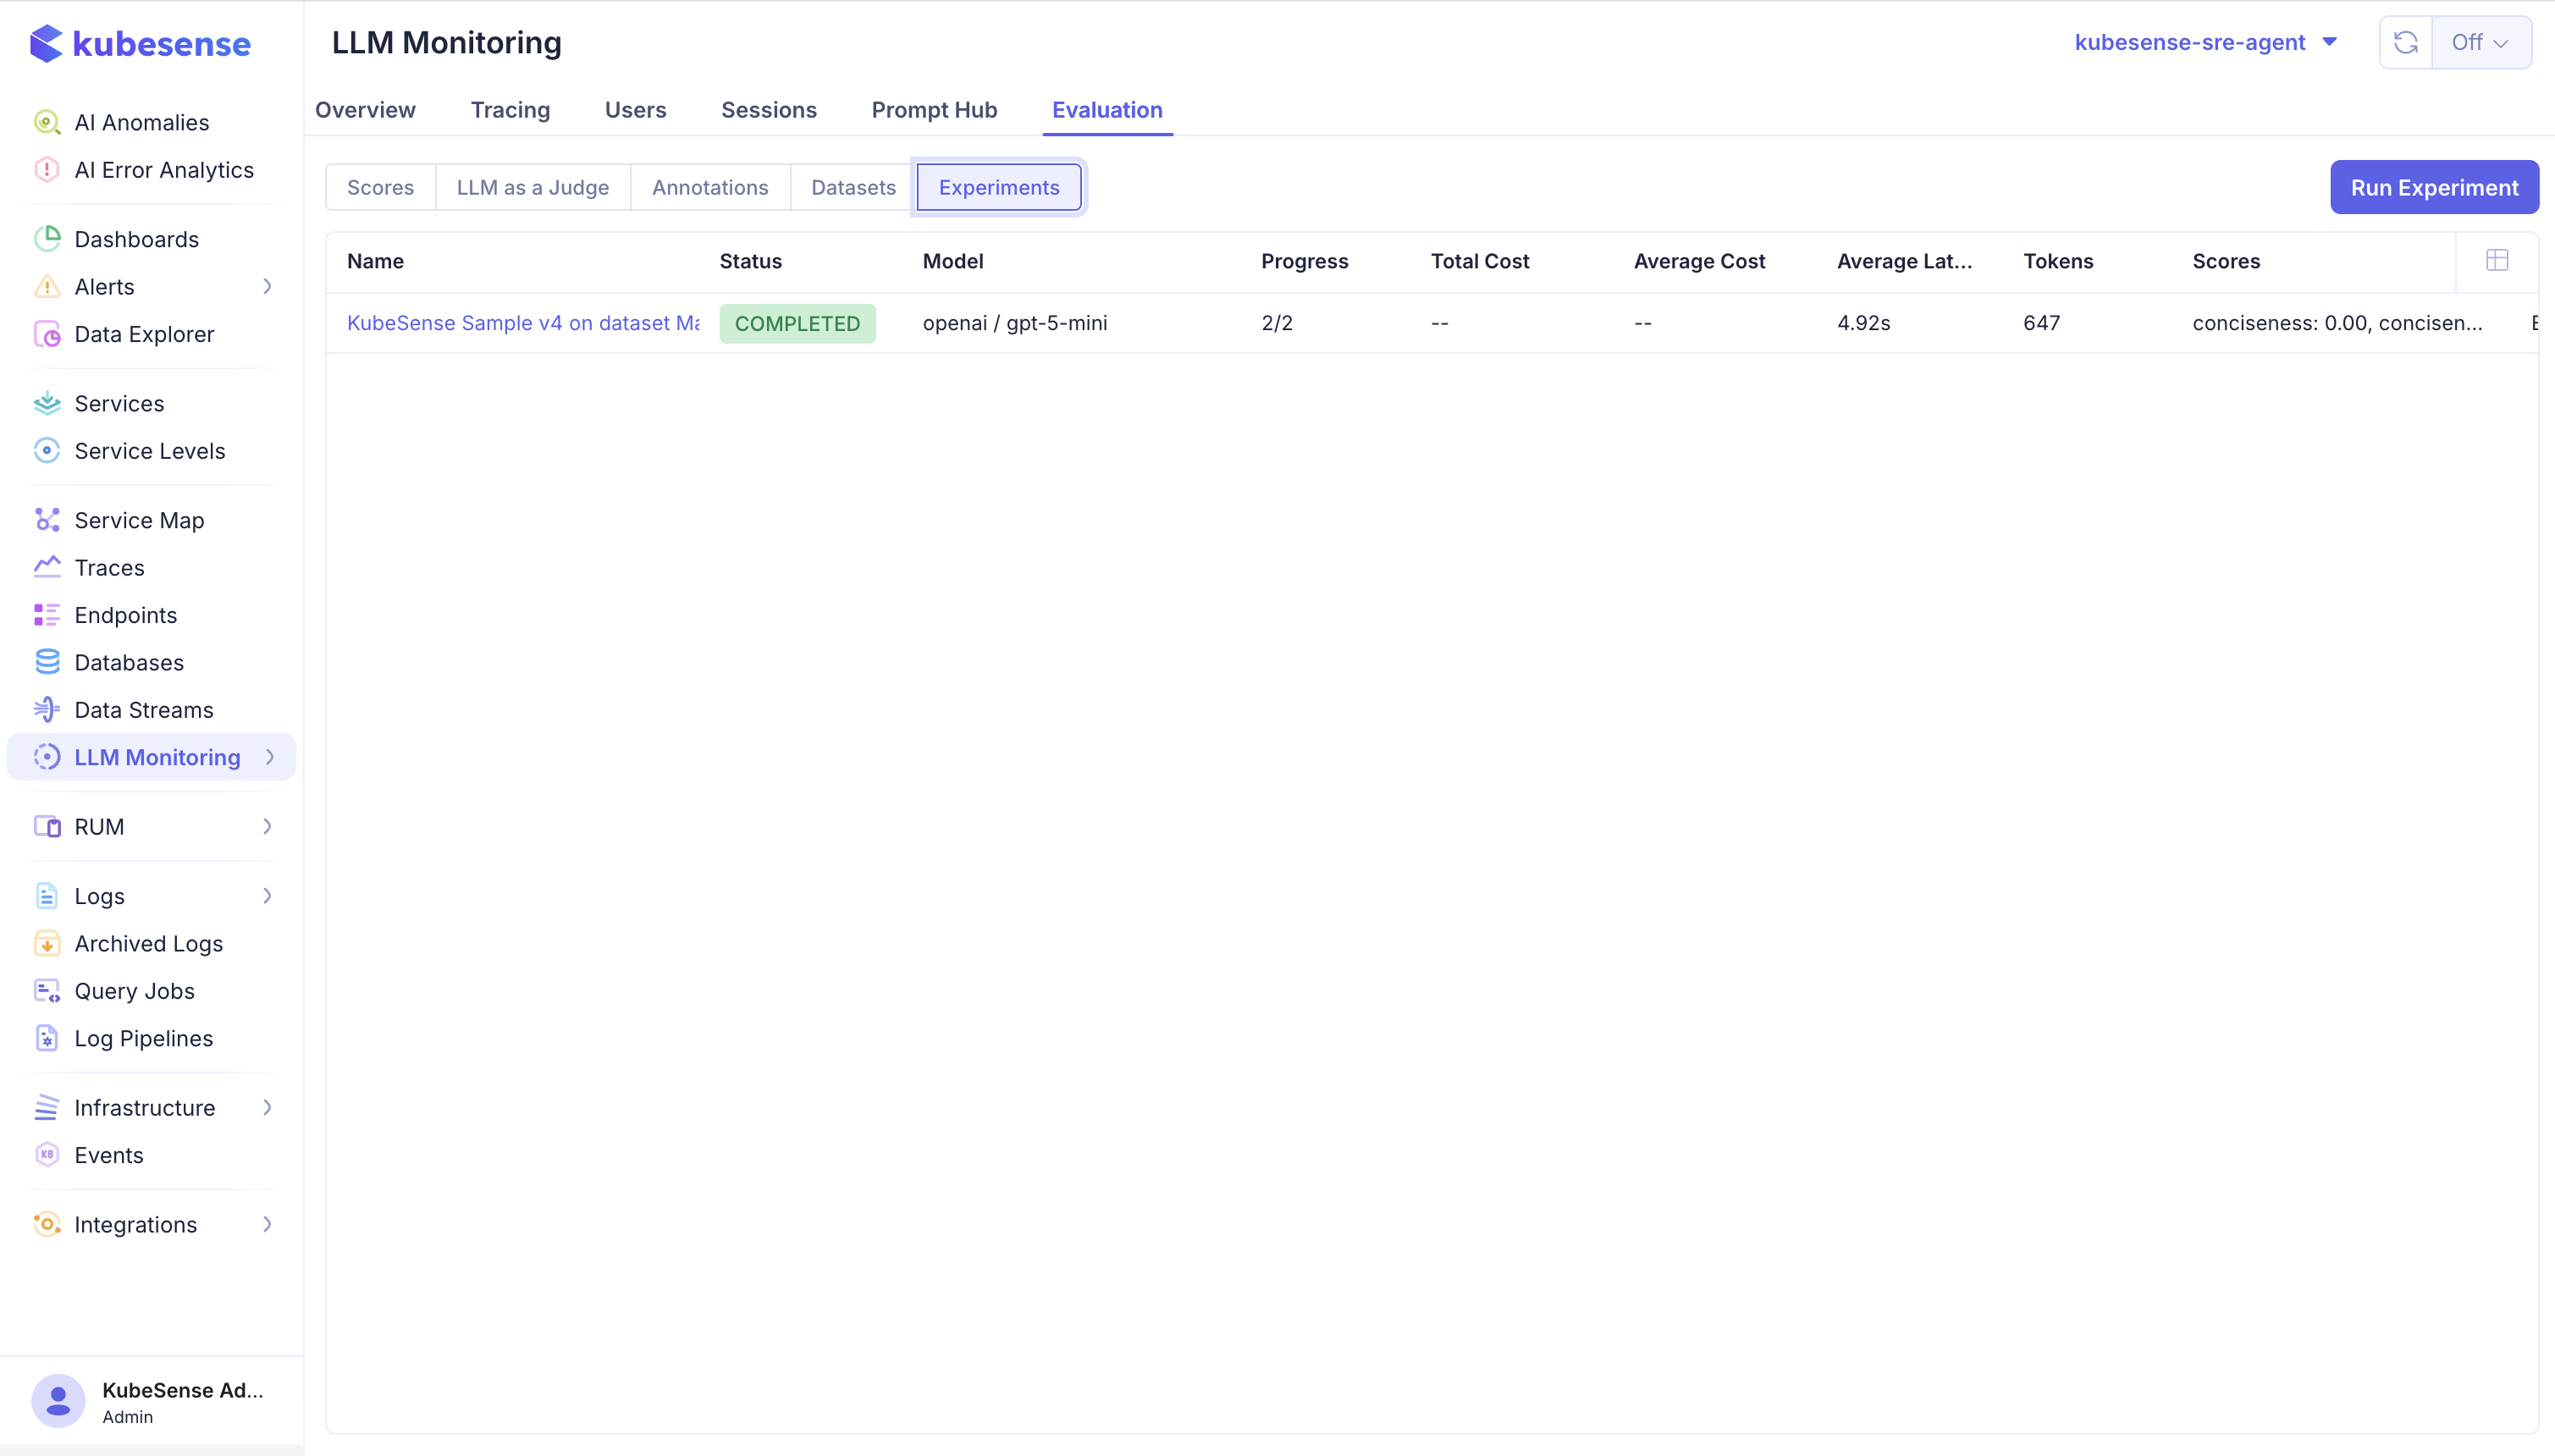
| Column | Meaning |
|---|---|
| Name | The run, usually naming the prompt version and dataset |
| Status | COMPLETED, or in progress / failed |
| Model | The model the run used, such as openai / gpt-5-mini |
| Progress | Items finished against total — 2/2 when everything ran |
| Total Cost / Average Cost | Spend for the run, and per item |
| Average Latency | Mean duration per item |
| Tokens | Total tokens consumed |
| Scores | Aggregated score values, one per score name |
Progress is the first column to read. A run showing 40/100 with good scores scored 40 items, not 100 — check it completed before comparing anything.
Run results
Open a run to see it item by item.
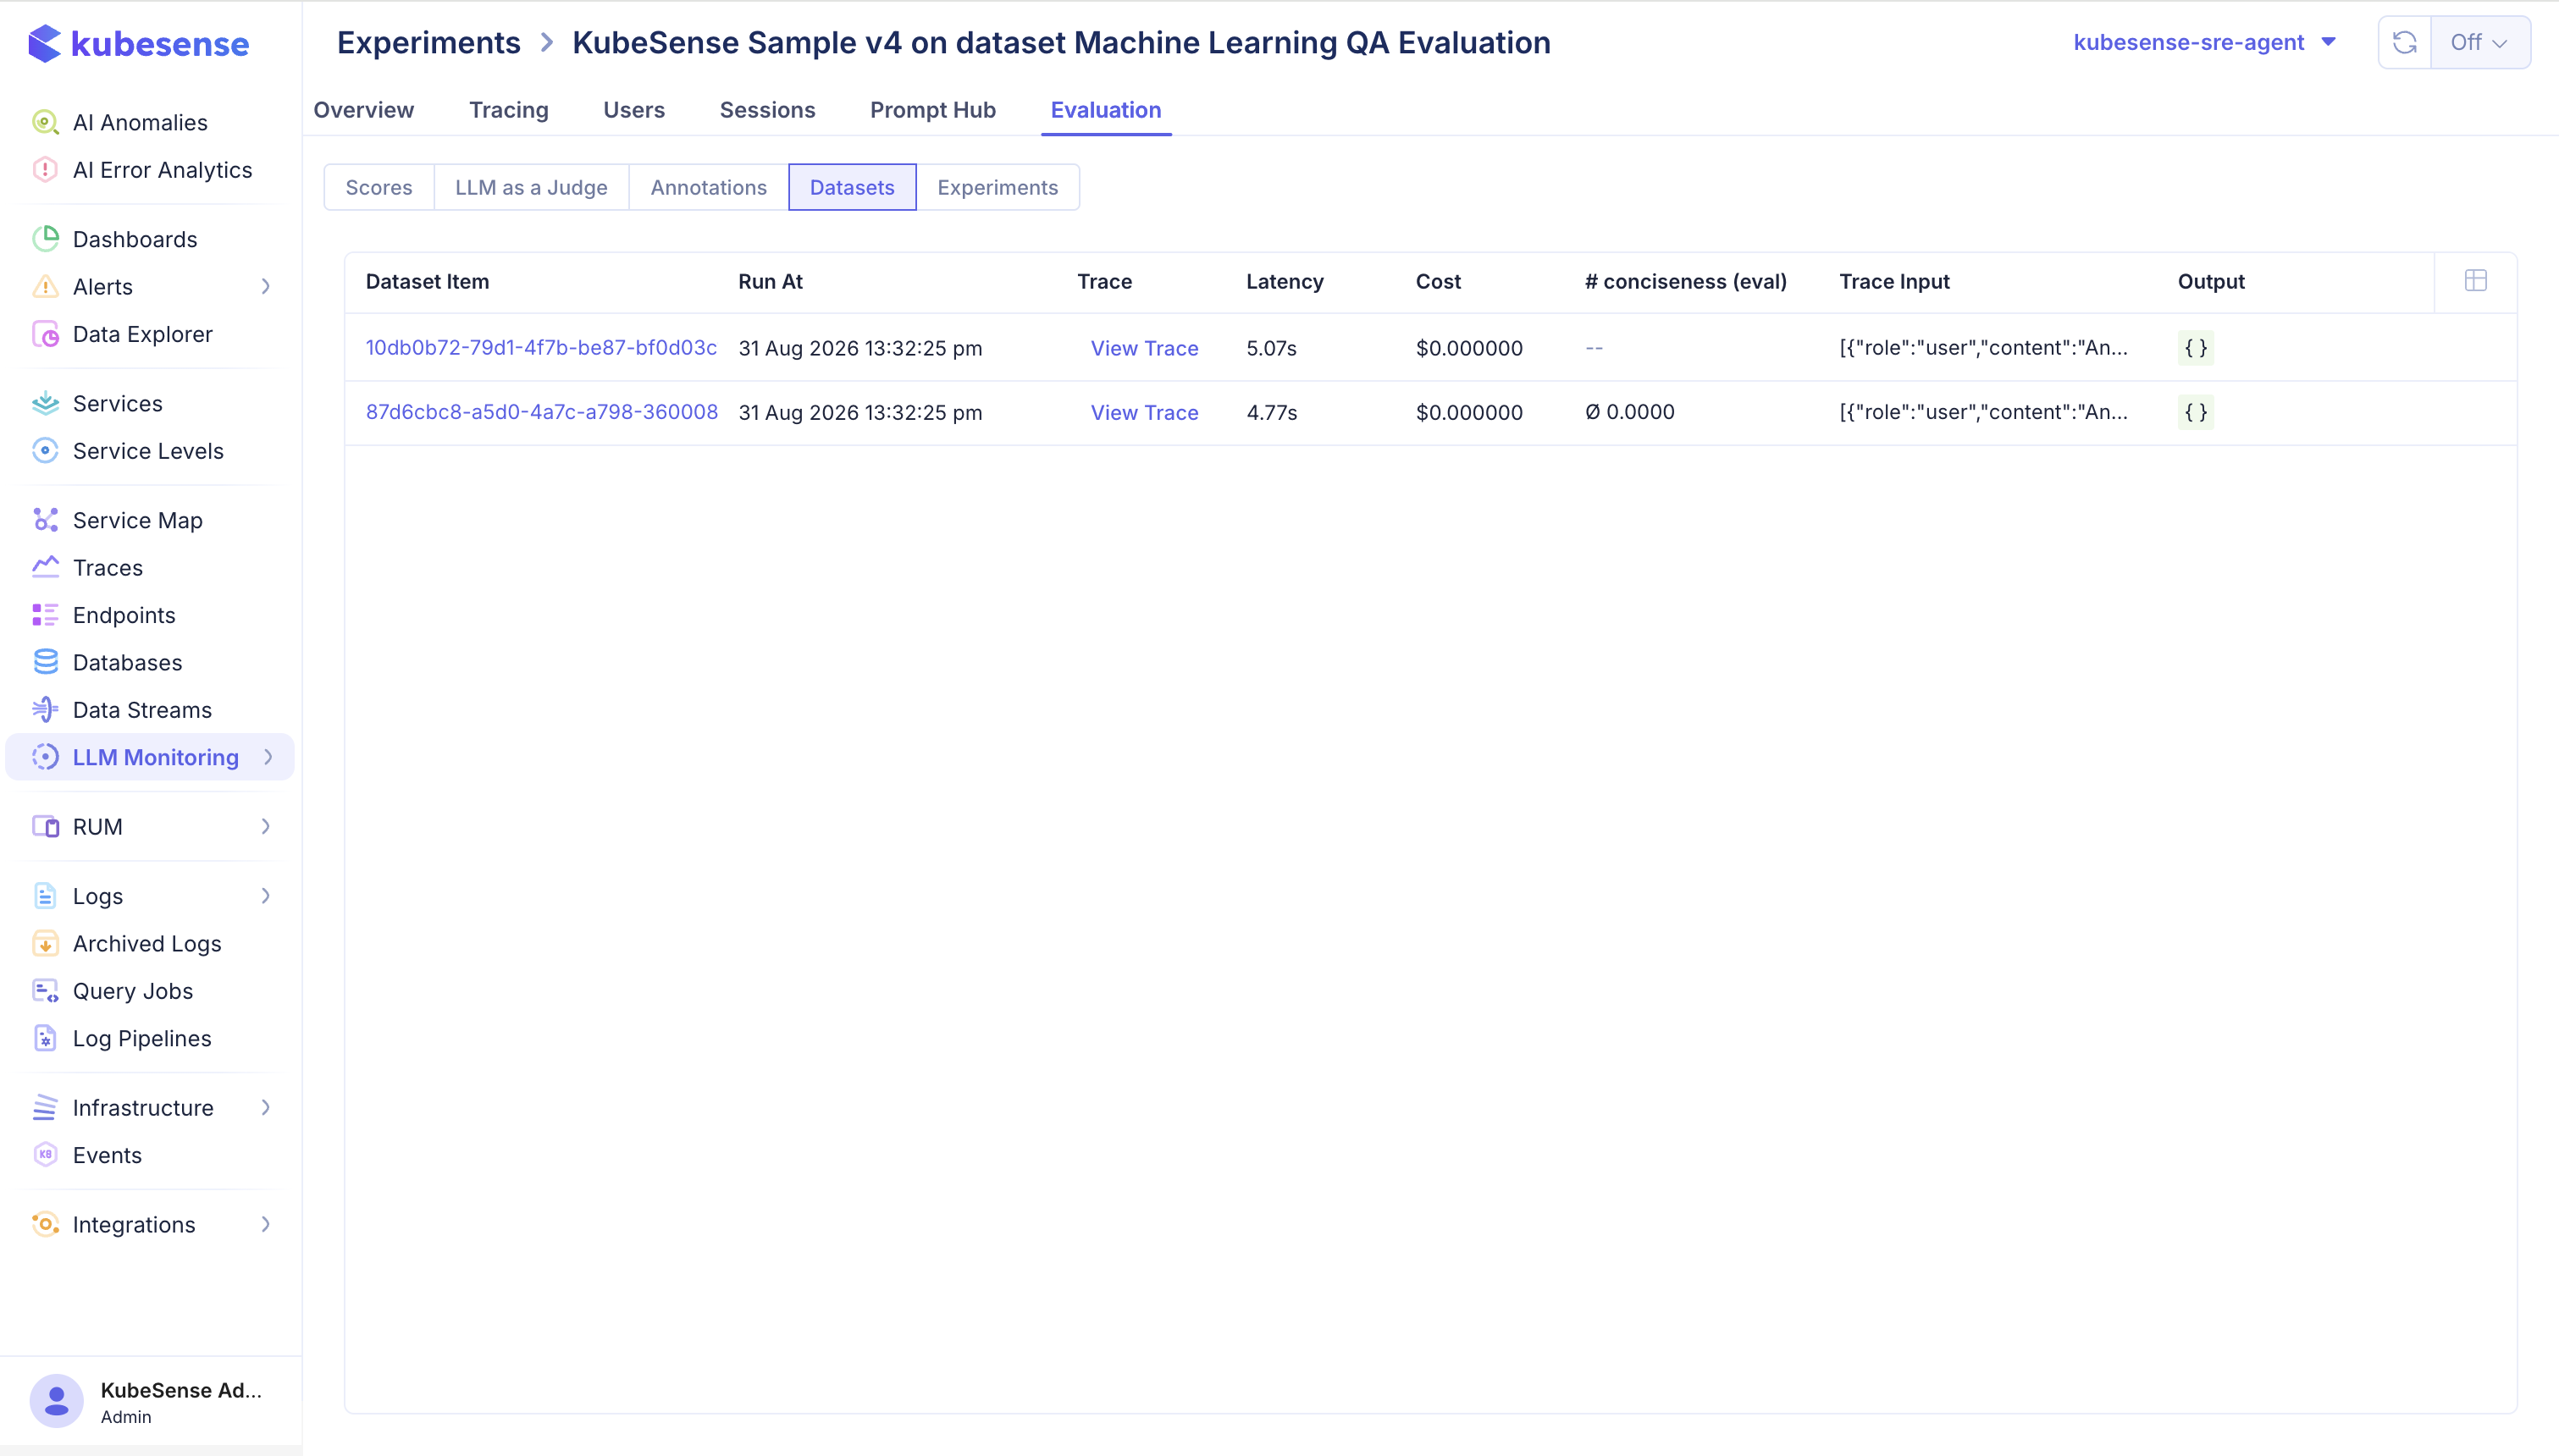
The heading names the run and the dataset it executed against.
| Column | Meaning |
|---|---|
| Dataset Item | The case, linking to its definition |
| Run At | When this item was executed |
| Trace | View Trace opens the trace this run produced for the item |
| Latency | Duration for this item |
| Cost | Spend for this item |
| Score columns | One per score, such as # conciseness (eval), with the value for this item |
| Trace Input | What was actually sent |
| Output | What came back |
Each score gets its own column, so a run scored on several dimensions shows them side by side. A -- means no score was produced for that item — the evaluator failed, was sampled out, or the item errored before there was anything to judge.
View Trace is what makes a run debuggable. The aggregate tells you something changed; the trace tells you what the model actually received and returned for the case that regressed.
Compare two runs
- Run the current configuration to establish a baseline, if you do not already have one.
- Change one variable and run again against the same dataset.
- Compare score aggregates, cost, and latency side by side.
- Open the items where the two runs disagree most — the aggregate tells you whether something changed, the traces tell you what.
- Check cost and latency, not only quality. A candidate that scores marginally better for double the spend is usually not the one to ship.
A dataset item's cross-run view shows every run's result for a single case, which is the fastest way to find cases that regressed while the average improved.
Scoring a run
Runs produce scores the same way production traffic does:
- Attach an LLM judge rubric to score each response automatically
- Compare against the item's expected output where one is defined
- Review the run's traces through an annotation queue for a candidate you are about to ship
Where to next
- Datasets — the cases a run executes against
- Scores — how run results are recorded
- Prompt Hub — promote the winning version with a label