
AWS
Every AWS resource type KubeSense discovers and every metric it collects, with the provider-side query detail behind each one.
Overview
KubeSense collects 591 metrics across 44 resource types from AWS, reading them from Amazon CloudWatch, plus Amazon RDS Performance Insights for database internals.
Collection is read-only and agentless: resources are discovered through the provider's own management APIs, and nothing is installed in your AWS account. Every metric below is requested only for the resource types you enable.
Resources collected
30 resource types are available, 29 of them with metrics. Each row is one toggle on the integration's Resource Types selector; see Resource & Metric Collection for connecting the account itself.
Discovered as lists the entity kinds a toggle produces — the kinds you filter on in the Infrastructure explorer. One toggle can yield several, which is why the 44 metric tables below outnumber the toggles here.
| Resource type | Toggle key | Discovered as | Metrics |
|---|---|---|---|
| EC2 Instances | ec2 | Ec2Instance | Yes |
| RDS Databases | rds | RdsInstance, RdsCluster | Yes |
| ElastiCache | elasticache | ElastiCacheCluster | Yes |
| Load Balancers (ELB/ALB/NLB) | elb | LoadBalancer, LbListener, LbTargetServer, LoadBalancerTargetGroup | Yes |
| ECS | ecs | EcsCluster, EcsService, EcsContainerInstance, EcsTaskDefinition, EcsTask, EcsContainer | Yes |
| EKS Clusters | eks | EksCluster | Yes |
| Lambda Functions | lambda | LambdaFunction | Yes |
| S3 Buckets | s3 | S3Bucket | Yes |
| SNS Topics | sns | SnsTopic | Yes |
| SQS Queues | sqs | SqsQueue | Yes |
| Kinesis Streams | kinesis | KinesisStream | Yes |
| Firehose Streams | firehose | FirehoseStream | Yes |
| Lex Bots | lex | LexBot | Yes |
| WAF Web ACLs | waf | WafWebAcl | Yes |
| MSK (Kafka) | msk | MskCluster | Yes |
| EBS Volumes | ebs | EbsVolume | Yes |
| VPC Topology | vpc_topology | Vpc, Network, Subnet, VRouter, RoutingTable, NatGateway, PeerConnection, VInterface, IpAddress, FloatingIp, AvailabilityZone | Inventory only |
| API Gateway | api_gateway | ApiGatewayApi | Yes |
| CloudFront | cloudfront | CloudFrontDistribution | Yes |
| Route 53 | route53 | Route53HostedZone | Yes |
| DynamoDB | dynamodb | DynamoDbTable | Yes |
| Step Functions | step_functions | StepFunctionsStateMachine | Yes |
| EventBridge | eventbridge | EventBridgeBus | Yes |
| Redshift | redshift | RedshiftCluster | Yes |
| DocumentDB | documentdb | DocumentDbCluster | Yes |
| Neptune | neptune | NeptuneCluster | Yes |
| OpenSearch | opensearch | OpenSearchDomain | Yes |
| Transit Gateway | transit_gateway | TransitGateway | Yes |
| SageMaker | sagemaker | SageMakerEndpoint | Yes |
| Auto Scaling Groups | asg | AutoScalingGroup | Yes |
Browse discovered resources
Discovered AWS resources appear under Infrastructure > Cloud Infrastructure on the Cloud Explorer tab, grouped under the AWS provider.
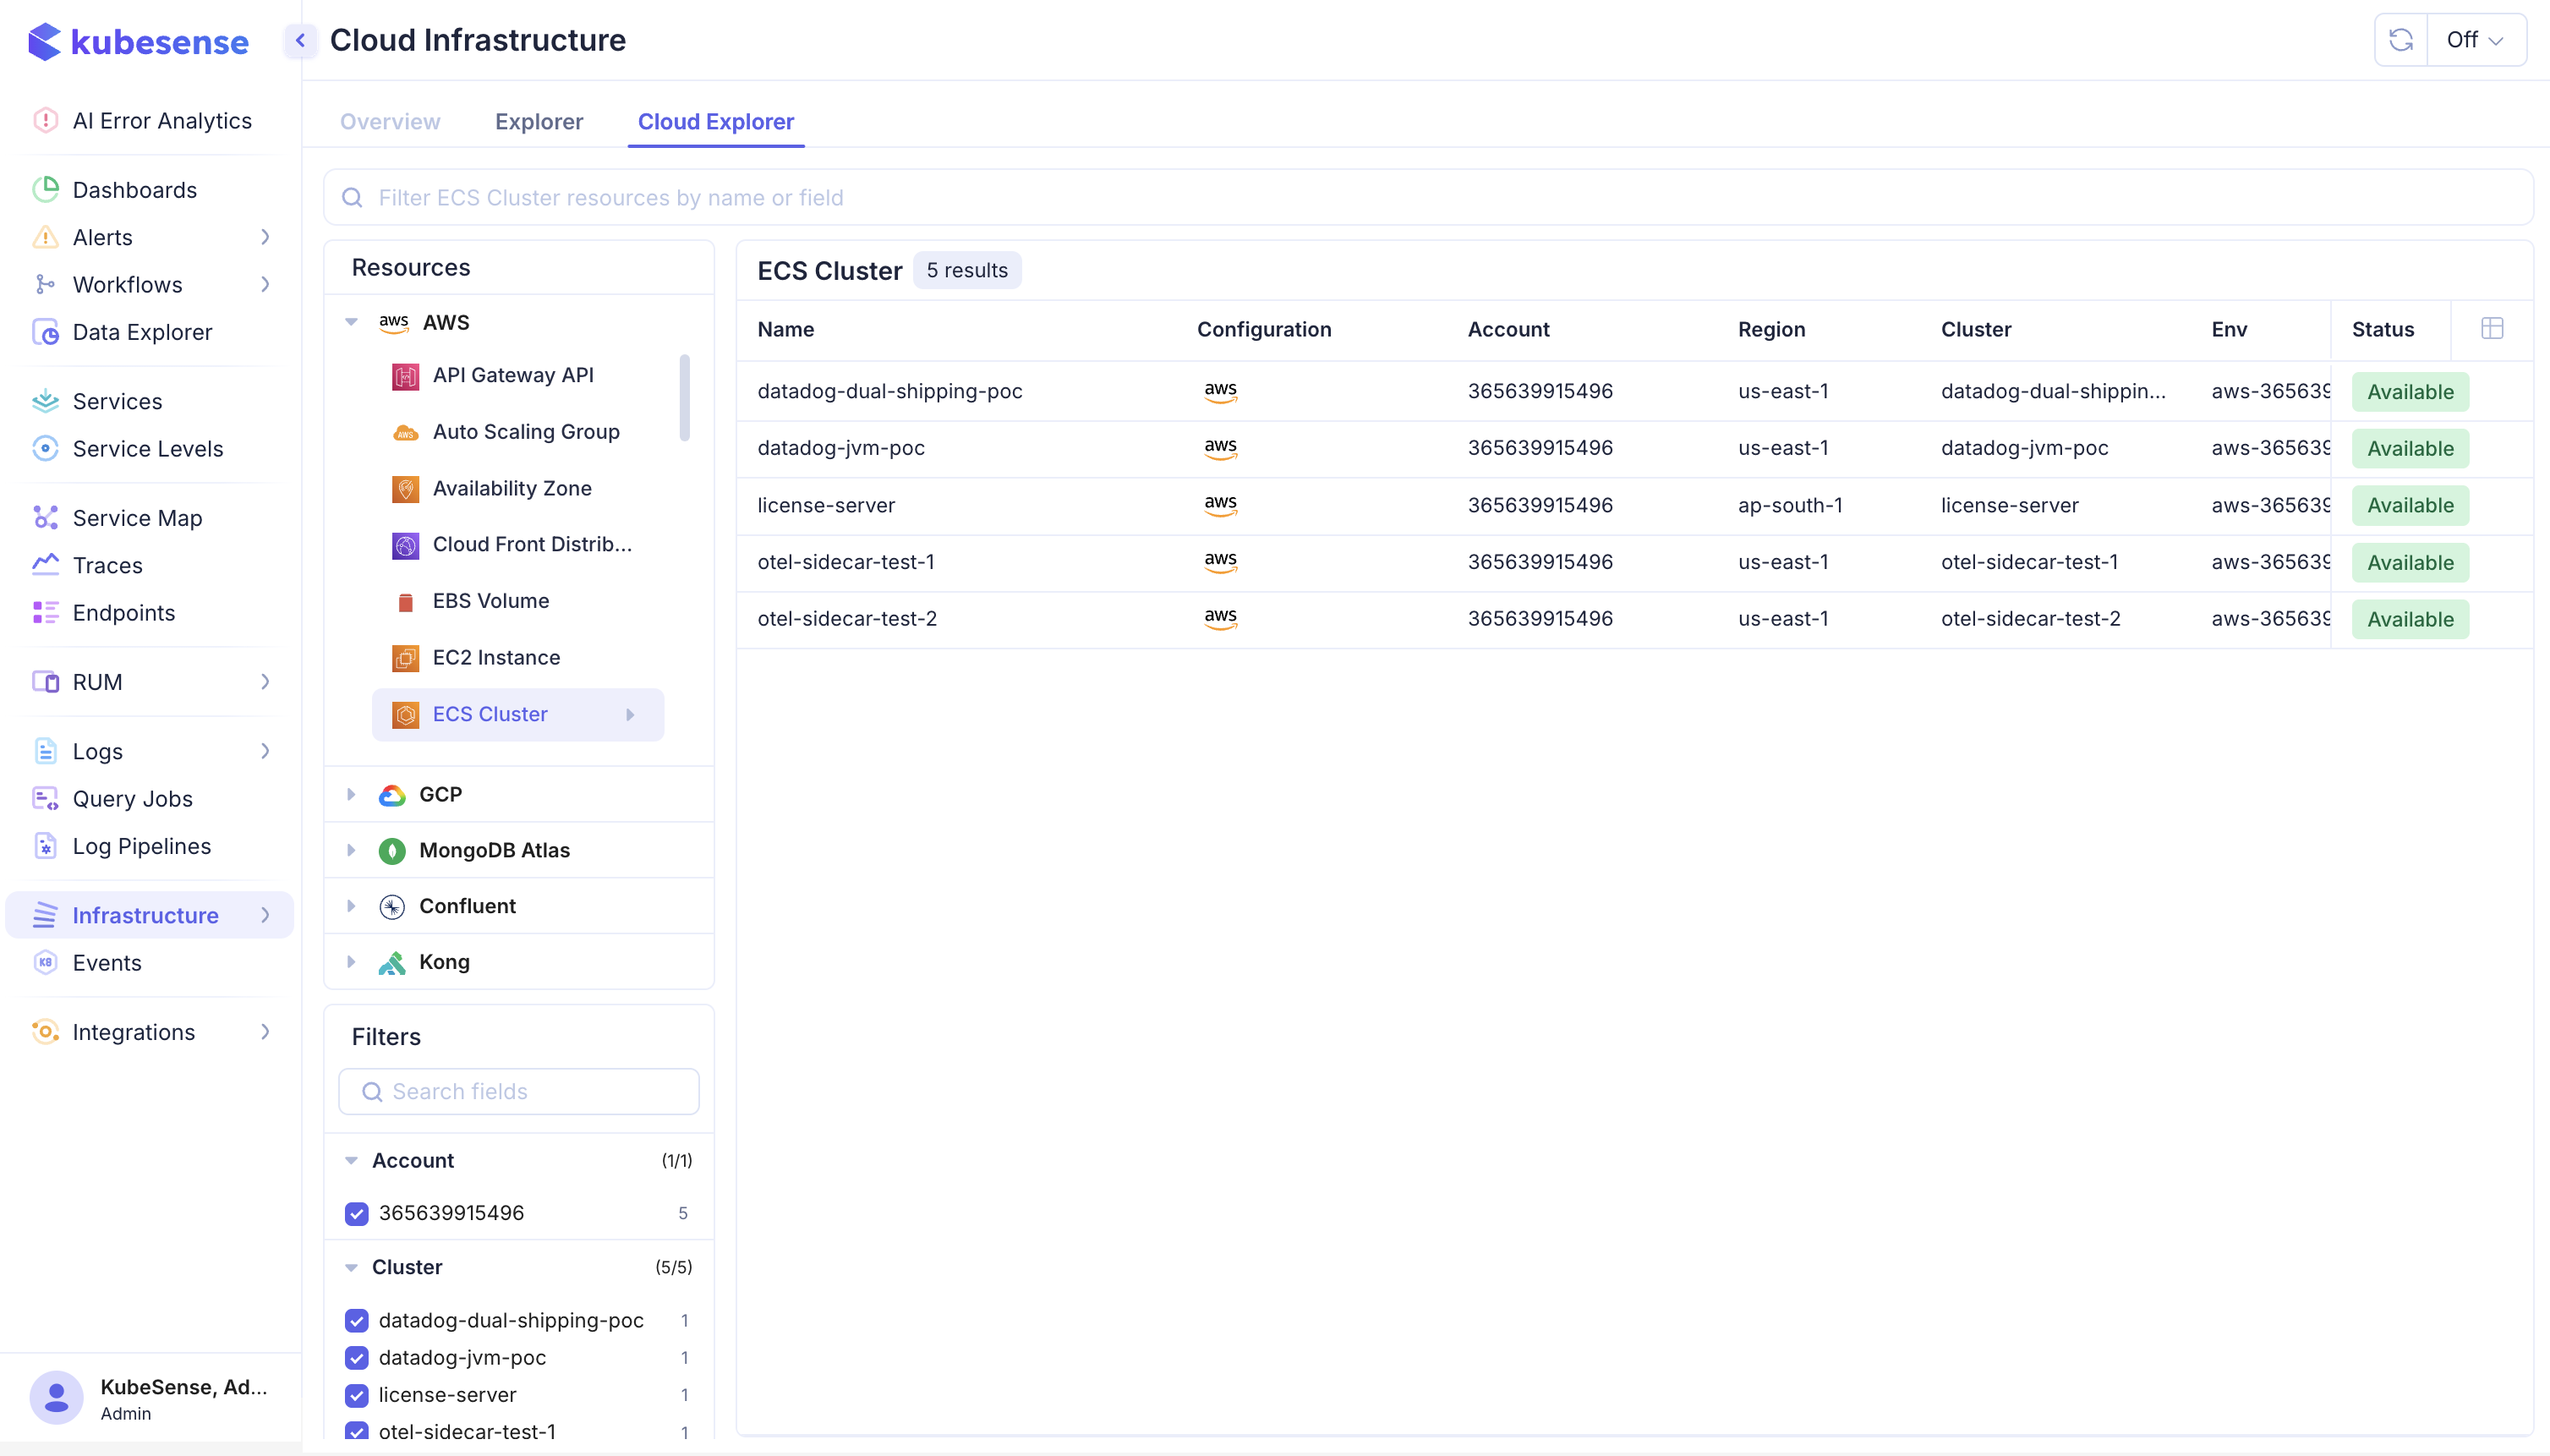
The Resources panel on the left lists the entity kinds produced by the toggles you enabled — the Discovered as column above. Select one to list its resources; the count beside the heading reflects the current filters.
The result table shows the fields that identify a resource — name, account, region, cluster, environment, and status — and the Filters panel below narrows the list by any indexed field, with the match count beside each value. Use the search box at the top to filter the selected resource type by name or field.
Entity kinds from an Inventory only toggle, such as the VPC topology kinds, appear here like any other but have no Metrics tab behind them.
Resource details
Select a resource to open its detail panel beside the list. The header identifies the resource — its provider ID, name, creation time, account, region, environment, and current status — and the arrows step to the next or previous resource without closing the panel.
The panel's tabs depend on what KubeSense has for that resource:
| Tab | Contents |
|---|---|
| Metrics | One chart per metric collected for this resource type, at the configured tier, over the selected time range. Each has a View in Explorer link to open that series in Data Explorer |
| Processes | Processes reported by the host, with PID, CPU, and memory |
| Logs | Log lines correlated to this resource |
| Traces | Traces correlated to this resource |
| Raw | The resource record as KubeSense stores it |
| Metadata | Provider tags and discovered attributes |
The charts on the Metrics tab are the metrics listed for that resource type in Metrics by resource type below, at whichever tier the integration is configured for.
ECS container and task metrics
The EcsContainer metrics below are collected at a finer grain than the rest of ECS, and
under different conditions. Two things decide whether you see them.
They require Container Insights with enhanced observability. Plain Container Insights is not enough: without the enhanced opt-in (available from December 2024), AWS publishes no container-level series at all, and KubeSense discovers nothing to collect. Enable it on the ECS cluster, not in KubeSense. Nothing needs configuring on the KubeSense side to find them — the collector lists what CloudWatch actually publishes rather than guessing, so a cluster without enhanced observability costs no API calls.
They come at two grains. CloudWatch publishes the same container metrics against several dimension sets, and KubeSense collects them as follows:
| Grain | Collected | What it answers |
|---|---|---|
| Per service and container | Always | How one container of a service behaves on average across its tasks |
| Per task and container | Opt-in | How one individual task behaves — whether a single task is hot while its peers are idle |
The per-service grain is the default because its series count is fixed by the number of container definitions. The per-task grain is opt-in because its series count follows the number of running tasks, which changes on every deploy: each new task is a new series, and each is billed per metric on every collection cycle. Turn it on for the services where one task diverging from its peers is a real failure mode, not across an estate.
To enable it, add per_task to the ECS metric extras on the integration. Per-cluster
collection is capped, and the cap is reported in the controller logs if a cluster exceeds
it.
Where these appear: Container metrics are shown on the container itself, not on the service. From a service, open its Tasks tab, select a task, then its Containers tab — the container's Metrics tab carries the CPU, memory, network and storage series listed below. With the per-task grain enabled, each task's containers report their own values; without it, every task of a service shows that service's container average.
Metrics by resource type
Tiers are set per resource type on the integration: Core is the default, and Expanded is a superset adding deeper per-service detail. A metric that depends on an optional provider feature — Enhanced Monitoring on RDS, Container Insights on ECS and EKS, Atlas Search, the Prometheus plugin on Kong — returns nothing until that feature is enabled, and KubeSense simply records nothing for it.
ALB target group
Resource type LoadBalancerTargetGroup — 10 metrics.
| Metric | Namespace | Dimension | Statistic | Unit | Tier |
|---|---|---|---|---|---|
HealthyHostCount | AWS/ApplicationELB | TargetGroup | Average | Count | Core |
UnHealthyHostCount | AWS/ApplicationELB | TargetGroup | Average | Count | Core |
RequestCountPerTarget | AWS/ApplicationELB | TargetGroup | Sum | Count | Core |
HTTPCode_Target_2XX_Count | AWS/ApplicationELB | TargetGroup | Sum | Count | Expanded |
HTTPCode_Target_3XX_Count | AWS/ApplicationELB | TargetGroup | Sum | Count | Expanded |
HTTPCode_Target_4XX_Count | AWS/ApplicationELB | TargetGroup | Sum | Count | Expanded |
HTTPCode_Target_5XX_Count | AWS/ApplicationELB | TargetGroup | Sum | Count | Expanded |
TargetResponseTime | AWS/ApplicationELB | TargetGroup | Average | Seconds | Expanded |
TargetConnectionErrorCount | AWS/ApplicationELB | TargetGroup | Sum | Count | Expanded |
TargetTLSNegotiationErrorCount | AWS/ApplicationELB | TargetGroup | Sum | Count | Expanded |
API Gateway HTTP API
Resource type ApiGatewayHttpApi — 6 metrics.
| Metric | Namespace | Dimension | Statistic | Unit | Tier |
|---|---|---|---|---|---|
Count | AWS/ApiGateway | ApiId | Sum | Count | Core |
4xx | AWS/ApiGateway | ApiId | Sum | Count | Core |
5xx | AWS/ApiGateway | ApiId | Sum | Count | Core |
Latency | AWS/ApiGateway | ApiId | Average | Milliseconds | Core |
IntegrationLatency | AWS/ApiGateway | ApiId | Average | Milliseconds | Expanded |
DataProcessed | AWS/ApiGateway | ApiId | Sum | Bytes | Expanded |
API Gateway REST API
Resource type ApiGatewayApi — 7 metrics.
| Metric | Namespace | Dimension | Statistic | Unit | Tier |
|---|---|---|---|---|---|
Count | AWS/ApiGateway | ApiName | Sum | Count | Core |
4XXError | AWS/ApiGateway | ApiName | Sum | Count | Core |
5XXError | AWS/ApiGateway | ApiName | Sum | Count | Core |
Latency | AWS/ApiGateway | ApiName | Average | Milliseconds | Core |
IntegrationLatency | AWS/ApiGateway | ApiName | Average | Milliseconds | Core |
CacheHitCount | AWS/ApiGateway | ApiName | Sum | Count | Expanded |
CacheMissCount | AWS/ApiGateway | ApiName | Sum | Count | Expanded |
API Gateway WebSocket API
Resource type ApiGatewayWsApi — 7 metrics.
| Metric | Namespace | Dimension | Statistic | Unit | Tier |
|---|---|---|---|---|---|
ConnectCount | AWS/ApiGateway | ApiId | Sum | Count | Core |
MessageCount | AWS/ApiGateway | ApiId | Sum | Count | Core |
ClientError | AWS/ApiGateway | ApiId | Sum | Count | Core |
ExecutionError | AWS/ApiGateway | ApiId | Sum | Count | Core |
IntegrationError | AWS/ApiGateway | ApiId | Sum | Count | Core |
IntegrationLatency | AWS/ApiGateway | ApiId | Average | Milliseconds | Expanded |
DataProcessed | AWS/ApiGateway | ApiId | Sum | Bytes | Expanded |
Application Load Balancer
Resource type LoadBalancer — 21 metrics.
| Metric | Namespace | Dimension | Statistic | Unit | Tier |
|---|---|---|---|---|---|
RequestCount | AWS/ApplicationELB | LoadBalancer | Sum | Count | Core |
TargetResponseTime | AWS/ApplicationELB | LoadBalancer | Average | Seconds | Core |
HTTPCode_Target_4XX_Count | AWS/ApplicationELB | LoadBalancer | Sum | Count | Core |
HTTPCode_Target_5XX_Count | AWS/ApplicationELB | LoadBalancer | Sum | Count | Core |
ActiveConnectionCount | AWS/ApplicationELB | LoadBalancer | Sum | Count | Expanded |
NewConnectionCount | AWS/ApplicationELB | LoadBalancer | Sum | Count | Expanded |
RejectedConnectionCount | AWS/ApplicationELB | LoadBalancer | Sum | Count | Expanded |
ProcessedBytes | AWS/ApplicationELB | LoadBalancer | Sum | Bytes | Expanded |
HTTPCode_ELB_4XX_Count | AWS/ApplicationELB | LoadBalancer | Sum | Count | Expanded |
HTTPCode_ELB_5XX_Count | AWS/ApplicationELB | LoadBalancer | Sum | Count | Expanded |
HTTPCode_ELB_502_Count | AWS/ApplicationELB | LoadBalancer | Sum | Count | Expanded |
HTTPCode_ELB_503_Count | AWS/ApplicationELB | LoadBalancer | Sum | Count | Expanded |
HTTPCode_ELB_504_Count | AWS/ApplicationELB | LoadBalancer | Sum | Count | Expanded |
TargetConnectionErrorCount | AWS/ApplicationELB | LoadBalancer | Sum | Count | Expanded |
TargetTLSNegotiationErrorCount | AWS/ApplicationELB | LoadBalancer | Sum | Count | Expanded |
ClientTLSNegotiationErrorCount | AWS/ApplicationELB | LoadBalancer | Sum | Count | Expanded |
ConsumedLCUs | AWS/ApplicationELB | LoadBalancer | Average | Count | Expanded |
HTTPCode_Target_2XX_Count | AWS/ApplicationELB | LoadBalancer | Sum | Count | Expanded |
HTTPCode_Target_3XX_Count | AWS/ApplicationELB | LoadBalancer | Sum | Count | Expanded |
HTTP_Redirect_Count | AWS/ApplicationELB | LoadBalancer | Sum | Count | Expanded |
HTTP_Fixed_Response_Count | AWS/ApplicationELB | LoadBalancer | Sum | Count | Expanded |
Auto Scaling group
Resource type AutoScalingGroup — 13 metrics.
| Metric | Namespace | Dimension | Statistic | Unit | Tier |
|---|---|---|---|---|---|
GroupMinSize | AWS/AutoScaling | AutoScalingGroupName | Average | Count | Core |
GroupMaxSize | AWS/AutoScaling | AutoScalingGroupName | Average | Count | Core |
GroupDesiredCapacity | AWS/AutoScaling | AutoScalingGroupName | Average | Count | Core |
GroupInServiceInstances | AWS/AutoScaling | AutoScalingGroupName | Average | Count | Core |
GroupPendingInstances | AWS/AutoScaling | AutoScalingGroupName | Average | Count | Core |
GroupStandbyInstances | AWS/AutoScaling | AutoScalingGroupName | Average | Count | Core |
GroupTerminatingInstances | AWS/AutoScaling | AutoScalingGroupName | Average | Count | Core |
GroupTotalInstances | AWS/AutoScaling | AutoScalingGroupName | Average | Count | Core |
GroupInServiceCapacity | AWS/AutoScaling | AutoScalingGroupName | Average | Count | Expanded |
GroupPendingCapacity | AWS/AutoScaling | AutoScalingGroupName | Average | Count | Expanded |
GroupStandbyCapacity | AWS/AutoScaling | AutoScalingGroupName | Average | Count | Expanded |
GroupTerminatingCapacity | AWS/AutoScaling | AutoScalingGroupName | Average | Count | Expanded |
GroupTotalCapacity | AWS/AutoScaling | AutoScalingGroupName | Average | Count | Expanded |
Classic Load Balancer
Resource type ClassicLoadBalancer — 13 metrics.
| Metric | Namespace | Dimension | Statistic | Unit | Tier |
|---|---|---|---|---|---|
RequestCount | AWS/ELB | LoadBalancerName | Sum | Count | Core |
Latency | AWS/ELB | LoadBalancerName | Average | Seconds | Core |
HTTPCode_ELB_5XX | AWS/ELB | LoadBalancerName | Sum | Count | Core |
HTTPCode_Backend_5XX | AWS/ELB | LoadBalancerName | Sum | Count | Core |
HealthyHostCount | AWS/ELB | LoadBalancerName | Average | Count | Core |
UnHealthyHostCount | AWS/ELB | LoadBalancerName | Average | Count | Core |
HTTPCode_ELB_4XX | AWS/ELB | LoadBalancerName | Sum | Count | Expanded |
HTTPCode_Backend_2XX | AWS/ELB | LoadBalancerName | Sum | Count | Expanded |
HTTPCode_Backend_3XX | AWS/ELB | LoadBalancerName | Sum | Count | Expanded |
HTTPCode_Backend_4XX | AWS/ELB | LoadBalancerName | Sum | Count | Expanded |
SurgeQueueLength | AWS/ELB | LoadBalancerName | Maximum | Count | Expanded |
SpilloverCount | AWS/ELB | LoadBalancerName | Sum | Count | Expanded |
BackendConnectionErrors | AWS/ELB | LoadBalancerName | Sum | Count | Expanded |
CloudFront distribution
Resource type CloudFrontDistribution — 14 metrics.
| Metric | Namespace | Dimension | Statistic | Unit | Tier |
|---|---|---|---|---|---|
Requests | AWS/CloudFront | DistributionId | Sum | Count | Core |
BytesDownloaded | AWS/CloudFront | DistributionId | Sum | Bytes | Core |
BytesUploaded | AWS/CloudFront | DistributionId | Sum | Bytes | Core |
4xxErrorRate | AWS/CloudFront | DistributionId | Average | Percent | Core |
5xxErrorRate | AWS/CloudFront | DistributionId | Average | Percent | Core |
TotalErrorRate | AWS/CloudFront | DistributionId | Average | Percent | Core |
401ErrorRate | AWS/CloudFront | DistributionId | Average | Percent | Expanded |
403ErrorRate | AWS/CloudFront | DistributionId | Average | Percent | Expanded |
404ErrorRate | AWS/CloudFront | DistributionId | Average | Percent | Expanded |
502ErrorRate | AWS/CloudFront | DistributionId | Average | Percent | Expanded |
503ErrorRate | AWS/CloudFront | DistributionId | Average | Percent | Expanded |
504ErrorRate | AWS/CloudFront | DistributionId | Average | Percent | Expanded |
OriginLatency | AWS/CloudFront | DistributionId | Average | Milliseconds | Expanded |
CacheHitRate | AWS/CloudFront | DistributionId | Average | Percent | Expanded |
Data Firehose stream
Resource type FirehoseStream — 20 metrics.
| Metric | Namespace | Dimension | Statistic | Unit | Tier |
|---|---|---|---|---|---|
IncomingRecords | AWS/Firehose | DeliveryStreamName | Sum | Count | Core |
IncomingBytes | AWS/Firehose | DeliveryStreamName | Sum | Bytes | Core |
DeliveryToS3.Records | AWS/Firehose | DeliveryStreamName | Sum | Count | Core |
DeliveryToS3.Success | AWS/Firehose | DeliveryStreamName | Average | Percent | Core |
DeliveryToS3.Bytes | AWS/Firehose | DeliveryStreamName | Sum | Bytes | Expanded |
DeliveryToS3.DataFreshness | AWS/Firehose | DeliveryStreamName | Average | Seconds | Expanded |
DescribeDeliveryStream.Latency | AWS/Firehose | DeliveryStreamName | Average | Milliseconds | Expanded |
PutRecord.Bytes | AWS/Firehose | DeliveryStreamName | Sum | Bytes | Expanded |
PutRecord.Latency | AWS/Firehose | DeliveryStreamName | Average | Milliseconds | Expanded |
PutRecord.Requests | AWS/Firehose | DeliveryStreamName | Sum | Count | Expanded |
ThrottledRecords | AWS/Firehose | DeliveryStreamName | Sum | Count | Expanded |
PutRecordBatch.Bytes | AWS/Firehose | DeliveryStreamName | Sum | Bytes | Expanded |
PutRecordBatch.Records | AWS/Firehose | DeliveryStreamName | Sum | Count | Expanded |
PutRecordBatch.Latency | AWS/Firehose | DeliveryStreamName | Average | Milliseconds | Expanded |
PutRecordBatch.Requests | AWS/Firehose | DeliveryStreamName | Sum | Count | Expanded |
BytesPerSecondLimit | AWS/Firehose | DeliveryStreamName | Average | Bytes/Second | Expanded |
RecordsPerSecondLimit | AWS/Firehose | DeliveryStreamName | Average | Count/Second | Expanded |
PutRequestsPerSecondLimit | AWS/Firehose | DeliveryStreamName | Average | Count/Second | Expanded |
KMSKeyAccessDenied | AWS/Firehose | DeliveryStreamName | Sum | Count | Expanded |
KMSKeyNotFound | AWS/Firehose | DeliveryStreamName | Sum | Count | Expanded |
DocumentDB cluster
Resource type DocumentDbCluster — 24 metrics.
| Metric | Namespace | Dimension | Statistic | Unit | Tier |
|---|---|---|---|---|---|
CPUUtilization | AWS/DocDB | DBClusterIdentifier | Average | Percent | Core |
DatabaseConnections | AWS/DocDB | DBClusterIdentifier | Average | Count | Core |
FreeableMemory | AWS/DocDB | DBClusterIdentifier | Average | Bytes | Core |
VolumeBytesUsed | AWS/DocDB | DBClusterIdentifier | Average | Bytes | Core |
ReadIOPS | AWS/DocDB | DBClusterIdentifier | Average | Count/Second | Expanded |
WriteIOPS | AWS/DocDB | DBClusterIdentifier | Average | Count/Second | Expanded |
ReadLatency | AWS/DocDB | DBClusterIdentifier | Average | Milliseconds | Expanded |
WriteLatency | AWS/DocDB | DBClusterIdentifier | Average | Milliseconds | Expanded |
ReadThroughput | AWS/DocDB | DBClusterIdentifier | Average | Bytes/Second | Expanded |
WriteThroughput | AWS/DocDB | DBClusterIdentifier | Average | Bytes/Second | Expanded |
DBClusterReplicaLagMaximum | AWS/DocDB | DBClusterIdentifier | Maximum | Milliseconds | Expanded |
BufferCacheHitRatio | AWS/DocDB | DBClusterIdentifier | Average | Percent | Expanded |
BackupRetentionPeriodStorageUsed | AWS/DocDB | DBClusterIdentifier | Average | Bytes | Expanded |
TotalBackupStorageBilled | AWS/DocDB | DBClusterIdentifier | Average | Bytes | Expanded |
OpcountersInsert | AWS/DocDB | DBClusterIdentifier | Average | Count/Second | Expanded |
OpcountersQuery | AWS/DocDB | DBClusterIdentifier | Average | Count/Second | Expanded |
OpcountersUpdate | AWS/DocDB | DBClusterIdentifier | Average | Count/Second | Expanded |
OpcountersDelete | AWS/DocDB | DBClusterIdentifier | Average | Count/Second | Expanded |
DocumentsInserted | AWS/DocDB | DBClusterIdentifier | Average | Count/Second | Expanded |
DocumentsReturned | AWS/DocDB | DBClusterIdentifier | Average | Count/Second | Expanded |
NetworkThroughput | AWS/DocDB | DBClusterIdentifier | Average | Bytes/Second | Expanded |
VolumeReadIOPs | AWS/DocDB | DBClusterIdentifier | Average | Count | Expanded |
VolumeWriteIOPs | AWS/DocDB | DBClusterIdentifier | Average | Count | Expanded |
DiskQueueDepth | AWS/DocDB | DBClusterIdentifier | Average | Count | Expanded |
DynamoDB table
Resource type DynamoDbTable — 11 metrics.
| Metric | Namespace | Dimension | Statistic | Unit | Tier |
|---|---|---|---|---|---|
ConsumedReadCapacityUnits | AWS/DynamoDB | TableName | Sum | Count | Core |
ConsumedWriteCapacityUnits | AWS/DynamoDB | TableName | Sum | Count | Core |
ThrottledRequests | AWS/DynamoDB | TableName | Sum | Count | Core |
ProvisionedReadCapacityUnits | AWS/DynamoDB | TableName | Average | Count | Expanded |
ProvisionedWriteCapacityUnits | AWS/DynamoDB | TableName | Average | Count | Expanded |
ReadThrottleEvents | AWS/DynamoDB | TableName | Sum | Count | Expanded |
WriteThrottleEvents | AWS/DynamoDB | TableName | Sum | Count | Expanded |
ConditionalCheckFailedRequests | AWS/DynamoDB | TableName | Sum | Count | Expanded |
TransactionConflict | AWS/DynamoDB | TableName | Sum | Count | Expanded |
AgeOfOldestUnreplicatedRecord | AWS/DynamoDB | TableName | Maximum | Milliseconds | Expanded |
TimeToLiveDeletedItemCount | AWS/DynamoDB | TableName | Sum | Count | Expanded |
DynamoDB table (per operation)
Resource type DynamoDbTableOperation — 3 metrics.
| Metric | Namespace | Dimension | Statistic | Unit | Tier |
|---|---|---|---|---|---|
SuccessfulRequestLatency | AWS/DynamoDB | TableName | Average | Milliseconds | Core |
SystemErrors | AWS/DynamoDB | TableName | Sum | Count | Core |
ReturnedItemCount | AWS/DynamoDB | TableName | Sum | Count | Core |
EBS volume
Resource type EbsVolume — 11 metrics.
| Metric | Namespace | Dimension | Statistic | Unit | Tier |
|---|---|---|---|---|---|
VolumeReadBytes | AWS/EBS | VolumeId | Sum | Bytes | Core |
VolumeWriteBytes | AWS/EBS | VolumeId | Sum | Bytes | Core |
VolumeReadOps | AWS/EBS | VolumeId | Sum | Count | Core |
VolumeWriteOps | AWS/EBS | VolumeId | Sum | Count | Core |
VolumeQueueLength | AWS/EBS | VolumeId | Average | Count | Expanded |
VolumeIdleTime | AWS/EBS | VolumeId | Sum | Seconds | Expanded |
VolumeTotalReadTime | AWS/EBS | VolumeId | Sum | Seconds | Expanded |
VolumeTotalWriteTime | AWS/EBS | VolumeId | Sum | Seconds | Expanded |
BurstBalance | AWS/EBS | VolumeId | Average | Percent | Expanded |
VolumeConsumedReadWriteOps | AWS/EBS | VolumeId | Sum | Count | Expanded |
VolumeThroughputPercentage | AWS/EBS | VolumeId | Average | Percent | Expanded |
EBS volume (Nitro instances)
Resource type EbsVolumeNitro — 7 metrics.
| Metric | Namespace | Dimension | Statistic | Unit | Tier |
|---|---|---|---|---|---|
VolumeAvgReadLatency | AWS/EBS | VolumeId | Average | Microseconds | Core |
VolumeAvgWriteLatency | AWS/EBS | VolumeId | Average | Microseconds | Core |
VolumeAvgIOPS | AWS/EBS | VolumeId | Average | Count/Second | Core |
VolumeAvgThroughput | AWS/EBS | VolumeId | Average | Bytes/Second | Core |
VolumeIOPSExceededCheck | AWS/EBS | VolumeId | Maximum | Count | Core |
VolumeThroughputExceededCheck | AWS/EBS | VolumeId | Maximum | Count | Core |
VolumeStalledIOCheck | AWS/EBS | VolumeId | Maximum | Count | Core |
EC2 instance
Resource type Ec2Instance — 22 metrics.
| Metric | Namespace | Dimension | Statistic | Unit | Tier |
|---|---|---|---|---|---|
CPUUtilization | AWS/EC2 | InstanceId | Average | Percent | Core |
NetworkIn | AWS/EC2 | InstanceId | Sum | Bytes | Core |
NetworkOut | AWS/EC2 | InstanceId | Sum | Bytes | Core |
DiskReadBytes | AWS/EC2 | InstanceId | Sum | Bytes | Core |
DiskWriteBytes | AWS/EC2 | InstanceId | Sum | Bytes | Core |
StatusCheckFailed | AWS/EC2 | InstanceId | Maximum | Count | Expanded |
StatusCheckFailed_Instance | AWS/EC2 | InstanceId | Maximum | Count | Expanded |
StatusCheckFailed_System | AWS/EC2 | InstanceId | Maximum | Count | Expanded |
NetworkPacketsIn | AWS/EC2 | InstanceId | Sum | Count | Expanded |
NetworkPacketsOut | AWS/EC2 | InstanceId | Sum | Count | Expanded |
DiskReadOps | AWS/EC2 | InstanceId | Sum | Count | Expanded |
DiskWriteOps | AWS/EC2 | InstanceId | Sum | Count | Expanded |
EBSReadBytes | AWS/EC2 | InstanceId | Sum | Bytes | Expanded |
EBSWriteBytes | AWS/EC2 | InstanceId | Sum | Bytes | Expanded |
EBSReadOps | AWS/EC2 | InstanceId | Sum | Count | Expanded |
EBSWriteOps | AWS/EC2 | InstanceId | Sum | Count | Expanded |
EBSIOBalance% | AWS/EC2 | InstanceId | Average | Percent | Expanded |
EBSByteBalance% | AWS/EC2 | InstanceId | Average | Percent | Expanded |
CPUCreditUsage | AWS/EC2 | InstanceId | Average | Count | Expanded |
CPUCreditBalance | AWS/EC2 | InstanceId | Average | Count | Expanded |
CPUSurplusCreditBalance | AWS/EC2 | InstanceId | Average | Count | Expanded |
CPUSurplusCreditsCharged | AWS/EC2 | InstanceId | Average | Count | Expanded |
ECS cluster
Resource type EcsCluster — 14 metrics.
| Metric | Namespace | Dimension | Statistic | Unit | Tier |
|---|---|---|---|---|---|
CPUUtilization | AWS/ECS | ClusterName | Average | Percent | Core |
MemoryUtilization | AWS/ECS | ClusterName | Average | Percent | Core |
ContainerInstanceCount | ECS/ContainerInsights | ClusterName | Average | Count | Core |
TaskCount | ECS/ContainerInsights | ClusterName | Average | Count | Core |
ServiceCount | ECS/ContainerInsights | ClusterName | Average | Count | Core |
CPUReservation | AWS/ECS | ClusterName | Average | Percent | Expanded |
MemoryReservation | AWS/ECS | ClusterName | Average | Percent | Expanded |
CpuUtilized | ECS/ContainerInsights | ClusterName | Average | Count | Expanded |
MemoryUtilized | ECS/ContainerInsights | ClusterName | Average | Megabytes | Expanded |
NetworkRxBytes | ECS/ContainerInsights | ClusterName | Sum | Bytes | Expanded |
NetworkTxBytes | ECS/ContainerInsights | ClusterName | Sum | Bytes | Expanded |
CpuReserved | ECS/ContainerInsights | ClusterName | Average | Count | Expanded |
MemoryReserved | ECS/ContainerInsights | ClusterName | Average | Megabytes | Expanded |
EphemeralStorageReserved | ECS/ContainerInsights | ClusterName | Average | Gigabytes | Expanded |
ECS container
Resource type EcsContainer — 10 metrics.
| Metric | Namespace | Dimension | Statistic | Unit | Tier |
|---|---|---|---|---|---|
ContainerCpuUtilization | ECS/ContainerInsights | ContainerName | Average | Percent | Core |
ContainerMemoryUtilization | ECS/ContainerInsights | ContainerName | Average | Percent | Core |
ContainerCpuUtilized | ECS/ContainerInsights | ContainerName | Average | Count | Core |
ContainerMemoryUtilized | ECS/ContainerInsights | ContainerName | Average | Megabytes | Core |
ContainerNetworkRxBytes | ECS/ContainerInsights | ContainerName | Sum | Bytes | Core |
ContainerNetworkTxBytes | ECS/ContainerInsights | ContainerName | Sum | Bytes | Core |
ContainerStorageReadBytes | ECS/ContainerInsights | ContainerName | Sum | Bytes | Core |
ContainerStorageWriteBytes | ECS/ContainerInsights | ContainerName | Sum | Bytes | Core |
RestartCount | ECS/ContainerInsights | ContainerName | Sum | Count | Core |
UnHealthyContainerHealthStatus | ECS/ContainerInsights | ContainerName | Maximum | Count | Core |
ECS service
Resource type EcsService — 15 metrics.
| Metric | Namespace | Dimension | Statistic | Unit | Tier |
|---|---|---|---|---|---|
CPUUtilization | AWS/ECS | ServiceName | Average | Percent | Core |
MemoryUtilization | AWS/ECS | ServiceName | Average | Percent | Core |
DesiredTaskCount | ECS/ContainerInsights | ServiceName | Average | Count | Expanded |
PendingTaskCount | ECS/ContainerInsights | ServiceName | Average | Count | Expanded |
RunningTaskCount | ECS/ContainerInsights | ServiceName | Average | Count | Expanded |
StorageReadBytes | ECS/ContainerInsights | ServiceName | Sum | Bytes | Expanded |
StorageWriteBytes | ECS/ContainerInsights | ServiceName | Sum | Bytes | Expanded |
DeploymentCount | ECS/ContainerInsights | ServiceName | Average | Count | Expanded |
CpuUtilized | ECS/ContainerInsights | ServiceName | Average | Count | Expanded |
MemoryUtilized | ECS/ContainerInsights | ServiceName | Average | Megabytes | Expanded |
NetworkRxBytes | ECS/ContainerInsights | ServiceName | Sum | Bytes | Expanded |
NetworkTxBytes | ECS/ContainerInsights | ServiceName | Sum | Bytes | Expanded |
CpuReserved | ECS/ContainerInsights | ServiceName | Average | Count | Expanded |
MemoryReserved | ECS/ContainerInsights | ServiceName | Average | Megabytes | Expanded |
TaskSetCount | ECS/ContainerInsights | ServiceName | Average | Count | Expanded |
ECS task definition
Resource type EcsTaskDefinition — 5 metrics.
| Metric | Namespace | Dimension | Statistic | Unit | Tier |
|---|---|---|---|---|---|
CpuUtilized | ECS/ContainerInsights | TaskDefinitionFamily | Average | Count | Core |
MemoryUtilized | ECS/ContainerInsights | TaskDefinitionFamily | Average | Megabytes | Core |
EphemeralStorageUtilized | ECS/ContainerInsights | TaskDefinitionFamily | Average | Gigabytes | Expanded |
CpuReserved | ECS/ContainerInsights | TaskDefinitionFamily | Average | Count | Expanded |
MemoryReserved | ECS/ContainerInsights | TaskDefinitionFamily | Average | Megabytes | Expanded |
EKS cluster
Resource type EksCluster — 11 metrics.
| Metric | Namespace | Dimension | Statistic | Unit | Tier |
|---|---|---|---|---|---|
cluster_node_count | ContainerInsights | ClusterName | Average | Count | Core |
cluster_failed_node_count | ContainerInsights | ClusterName | Average | Count | Core |
pod_cpu_utilization | ContainerInsights | ClusterName | Average | Percent | Core |
pod_memory_utilization | ContainerInsights | ClusterName | Average | Percent | Core |
node_cpu_utilization | ContainerInsights | ClusterName | Average | Percent | Expanded |
node_memory_utilization | ContainerInsights | ClusterName | Average | Percent | Expanded |
node_filesystem_utilization | ContainerInsights | ClusterName | Average | Percent | Expanded |
node_network_total_bytes | ContainerInsights | ClusterName | Sum | Bytes | Expanded |
pod_number_of_running_containers | ContainerInsights | ClusterName | Average | Count | Expanded |
service_number_of_running_pods | ContainerInsights | ClusterName | Average | Count | Expanded |
namespace_number_of_running_pods | ContainerInsights | ClusterName | Average | Count | Expanded |
ElastiCache cluster
Resource type ElastiCacheCluster — 19 metrics.
| Metric | Namespace | Dimension | Statistic | Unit | Tier |
|---|---|---|---|---|---|
CPUUtilization | AWS/ElastiCache | CacheClusterId | Average | Percent | Core |
CurrConnections | AWS/ElastiCache | CacheClusterId | Average | Count | Core |
CacheHits | AWS/ElastiCache | CacheClusterId | Sum | Count | Core |
CacheMisses | AWS/ElastiCache | CacheClusterId | Sum | Count | Core |
EngineCPUUtilization | AWS/ElastiCache | CacheClusterId | Average | Percent | Expanded |
DatabaseMemoryUsagePercentage | AWS/ElastiCache | CacheClusterId | Average | Percent | Expanded |
BytesUsedForCache | AWS/ElastiCache | CacheClusterId | Average | Bytes | Expanded |
SwapUsage | AWS/ElastiCache | CacheClusterId | Average | Bytes | Expanded |
NetworkBytesIn | AWS/ElastiCache | CacheClusterId | Sum | Bytes | Expanded |
NetworkBytesOut | AWS/ElastiCache | CacheClusterId | Sum | Bytes | Expanded |
NewConnections | AWS/ElastiCache | CacheClusterId | Sum | Count | Expanded |
Evictions | AWS/ElastiCache | CacheClusterId | Sum | Count | Expanded |
Reclaimed | AWS/ElastiCache | CacheClusterId | Sum | Count | Expanded |
ReplicationLag | AWS/ElastiCache | CacheClusterId | Average | Seconds | Expanded |
ReplicationBytes | AWS/ElastiCache | CacheClusterId | Sum | Bytes | Expanded |
CurrItems | AWS/ElastiCache | CacheClusterId | Average | Count | Expanded |
GetTypeCmds | AWS/ElastiCache | CacheClusterId | Sum | Count | Expanded |
SetTypeCmds | AWS/ElastiCache | CacheClusterId | Sum | Count | Expanded |
KeyBasedCmds | AWS/ElastiCache | CacheClusterId | Sum | Count | Expanded |
EventBridge bus
Resource type EventBridgeBus — 12 metrics.
| Metric | Namespace | Dimension | Statistic | Unit | Tier |
|---|---|---|---|---|---|
Invocations | AWS/Events | RuleName | Sum | Count | Core |
FailedInvocations | AWS/Events | RuleName | Sum | Count | Core |
MatchedEvents | AWS/Events | RuleName | Sum | Count | Core |
TriggeredRules | AWS/Events | RuleName | Sum | Count | Core |
ThrottledRules | AWS/Events | RuleName | Sum | Count | Expanded |
InvocationAttempts | AWS/Events | RuleName | Sum | Count | Expanded |
SuccessfulInvocationAttempts | AWS/Events | RuleName | Sum | Count | Expanded |
DeadLetterInvocations | AWS/Events | RuleName | Sum | Count | Expanded |
InvocationsSentToDlq | AWS/Events | RuleName | Sum | Count | Expanded |
InvocationsFailedToBeSentToDlq | AWS/Events | RuleName | Sum | Count | Expanded |
IngestionToInvocationCompleteLatency | AWS/Events | RuleName | Average | Milliseconds | Expanded |
IngestionToInvocationSuccessLatency | AWS/Events | RuleName | Average | Milliseconds | Expanded |
Kinesis Data Stream
Resource type KinesisStream — 15 metrics.
| Metric | Namespace | Dimension | Statistic | Unit | Tier |
|---|---|---|---|---|---|
GetRecords.IteratorAgeMilliseconds | AWS/Kinesis | StreamName | Maximum | Milliseconds | Core |
IncomingRecords | AWS/Kinesis | StreamName | Sum | Count | Core |
IncomingBytes | AWS/Kinesis | StreamName | Sum | Bytes | Core |
GetRecords.Bytes | AWS/Kinesis | StreamName | Sum | Bytes | Expanded |
GetRecords.Records | AWS/Kinesis | StreamName | Sum | Count | Expanded |
GetRecords.Success | AWS/Kinesis | StreamName | Average | Percent | Expanded |
GetRecords.Latency | AWS/Kinesis | StreamName | Average | Milliseconds | Expanded |
PutRecords.Bytes | AWS/Kinesis | StreamName | Sum | Bytes | Expanded |
PutRecords.SuccessfulRecords | AWS/Kinesis | StreamName | Sum | Count | Expanded |
PutRecords.FailedRecords | AWS/Kinesis | StreamName | Sum | Count | Expanded |
PutRecords.ThrottledRecords | AWS/Kinesis | StreamName | Sum | Count | Expanded |
PutRecords.Success | AWS/Kinesis | StreamName | Average | Percent | Expanded |
PutRecords.Latency | AWS/Kinesis | StreamName | Average | Milliseconds | Expanded |
ReadProvisionedThroughputExceeded | AWS/Kinesis | StreamName | Sum | Count | Expanded |
WriteProvisionedThroughputExceeded | AWS/Kinesis | StreamName | Sum | Count | Expanded |
Lambda function
Resource type LambdaFunction — 18 metrics.
| Metric | Namespace | Dimension | Statistic | Unit | Tier |
|---|---|---|---|---|---|
Invocations | AWS/Lambda | FunctionName | Sum | Count | Core |
Errors | AWS/Lambda | FunctionName | Sum | Count | Core |
Duration | AWS/Lambda | FunctionName | Average | Milliseconds | Core |
Throttles | AWS/Lambda | FunctionName | Sum | Count | Core |
ConcurrentExecutions | AWS/Lambda | FunctionName | Maximum | Count | Expanded |
ProvisionedConcurrentExecutions | AWS/Lambda | FunctionName | Maximum | Count | Expanded |
ProvisionedConcurrencyInvocations | AWS/Lambda | FunctionName | Sum | Count | Expanded |
ProvisionedConcurrencySpilloverInvocations | AWS/Lambda | FunctionName | Sum | Count | Expanded |
ProvisionedConcurrencyUtilization | AWS/Lambda | FunctionName | Average | Percent | Expanded |
DeadLetterErrors | AWS/Lambda | FunctionName | Sum | Count | Expanded |
DestinationDeliveryFailures | AWS/Lambda | FunctionName | Sum | Count | Expanded |
IteratorAge | AWS/Lambda | FunctionName | Maximum | Milliseconds | Expanded |
OffsetLag | AWS/Lambda | FunctionName | Maximum | Count | Expanded |
AsyncEventsReceived | AWS/Lambda | FunctionName | Sum | Count | Expanded |
AsyncEventAge | AWS/Lambda | FunctionName | Maximum | Milliseconds | Expanded |
AsyncEventsDropped | AWS/Lambda | FunctionName | Sum | Count | Expanded |
PostRuntimeExtensionsDuration | AWS/Lambda | FunctionName | Average | Milliseconds | Expanded |
RecursiveInvocationsDropped | AWS/Lambda | FunctionName | Sum | Count | Expanded |
MSK broker
Resource type MskBroker — 21 metrics.
| Metric | Namespace | Dimension | Statistic | Unit | Tier |
|---|---|---|---|---|---|
CpuUser | AWS/Kafka | Broker ID | Average | Percent | Core |
CpuSystem | AWS/Kafka | Broker ID | Average | Percent | Core |
CpuIdle | AWS/Kafka | Broker ID | Average | Percent | Core |
MemoryUsed | AWS/Kafka | Broker ID | Average | Bytes | Core |
KafkaDataLogsDiskUsed | AWS/Kafka | Broker ID | Average | Percent | Core |
BytesInPerSec | AWS/Kafka | Broker ID | Average | Bytes/Second | Core |
BytesOutPerSec | AWS/Kafka | Broker ID | Average | Bytes/Second | Core |
MessagesInPerSec | AWS/Kafka | Broker ID | Average | Count/Second | Core |
ConnectionCount | AWS/Kafka | Broker ID | Average | Count | Core |
UnderReplicatedPartitions | AWS/Kafka | Broker ID | Sum | Count | Core |
CpuIoWait | AWS/Kafka | Broker ID | Average | Percent | Expanded |
MemoryFree | AWS/Kafka | Broker ID | Average | Bytes | Expanded |
HeapMemoryAfterGC | AWS/Kafka | Broker ID | Average | Percent | Expanded |
KafkaAppLogsDiskUsed | AWS/Kafka | Broker ID | Average | Percent | Expanded |
RootDiskUsed | AWS/Kafka | Broker ID | Average | Percent | Expanded |
LeaderCount | AWS/Kafka | Broker ID | Sum | Count | Expanded |
PartitionCount | AWS/Kafka | Broker ID | Sum | Count | Expanded |
UnderMinIsrPartitionCount | AWS/Kafka | Broker ID | Sum | Count | Expanded |
ZooKeeperRequestLatencyMsMean | AWS/Kafka | Broker ID | Average | Milliseconds | Expanded |
NetworkRxPackets | AWS/Kafka | Broker ID | Sum | Count | Expanded |
NetworkTxPackets | AWS/Kafka | Broker ID | Sum | Count | Expanded |
MSK cluster
Resource type MskCluster — 4 metrics.
| Metric | Namespace | Dimension | Statistic | Unit | Tier |
|---|---|---|---|---|---|
ActiveControllerCount | AWS/Kafka | Cluster Name | Sum | Count | Core |
OfflinePartitionsCount | AWS/Kafka | Cluster Name | Sum | Count | Core |
GlobalPartitionCount | AWS/Kafka | Cluster Name | Sum | Count | Core |
GlobalTopicCount | AWS/Kafka | Cluster Name | Sum | Count | Core |
Neptune cluster
Resource type NeptuneCluster — 15 metrics.
| Metric | Namespace | Dimension | Statistic | Unit | Tier |
|---|---|---|---|---|---|
CPUUtilization | AWS/Neptune | DBClusterIdentifier | Average | Percent | Core |
GremlinWebSocketOpenConnections | AWS/Neptune | DBClusterIdentifier | Sum | Count | Core |
FreeableMemory | AWS/Neptune | DBClusterIdentifier | Average | Bytes | Core |
GremlinRequestsPerSec | AWS/Neptune | DBClusterIdentifier | Sum | Count | Core |
SparqlRequestsPerSec | AWS/Neptune | DBClusterIdentifier | Sum | Count | Expanded |
OpenCypherRequestsPerSec | AWS/Neptune | DBClusterIdentifier | Sum | Count | Expanded |
MainRequestQueuePendingRequests | AWS/Neptune | DBClusterIdentifier | Average | Count | Expanded |
BackupRetentionPeriodStorageUsed | AWS/Neptune | DBClusterIdentifier | Average | Bytes | Expanded |
TotalBackupStorageBilled | AWS/Neptune | DBClusterIdentifier | Average | Bytes | Expanded |
ClusterReplicaLag | AWS/Neptune | DBClusterIdentifier | Average | Milliseconds | Expanded |
ClusterReplicaLagMaximum | AWS/Neptune | DBClusterIdentifier | Maximum | Milliseconds | Expanded |
BufferCacheHitRatio | AWS/Neptune | DBClusterIdentifier | Average | Percent | Expanded |
OpenCypherBoltOpenConnections | AWS/Neptune | DBClusterIdentifier | Sum | Count | Expanded |
GremlinServerErrorsPerSec | AWS/Neptune | DBClusterIdentifier | Average | Count/Second | Expanded |
TotalServerErrorsPerSec | AWS/Neptune | DBClusterIdentifier | Average | Count/Second | Expanded |
Network Load Balancer
Resource type NetworkLoadBalancer — 11 metrics.
| Metric | Namespace | Dimension | Statistic | Unit | Tier |
|---|---|---|---|---|---|
ActiveFlowCount | AWS/NetworkELB | LoadBalancer | Average | Count | Core |
NewFlowCount | AWS/NetworkELB | LoadBalancer | Sum | Count | Core |
ProcessedBytes | AWS/NetworkELB | LoadBalancer | Sum | Bytes | Core |
TCP_ELB_Reset_Count | AWS/NetworkELB | LoadBalancer | Sum | Count | Core |
TCP_Target_Reset_Count | AWS/NetworkELB | LoadBalancer | Sum | Count | Core |
TCP_Client_Reset_Count | AWS/NetworkELB | LoadBalancer | Sum | Count | Expanded |
ConsumedLCUs | AWS/NetworkELB | LoadBalancer | Average | Count | Expanded |
PeakBytesPerSecond | AWS/NetworkELB | LoadBalancer | Maximum | Bytes/Second | Expanded |
PeakPacketsPerSecond | AWS/NetworkELB | LoadBalancer | Maximum | Count/Second | Expanded |
PortAllocationErrorCount | AWS/NetworkELB | LoadBalancer | Sum | Count | Expanded |
ProcessedPackets | AWS/NetworkELB | LoadBalancer | Sum | Count | Expanded |
NLB target group
Resource type NetworkLoadBalancerTargetGroup — 2 metrics.
| Metric | Namespace | Dimension | Statistic | Unit | Tier |
|---|---|---|---|---|---|
HealthyHostCount | AWS/NetworkELB | TargetGroup | Average | Count | Core |
UnHealthyHostCount | AWS/NetworkELB | TargetGroup | Average | Count | Core |
OpenSearch domain
Resource type OpenSearchDomain — 36 metrics.
| Metric | Namespace | Dimension | Statistic | Unit | Tier |
|---|---|---|---|---|---|
CPUUtilization | AWS/ES | DomainName | Average | Percent | Core |
JVMMemoryPressure | AWS/ES | DomainName | Average | Percent | Core |
ClusterStatus.red | AWS/ES | DomainName | Maximum | Count | Core |
ClusterStatus.yellow | AWS/ES | DomainName | Maximum | Count | Core |
SearchLatency | AWS/ES | DomainName | Average | Milliseconds | Core |
IndexingLatency | AWS/ES | DomainName | Average | Milliseconds | Core |
SearchRate | AWS/ES | DomainName | Sum | Count | Expanded |
IndexingRate | AWS/ES | DomainName | Sum | Count | Expanded |
SearchableDocuments | AWS/ES | DomainName | Average | Count | Expanded |
DeletedDocuments | AWS/ES | DomainName | Average | Count | Expanded |
FreeStorageSpace | AWS/ES | DomainName | Average | Megabytes | Expanded |
ClusterUsedSpace | AWS/ES | DomainName | Average | Megabytes | Expanded |
Nodes | AWS/ES | DomainName | Average | Count | Expanded |
MasterCPUUtilization | AWS/ES | DomainName | Average | Percent | Expanded |
MasterJVMMemoryPressure | AWS/ES | DomainName | Average | Percent | Expanded |
MasterReachableFromNode | AWS/ES | DomainName | Maximum | Count | Expanded |
AutomatedSnapshotFailure | AWS/ES | DomainName | Maximum | Count | Expanded |
ThreadpoolSearchQueue | AWS/ES | DomainName | Average | Count | Expanded |
ThreadpoolWriteQueue | AWS/ES | DomainName | Average | Count | Expanded |
ThreadpoolSearchRejected | AWS/ES | DomainName | Sum | Count | Expanded |
ThreadpoolWriteRejected | AWS/ES | DomainName | Sum | Count | Expanded |
ClusterIndexWritesBlocked | AWS/ES | DomainName | Maximum | Count | Expanded |
ClusterStatus.green | AWS/ES | DomainName | Maximum | Count | Expanded |
Shards.active | AWS/ES | DomainName | Average | Count | Expanded |
Shards.unassigned | AWS/ES | DomainName | Average | Count | Expanded |
5xx | AWS/ES | DomainName | Sum | Count | Expanded |
JVMGCYoungCollectionCount | AWS/ES | DomainName | Sum | Count | Expanded |
JVMGCYoungCollectionTime | AWS/ES | DomainName | Average | Milliseconds | Expanded |
JVMGCOldCollectionCount | AWS/ES | DomainName | Sum | Count | Expanded |
JVMGCOldCollectionTime | AWS/ES | DomainName | Average | Milliseconds | Expanded |
OldGenJVMMemoryPressure | AWS/ES | DomainName | Average | Percent | Expanded |
CoordinatingWriteRejected | AWS/ES | DomainName | Sum | Count | Expanded |
PrimaryWriteRejected | AWS/ES | DomainName | Sum | Count | Expanded |
ReplicaWriteRejected | AWS/ES | DomainName | Sum | Count | Expanded |
KMSKeyError | AWS/ES | DomainName | Maximum | Count | Expanded |
KMSKeyInaccessible | AWS/ES | DomainName | Maximum | Count | Expanded |
RDS / Aurora cluster
Resource type RdsCluster — 3 metrics.
| Metric | Namespace | Dimension | Statistic | Unit | Tier |
|---|---|---|---|---|---|
VolumeBytesUsed | AWS/RDS | DBClusterIdentifier | Average | Bytes | Core |
VolumeReadIOPs | AWS/RDS | DBClusterIdentifier | Average | Count | Core |
VolumeWriteIOPs | AWS/RDS | DBClusterIdentifier | Average | Count | Core |
RDS instance
Resource type RdsInstance — 52 metrics.
| Metric | Namespace | Dimension | Statistic | Unit | Tier |
|---|---|---|---|---|---|
CPUUtilization | AWS/RDS | DBInstanceIdentifier | Average | Percent | Core |
FreeStorageSpace | AWS/RDS | DBInstanceIdentifier | Average | Bytes | Core |
DatabaseConnections | AWS/RDS | DBInstanceIdentifier | Average | Count | Core |
FreeableMemory | AWS/RDS | DBInstanceIdentifier | Average | Bytes | Core |
ReadIOPS | AWS/RDS | DBInstanceIdentifier | Average | Count/Second | Expanded |
WriteIOPS | AWS/RDS | DBInstanceIdentifier | Average | Count/Second | Expanded |
ReadLatency | AWS/RDS | DBInstanceIdentifier | Average | Seconds | Expanded |
WriteLatency | AWS/RDS | DBInstanceIdentifier | Average | Seconds | Expanded |
ReadThroughput | AWS/RDS | DBInstanceIdentifier | Average | Bytes/Second | Expanded |
WriteThroughput | AWS/RDS | DBInstanceIdentifier | Average | Bytes/Second | Expanded |
DiskQueueDepth | AWS/RDS | DBInstanceIdentifier | Average | Count | Expanded |
NetworkReceiveThroughput | AWS/RDS | DBInstanceIdentifier | Average | Bytes/Second | Expanded |
NetworkTransmitThroughput | AWS/RDS | DBInstanceIdentifier | Average | Bytes/Second | Expanded |
ReplicaLag | AWS/RDS | DBInstanceIdentifier | Average | Seconds | Expanded |
AuroraReplicaLag | AWS/RDS | DBInstanceIdentifier | Average | Milliseconds | Expanded |
SwapUsage | AWS/RDS | DBInstanceIdentifier | Average | Bytes | Expanded |
Deadlocks | AWS/RDS | DBInstanceIdentifier | Sum | Count/Second | Expanded |
BurstBalance | AWS/RDS | DBInstanceIdentifier | Average | Percent | Expanded |
BinLogDiskUsage | AWS/RDS | DBInstanceIdentifier | Average | Bytes | Expanded |
DBLoad | AWS/RDS | DBInstanceIdentifier | Average | Count | Expanded |
DBLoadCPU | AWS/RDS | DBInstanceIdentifier | Average | Count | Expanded |
DBLoadNonCPU | AWS/RDS | DBInstanceIdentifier | Average | Count | Expanded |
EBSByteBalance% | AWS/RDS | DBInstanceIdentifier | Average | Percent | Expanded |
EBSIOBalance% | AWS/RDS | DBInstanceIdentifier | Average | Percent | Expanded |
MaximumUsedTransactionIDs | AWS/RDS | DBInstanceIdentifier | Average | Count | Expanded |
CPUCreditUsage | AWS/RDS | DBInstanceIdentifier | Average | Count | Expanded |
CPUCreditBalance | AWS/RDS | DBInstanceIdentifier | Average | Count | Expanded |
TransactionLogsDiskUsage | AWS/RDS | DBInstanceIdentifier | Average | Bytes | Expanded |
TransactionLogsGeneration | AWS/RDS | DBInstanceIdentifier | Average | Bytes/Second | Expanded |
ReplicationSlotDiskUsage | AWS/RDS | DBInstanceIdentifier | Average | Bytes | Expanded |
OldestReplicationSlotLag | AWS/RDS | DBInstanceIdentifier | Average | Bytes | Expanded |
EngineUptime | AWS/RDS | DBInstanceIdentifier | Average | Seconds | Expanded |
FreeLocalStorage | AWS/RDS | DBInstanceIdentifier | Average | Bytes | Expanded |
BufferCacheHitRatio | AWS/RDS | DBInstanceIdentifier | Average | Percent | Expanded |
CheckpointLag | AWS/RDS | DBInstanceIdentifier | Average | Seconds | Expanded |
AuroraReplicaLagMaximum | AWS/RDS | DBInstanceIdentifier | Average | Milliseconds | Expanded |
AuroraReplicaLagMinimum | AWS/RDS | DBInstanceIdentifier | Average | Milliseconds | Expanded |
CommitLatency | AWS/RDS | DBInstanceIdentifier | Average | Milliseconds | Expanded |
CommitThroughput | AWS/RDS | DBInstanceIdentifier | Average | Count/Second | Expanded |
DDLLatency | AWS/RDS | DBInstanceIdentifier | Average | Milliseconds | Expanded |
DDLThroughput | AWS/RDS | DBInstanceIdentifier | Average | Count/Second | Expanded |
DMLLatency | AWS/RDS | DBInstanceIdentifier | Average | Milliseconds | Expanded |
DMLThroughput | AWS/RDS | DBInstanceIdentifier | Average | Count/Second | Expanded |
SelectLatency | AWS/RDS | DBInstanceIdentifier | Average | Milliseconds | Expanded |
SelectThroughput | AWS/RDS | DBInstanceIdentifier | Average | Count/Second | Expanded |
InsertLatency | AWS/RDS | DBInstanceIdentifier | Average | Milliseconds | Expanded |
InsertThroughput | AWS/RDS | DBInstanceIdentifier | Average | Count/Second | Expanded |
UpdateLatency | AWS/RDS | DBInstanceIdentifier | Average | Milliseconds | Expanded |
UpdateThroughput | AWS/RDS | DBInstanceIdentifier | Average | Count/Second | Expanded |
DeleteLatency | AWS/RDS | DBInstanceIdentifier | Average | Milliseconds | Expanded |
DeleteThroughput | AWS/RDS | DBInstanceIdentifier | Average | Count/Second | Expanded |
Queries | AWS/RDS | DBInstanceIdentifier | Average | Count/Second | Expanded |
Redshift cluster
Resource type RedshiftCluster — 12 metrics.
| Metric | Namespace | Dimension | Statistic | Unit | Tier |
|---|---|---|---|---|---|
CPUUtilization | AWS/Redshift | ClusterIdentifier | Average | Percent | Core |
DatabaseConnections | AWS/Redshift | ClusterIdentifier | Average | Count | Core |
HealthStatus | AWS/Redshift | ClusterIdentifier | Average | None | Core |
PercentageDiskSpaceUsed | AWS/Redshift | ClusterIdentifier | Average | Percent | Core |
NetworkReceiveThroughput | AWS/Redshift | ClusterIdentifier | Average | Bytes/Second | Expanded |
NetworkTransmitThroughput | AWS/Redshift | ClusterIdentifier | Average | Bytes/Second | Expanded |
ReadThroughput | AWS/Redshift | ClusterIdentifier | Average | Bytes/Second | Expanded |
WriteThroughput | AWS/Redshift | ClusterIdentifier | Average | Bytes/Second | Expanded |
ReadLatency | AWS/Redshift | ClusterIdentifier | Average | Seconds | Expanded |
WriteLatency | AWS/Redshift | ClusterIdentifier | Average | Seconds | Expanded |
CommitQueueLength | AWS/Redshift | ClusterIdentifier | Average | Count | Expanded |
MaintenanceMode | AWS/Redshift | ClusterIdentifier | Maximum | Count | Expanded |
Redshift cluster (query latency)
Resource type RedshiftClusterLatency — 2 metrics.
| Metric | Namespace | Dimension | Statistic | Unit | Tier |
|---|---|---|---|---|---|
QueriesCompletedPerSecond | AWS/Redshift | ClusterIdentifier | Average | Count/Second | Expanded |
QueryDuration | AWS/Redshift | ClusterIdentifier | Average | Microseconds | Expanded |
Route 53 health check
Resource type Route53HealthCheck — 6 metrics.
| Metric | Namespace | Dimension | Statistic | Unit | Tier |
|---|---|---|---|---|---|
HealthCheckStatus | AWS/Route53 | HealthCheckId | Minimum | None | Core |
HealthCheckPercentageHealthy | AWS/Route53 | HealthCheckId | Average | Percent | Core |
ConnectionTime | AWS/Route53 | HealthCheckId | Average | Milliseconds | Expanded |
TimeToFirstByte | AWS/Route53 | HealthCheckId | Average | Milliseconds | Expanded |
SSLHandshakeTime | AWS/Route53 | HealthCheckId | Average | Milliseconds | Expanded |
ChildHealthCheckHealthyCount | AWS/Route53 | HealthCheckId | Average | Count | Expanded |
Route 53 hosted zone
Resource type Route53HostedZone — 3 metrics.
| Metric | Namespace | Dimension | Statistic | Unit | Tier |
|---|---|---|---|---|---|
DNSQueries | AWS/Route53 | HostedZoneId | Sum | Count | Core |
DNSSECInternalFailure | AWS/Route53 | HostedZoneId | Maximum | Count | Expanded |
DNSSECKeySigningKeysNeedingAction | AWS/Route53 | HostedZoneId | Maximum | Count | Expanded |
S3 bucket
Resource type S3Bucket — 18 metrics.
| Metric | Namespace | Dimension | Statistic | Unit | Tier |
|---|---|---|---|---|---|
BucketSizeBytes | AWS/S3 | BucketName | Average | Bytes | Core |
NumberOfObjects | AWS/S3 | BucketName | Average | Count | Core |
AllRequests | AWS/S3 | BucketName | Sum | Count | Expanded |
GetRequests | AWS/S3 | BucketName | Sum | Count | Expanded |
PutRequests | AWS/S3 | BucketName | Sum | Count | Expanded |
DeleteRequests | AWS/S3 | BucketName | Sum | Count | Expanded |
HeadRequests | AWS/S3 | BucketName | Sum | Count | Expanded |
PostRequests | AWS/S3 | BucketName | Sum | Count | Expanded |
ListRequests | AWS/S3 | BucketName | Sum | Count | Expanded |
SelectRequests | AWS/S3 | BucketName | Sum | Count | Expanded |
FirstByteLatency | AWS/S3 | BucketName | Average | Milliseconds | Expanded |
TotalRequestLatency | AWS/S3 | BucketName | Average | Milliseconds | Expanded |
BytesDownloaded | AWS/S3 | BucketName | Sum | Bytes | Expanded |
BytesUploaded | AWS/S3 | BucketName | Sum | Bytes | Expanded |
4xxErrors | AWS/S3 | BucketName | Sum | Count | Expanded |
5xxErrors | AWS/S3 | BucketName | Sum | Count | Expanded |
SelectBytesScanned | AWS/S3 | BucketName | Sum | Bytes | Expanded |
SelectBytesReturned | AWS/S3 | BucketName | Sum | Bytes | Expanded |
SageMaker endpoint
Resource type SageMakerEndpoint — 14 metrics.
| Metric | Namespace | Dimension | Statistic | Unit | Tier |
|---|---|---|---|---|---|
Invocations | AWS/SageMaker | EndpointName | Sum | Count | Core |
InvocationsPerInstance | AWS/SageMaker | EndpointName | Sum | Count | Core |
ModelLatency | AWS/SageMaker | EndpointName | Average | Microseconds | Core |
OverheadLatency | AWS/SageMaker | EndpointName | Average | Microseconds | Core |
Invocation4XXErrors | AWS/SageMaker | EndpointName | Sum | Count | Core |
Invocation5XXErrors | AWS/SageMaker | EndpointName | Sum | Count | Core |
InvocationModelErrors | AWS/SageMaker | EndpointName | Sum | Count | Core |
CPUUtilization | /aws/sagemaker/Endpoints | EndpointName | Average | Percent | Expanded |
MemoryUtilization | /aws/sagemaker/Endpoints | EndpointName | Average | Percent | Expanded |
GPUUtilization | /aws/sagemaker/Endpoints | EndpointName | Average | Percent | Expanded |
GPUMemoryUtilization | /aws/sagemaker/Endpoints | EndpointName | Average | Percent | Expanded |
DiskUtilization | /aws/sagemaker/Endpoints | EndpointName | Average | Percent | Expanded |
ModelSetupTime | AWS/SageMaker | EndpointName | Average | Microseconds | Expanded |
InvocationsPerCopy | AWS/SageMaker | EndpointName | Sum | Count | Expanded |
SNS topic
Resource type SnsTopic — 9 metrics.
| Metric | Namespace | Dimension | Statistic | Unit | Tier |
|---|---|---|---|---|---|
NumberOfMessagesPublished | AWS/SNS | TopicName | Sum | Count | Core |
NumberOfNotificationsDelivered | AWS/SNS | TopicName | Sum | Count | Core |
NumberOfNotificationsFailed | AWS/SNS | TopicName | Sum | Count | Core |
NumberOfNotificationsFilteredOut | AWS/SNS | TopicName | Sum | Count | Expanded |
NumberOfNotificationsFilteredOut-NoMessageAttributes | AWS/SNS | TopicName | Sum | Count | Expanded |
NumberOfNotificationsFilteredOut-InvalidAttributes | AWS/SNS | TopicName | Sum | Count | Expanded |
NumberOfNotificationsRedrivenToDlq | AWS/SNS | TopicName | Sum | Count | Expanded |
NumberOfNotificationsFailedToRedriveToDlq | AWS/SNS | TopicName | Sum | Count | Expanded |
PublishSize | AWS/SNS | TopicName | Average | Bytes | Expanded |
SQS queue
Resource type SqsQueue — 9 metrics.
| Metric | Namespace | Dimension | Statistic | Unit | Tier |
|---|---|---|---|---|---|
NumberOfMessagesSent | AWS/SQS | QueueName | Sum | Count | Core |
ApproximateNumberOfMessagesVisible | AWS/SQS | QueueName | Average | Count | Core |
NumberOfMessagesDeleted | AWS/SQS | QueueName | Sum | Count | Core |
ApproximateAgeOfOldestMessage | AWS/SQS | QueueName | Maximum | Seconds | Expanded |
ApproximateNumberOfMessagesNotVisible | AWS/SQS | QueueName | Average | Count | Expanded |
ApproximateNumberOfMessagesDelayed | AWS/SQS | QueueName | Average | Count | Expanded |
NumberOfMessagesReceived | AWS/SQS | QueueName | Sum | Count | Expanded |
NumberOfEmptyReceives | AWS/SQS | QueueName | Sum | Count | Expanded |
SentMessageSize | AWS/SQS | QueueName | Average | Bytes | Expanded |
Step Functions state machine
Resource type StepFunctionsStateMachine — 7 metrics.
| Metric | Namespace | Dimension | Statistic | Unit | Tier |
|---|---|---|---|---|---|
ExecutionsStarted | AWS/States | StateMachineArn | Sum | Count | Core |
ExecutionsSucceeded | AWS/States | StateMachineArn | Sum | Count | Core |
ExecutionsFailed | AWS/States | StateMachineArn | Sum | Count | Core |
ExecutionsTimedOut | AWS/States | StateMachineArn | Sum | Count | Core |
ExecutionTime | AWS/States | StateMachineArn | Average | Milliseconds | Core |
ExecutionsAborted | AWS/States | StateMachineArn | Sum | Count | Expanded |
ExecutionThrottled | AWS/States | StateMachineArn | Sum | Count | Expanded |
Transit Gateway
Resource type TransitGateway — 8 metrics.
| Metric | Namespace | Dimension | Statistic | Unit | Tier |
|---|---|---|---|---|---|
BytesIn | AWS/TransitGateway | TransitGateway | Sum | Bytes | Core |
BytesOut | AWS/TransitGateway | TransitGateway | Sum | Bytes | Core |
PacketsIn | AWS/TransitGateway | TransitGateway | Sum | Count | Core |
PacketsOut | AWS/TransitGateway | TransitGateway | Sum | Count | Core |
PacketDropCountBlackhole | AWS/TransitGateway | TransitGateway | Sum | Count | Core |
PacketDropCountNoRoute | AWS/TransitGateway | TransitGateway | Sum | Count | Expanded |
BytesDropCountBlackhole | AWS/TransitGateway | TransitGateway | Sum | Bytes | Expanded |
BytesDropCountNoRoute | AWS/TransitGateway | TransitGateway | Sum | Bytes | Expanded |
WAF web ACL
Resource type WafWebAcl — 10 metrics.
| Metric | Namespace | Dimension | Statistic | Unit | Tier |
|---|---|---|---|---|---|
AllowedRequests | AWS/WAFV2 | WebACL | Sum | Count | Core |
BlockedRequests | AWS/WAFV2 | WebACL | Sum | Count | Core |
CountedRequests | AWS/WAFV2 | WebACL | Sum | Count | Core |
PassedRequests | AWS/WAFV2 | WebACL | Sum | Count | Core |
RequestsWithValidCaptchaToken | AWS/WAFV2 | WebACL | Sum | Count | Expanded |
RequestsWithValidChallengeToken | AWS/WAFV2 | WebACL | Sum | Count | Expanded |
CaptchaRequests | AWS/WAFV2 | WebACL | Sum | Count | Expanded |
ChallengeRequests | AWS/WAFV2 | WebACL | Sum | Count | Expanded |
CaptchasSolved | AWS/WAFV2 | WebACL | Sum | Count | Expanded |
ChallengesSolved | AWS/WAFV2 | WebACL | Sum | Count | Expanded |
RDS Performance Insights
Resource type PerformanceInsights — 41 metrics.
Collected from Performance Insights rather than CloudWatch, and filtered
per instance against the metrics that instance actually publishes. The
db.* series follow PostgreSQL vocabulary and vary by engine; the os.*
series require Enhanced Monitoring to be enabled on the instance. The
aggregate is part of the metric name: .avg is the average over the
interval and .max its peak.
| Metric | Unit | Tier |
|---|---|---|
db.Transactions.xact_commit.avg | Count/Second | Core |
db.Transactions.xact_rollback.avg | Count/Second | Core |
db.Transactions.active_transactions.avg | Count | Core |
db.Transactions.blocked_transactions.avg | Count | Core |
db.Transactions.max_used_xact_ids.max | Count | Core |
db.SQL.tup_inserted.avg | Count/Second | Core |
db.SQL.tup_updated.avg | Count/Second | Core |
db.SQL.tup_deleted.avg | Count/Second | Core |
db.SQL.tup_returned.avg | Count/Second | Core |
db.SQL.tup_fetched.avg | Count/Second | Core |
db.state.active_count.avg | Count | Core |
db.state.idle_count.avg | Count | Core |
db.state.idle_in_transaction_count.avg | Count | Core |
db.state.idle_in_transaction_aborted_count.avg | Count | Core |
db.state.idle_in_transaction_max_time.max | Milliseconds | Core |
db.IO.blks_read.avg | Count/Second | Core |
db.Cache.blks_hit.avg | Count/Second | Core |
db.Concurrency.deadlocks.avg | Count/Second | Core |
db.User.numbackends.avg | Count | Core |
os.cpuUtilization.total.avg | Percent | Core |
os.cpuUtilization.user.avg | Percent | Core |
os.cpuUtilization.system.avg | Percent | Core |
os.cpuUtilization.wait.avg | Percent | Core |
os.cpuUtilization.idle.avg | Percent | Core |
os.cpuUtilization.steal.avg | Percent | Core |
os.cpuUtilization.irq.avg | Percent | Core |
os.cpuUtilization.nice.avg | Percent | Core |
os.memory.free.avg | Kilobytes | Core |
os.memory.active.avg | Kilobytes | Core |
os.memory.cached.avg | Kilobytes | Core |
os.memory.buffers.avg | Kilobytes | Core |
os.network.rx.avg | Bytes/Second | Core |
os.network.tx.avg | Bytes/Second | Core |
os.loadAverageMinute.one.avg | Count | Core |
os.loadAverageMinute.five.avg | Count | Core |
os.loadAverageMinute.fifteen.avg | Count | Core |
os.tasks.running.avg | Count | Core |
os.tasks.blocked.avg | Count | Core |
os.tasks.total.avg | Count | Core |
os.swap.free.avg | Kilobytes | Core |
os.swap.cached.avg | Kilobytes | Core |