Viewing a Dashboard
When you open a dashboard, you see all its panels arranged in a grid layout with a toolbar at the top for time range selection, variables, and dashboard actions.
Dashboard Toolbar
The toolbar at the top of the dashboard provides:
| Control | Description |
|---|---|
| Time Range Picker | Select the time window for all panels (e.g., Last 15 minutes, Last 1 hour, or a custom range) |
| Refresh | Manually refresh all panels with the latest data |
| Variables | Dropdowns and text inputs for any variables defined on the dashboard — changing a value updates all panels that reference it |
| Add Variable | Create a new dashboard variable |
| Add Panel | Open the Data Explorer to build and add a new panel |
| Save Changes | Persist any modifications to the dashboard layout, variables, or panels |
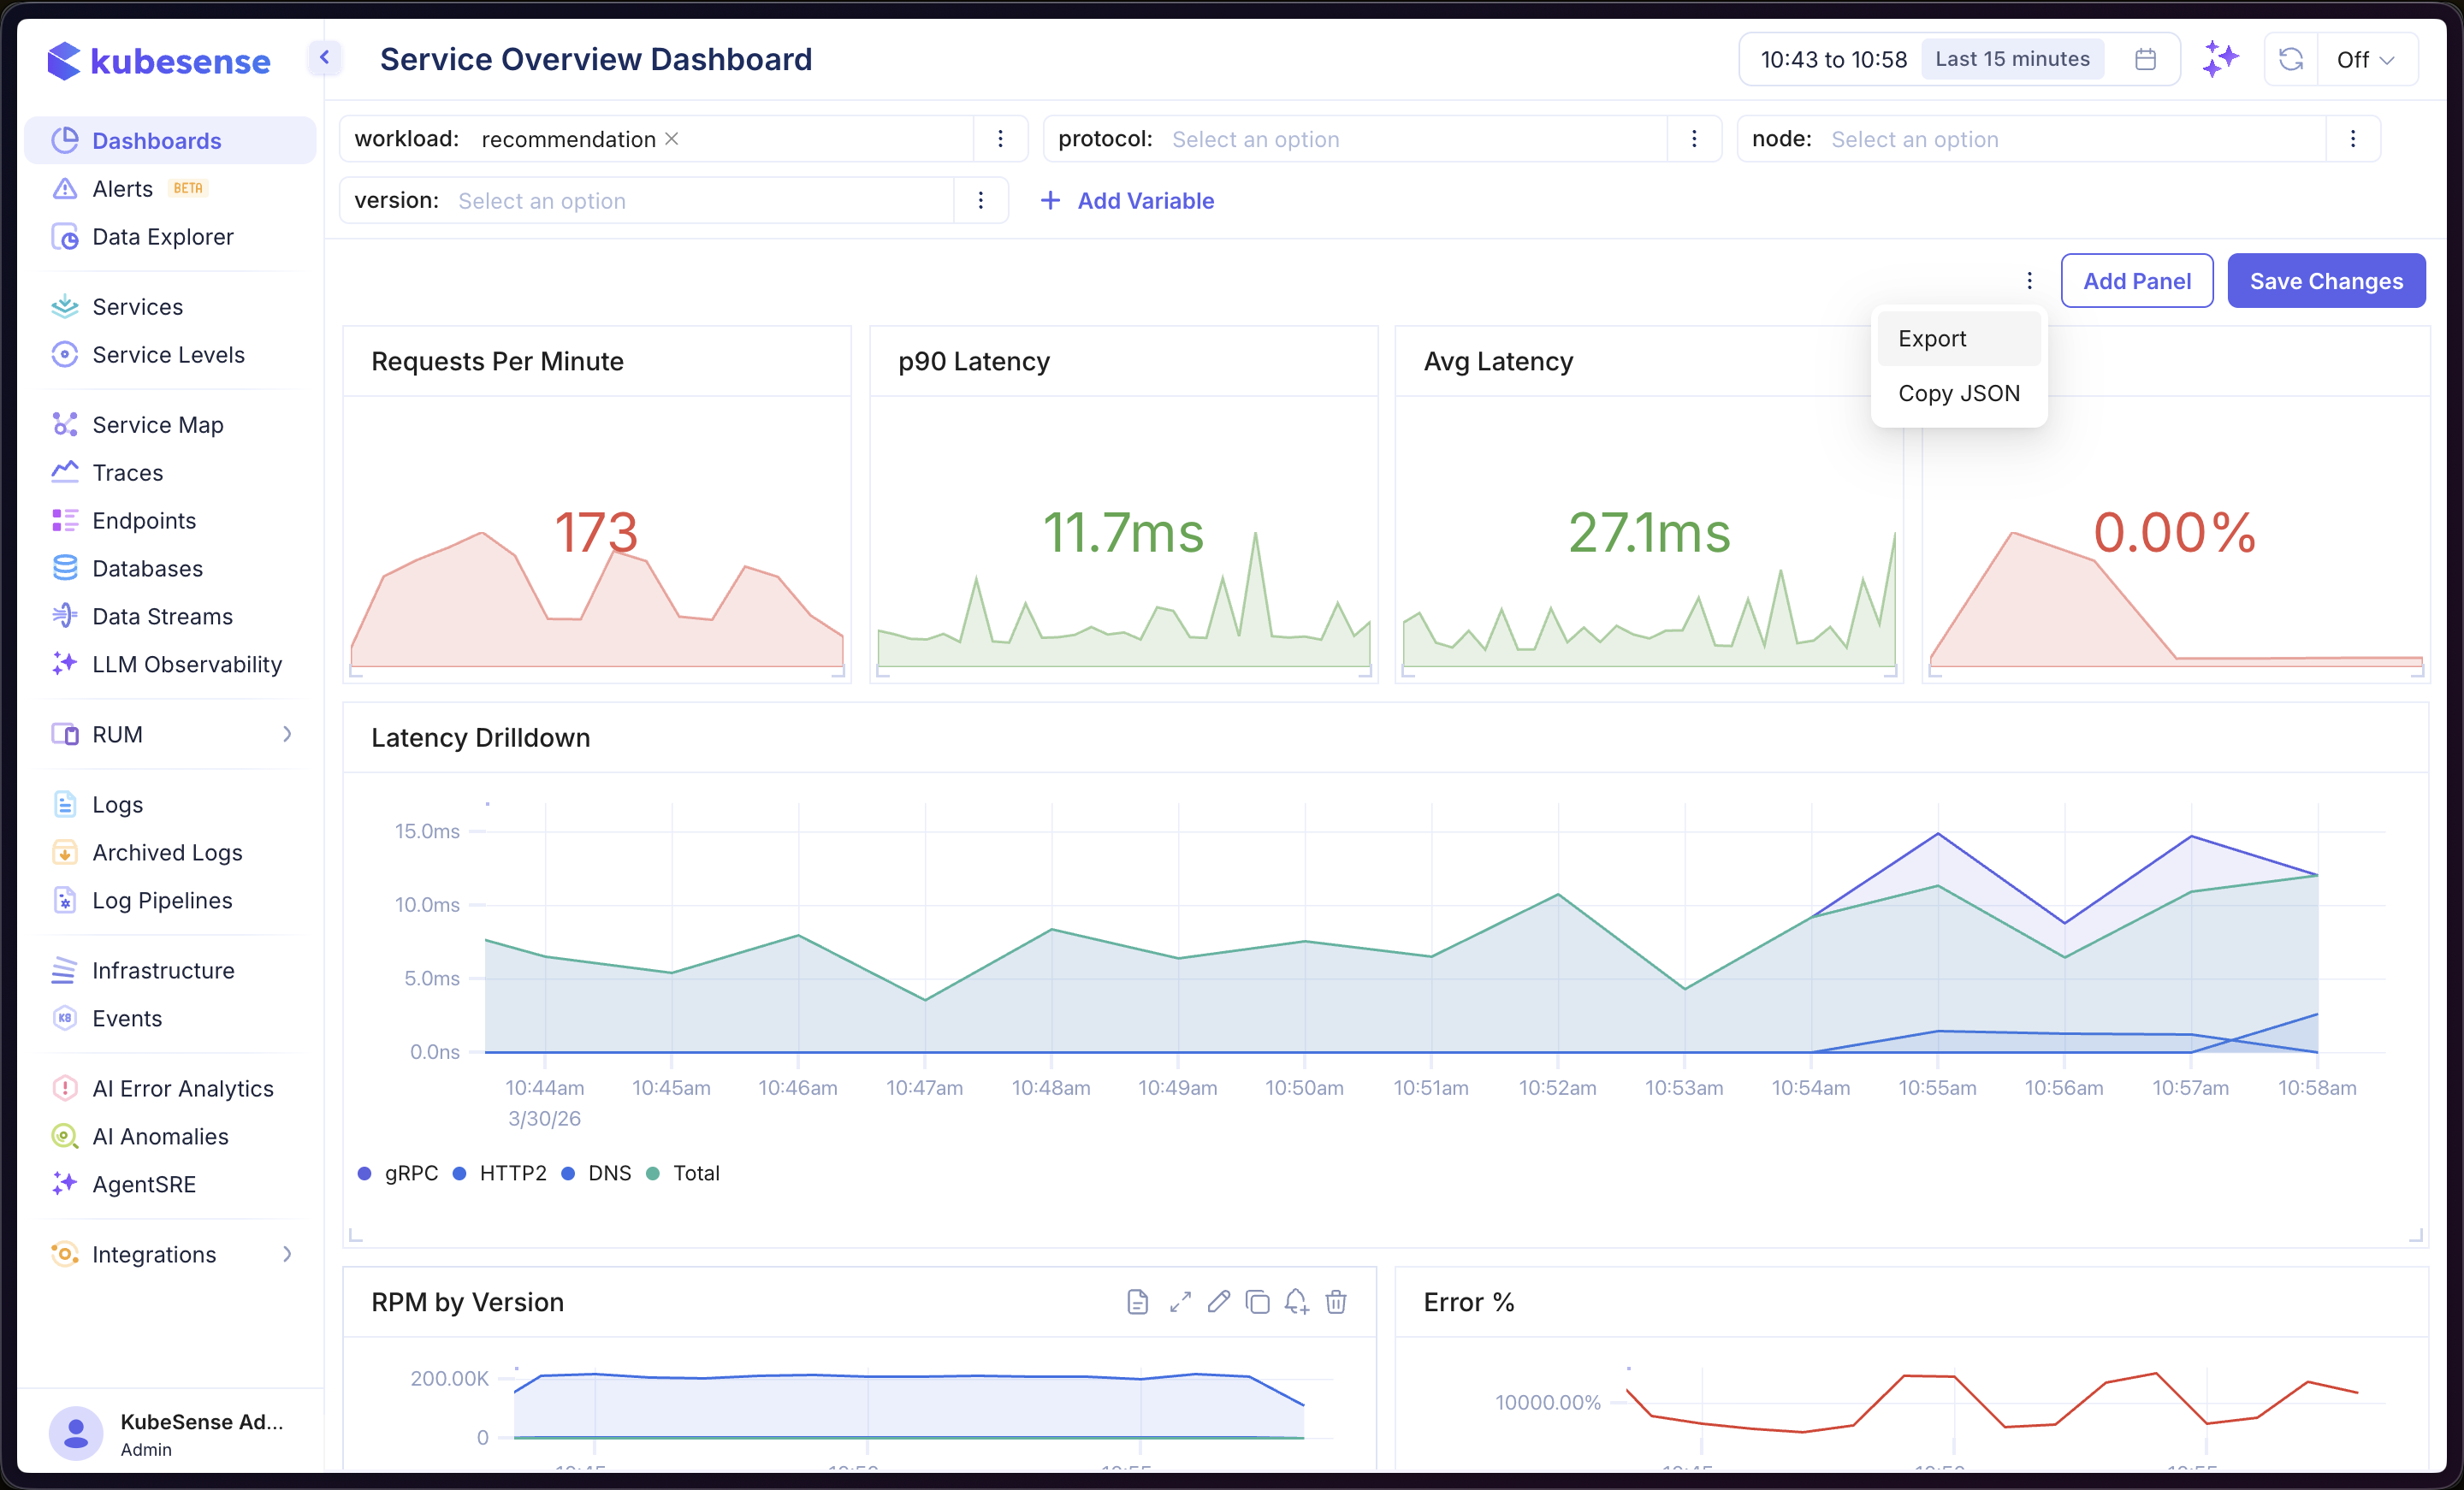
Extra Options Menu
Click the overflow menu in the toolbar to access additional actions:
| Action | Description |
|---|---|
| Export | Download the dashboard as a JSON file for backup or sharing |
| Copy JSON | Copy the dashboard JSON definition to your clipboard |
Grid Layout
Panels are arranged in a 12-column responsive grid. You can customize the layout by dragging and resizing panels.
- Drag — Click and hold a panel header to drag it to a new position in the grid
- Resize — Use the handle in the bottom-right corner of a panel to resize it
- The layout automatically adapts to different screen sizes
- Minimum panel height is 2 rows
- Click Save Changes to persist layout modifications
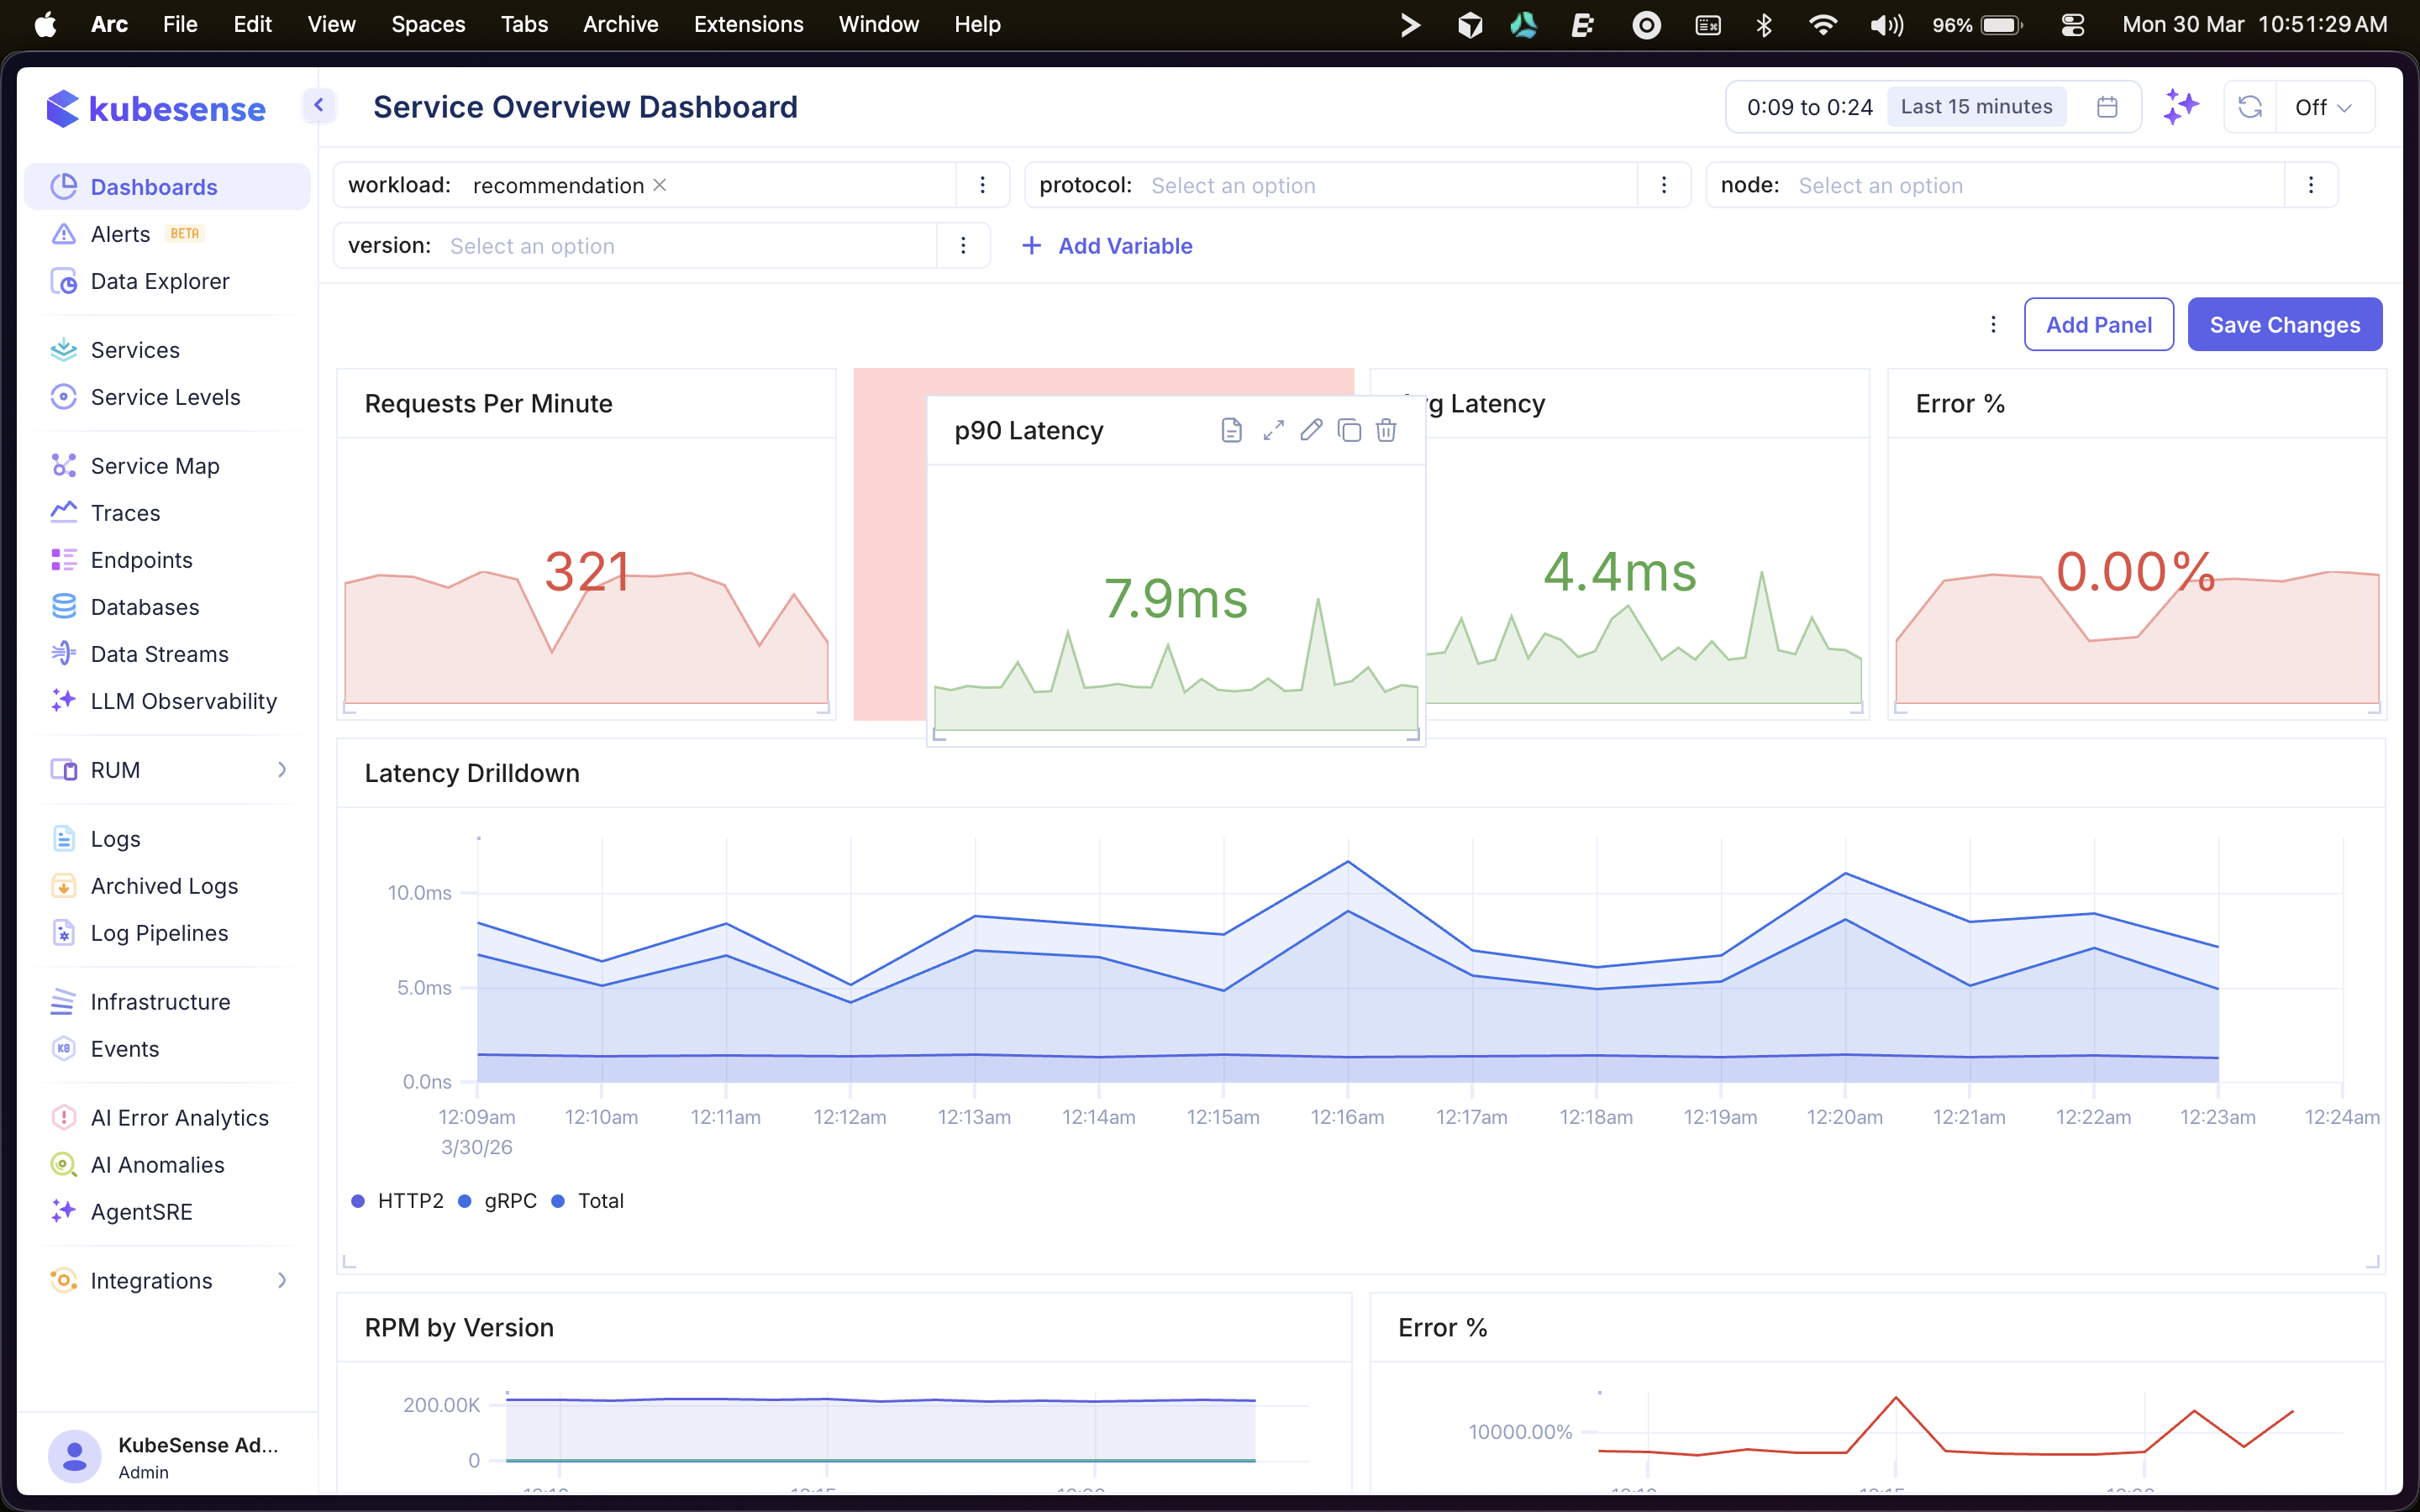
Panel Actions
Hover over a panel to reveal its action icons in the top-right corner:
| Action | Description |
|---|---|
| View Info | See the panel name, description, and query details |
| Expand | Open the panel in a full-screen modal for closer inspection |
| Edit | Open the panel in the Data Explorer editor to modify its query or visualization |
| Duplicate | Create a copy of the panel, automatically positioned in the grid |
| Create Alert | Create an alert rule based on this panel's query (available for time-series panels only) |
| Delete | Remove the panel from the dashboard |
Panel Types
Each panel on the dashboard uses one of the available visualization types: