
Metrics Query Builder
A Metrics query charts one metric, narrowed by label filters and shaped by a chain of functions. The builder writes the PromQL for you and shows it under the query as you work, so you can build anything you would type by hand without leaving the builder.
Building a Query
- Open the Data Explorer and set the query's data source to Metrics
- Pick a metric from the metric selector
- Narrow it with label filters (see Filters)
- Click Add Function to shape the result (see Functions)
- Click Run
The PromQL preview under the functions updates on every change. It is the exact query the panel runs.
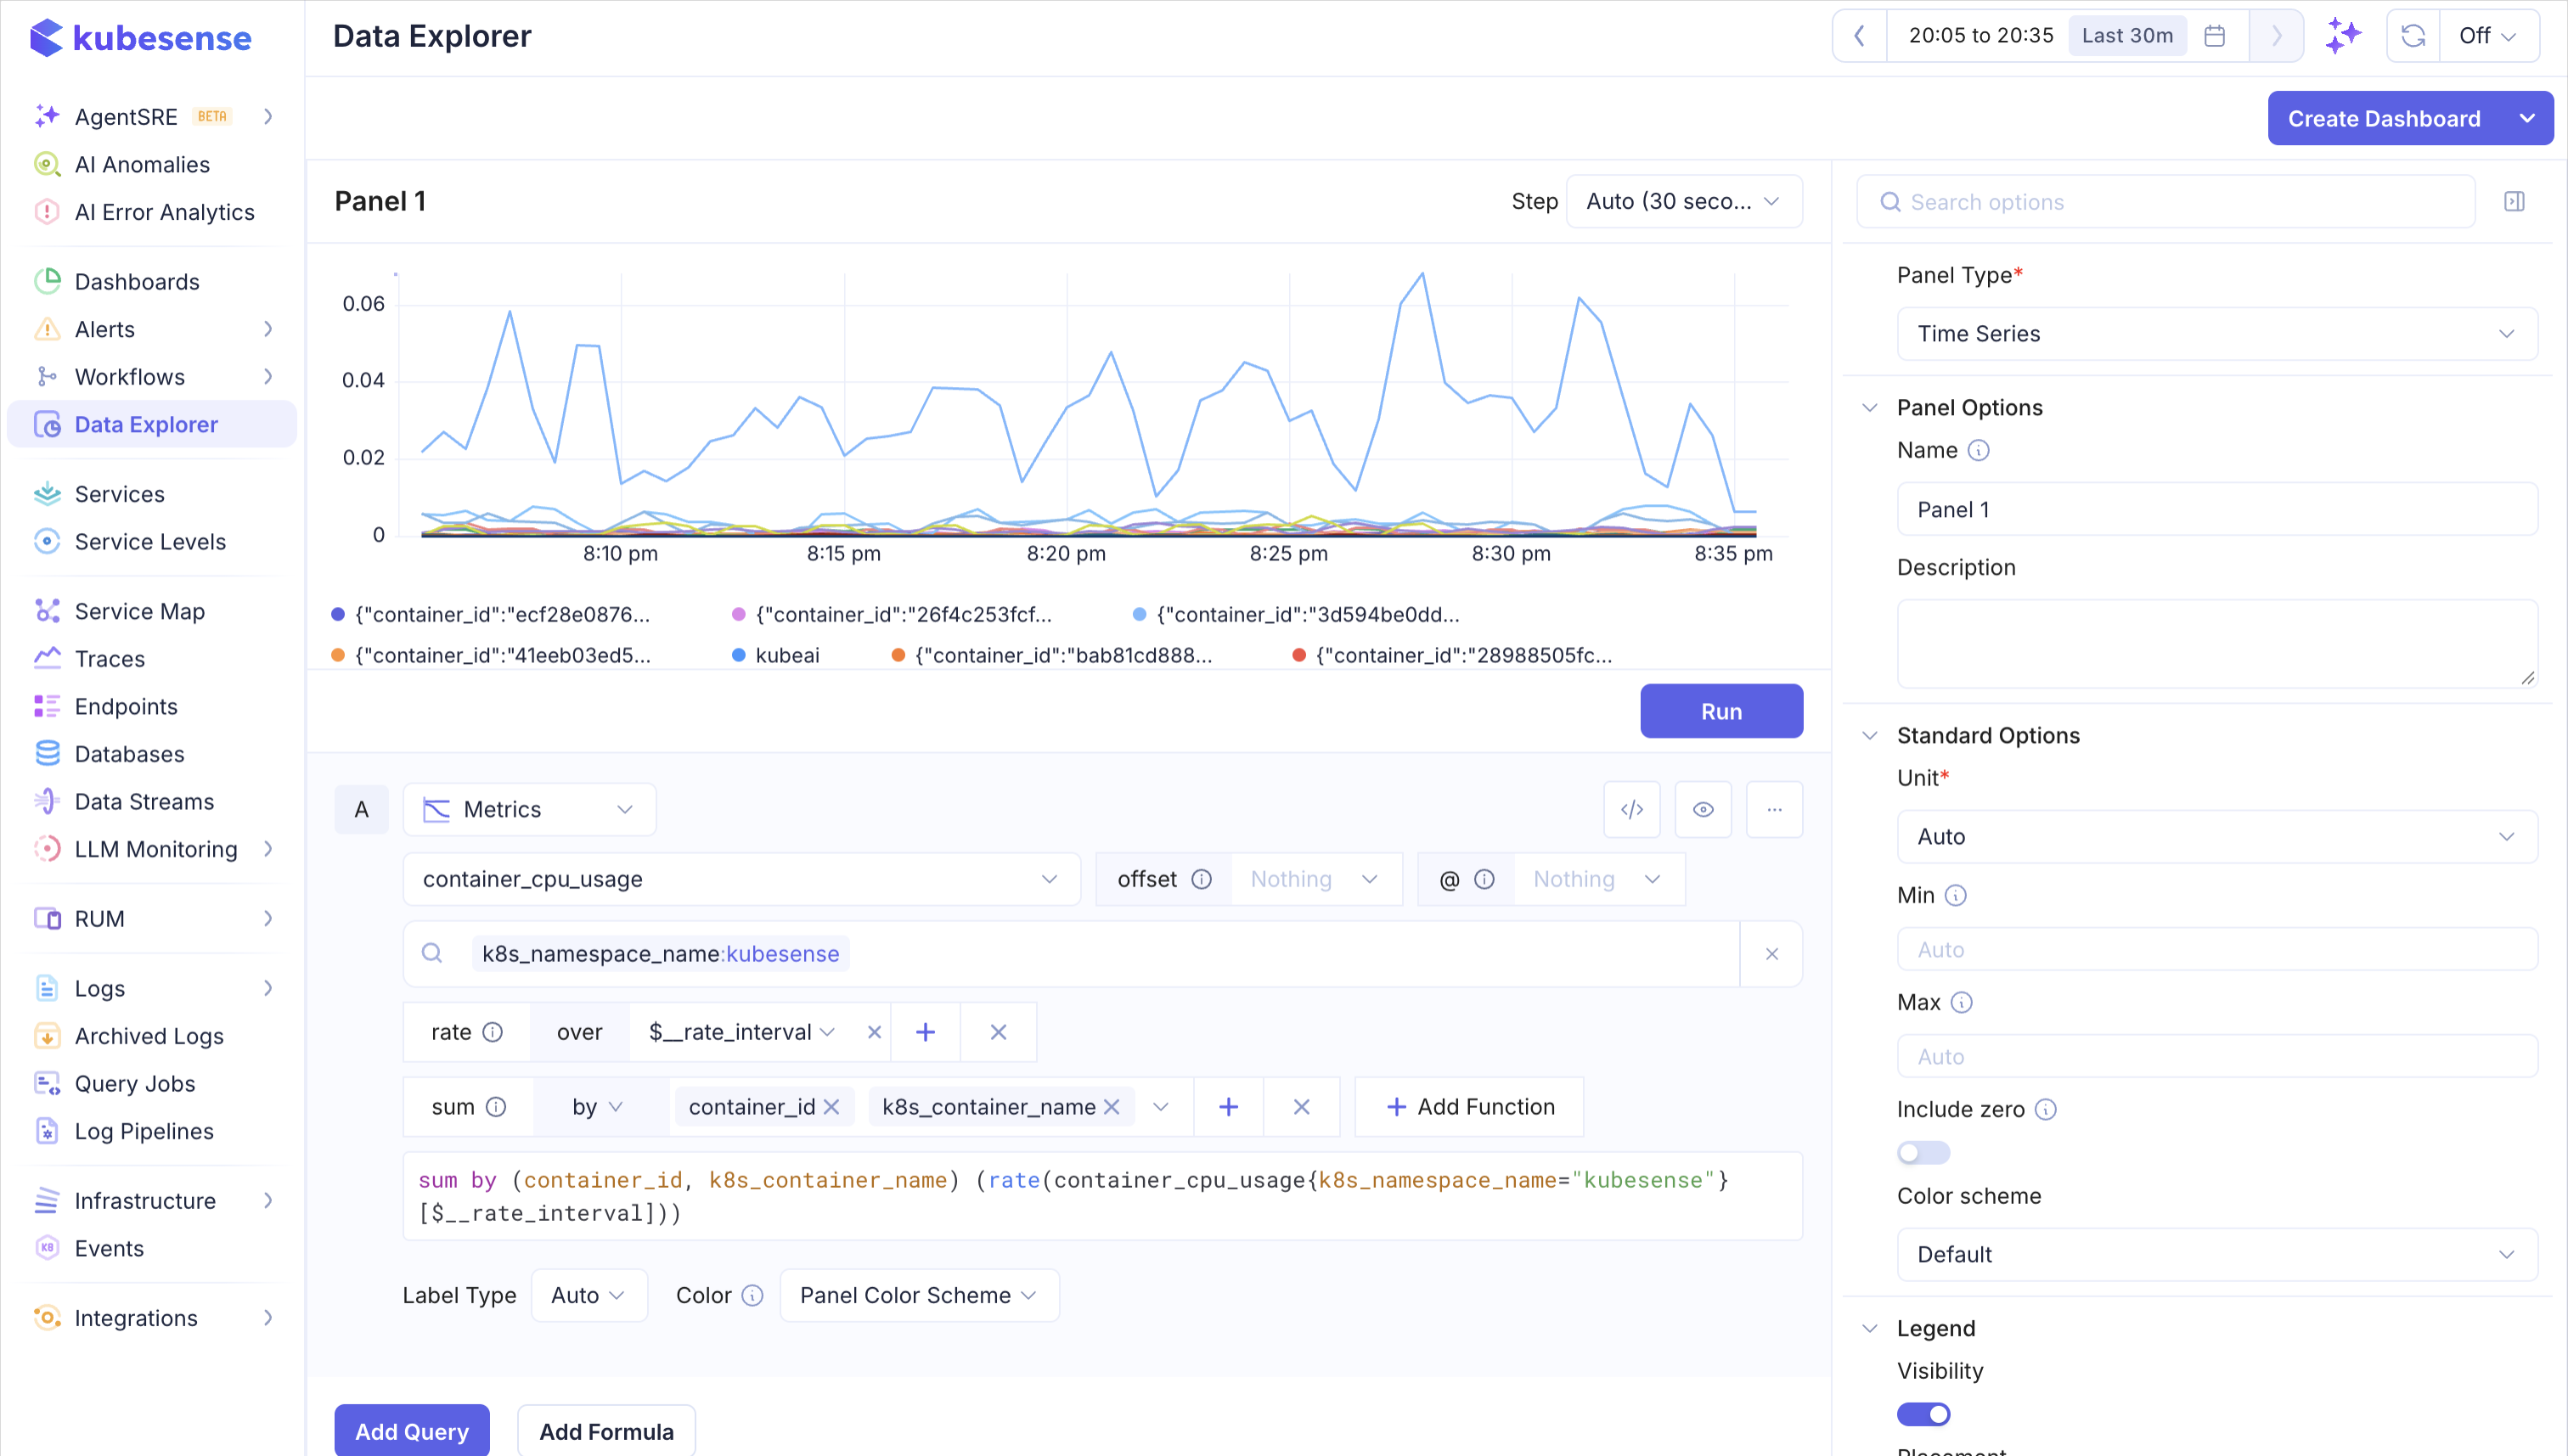
In the example above, container_cpu_usage is filtered to the kubesense namespace, rate turns it into a per-second rate, and sum by (container_id, k8s_container_name) adds it up per container. The preview shows the PromQL those three steps produce.
Filters
Type filters into the search bar under the metric, as label:value. Several values for one label match any of them, and several excluded values exclude all of them.
| Type in the bar | Matches series where | PromQL |
|---|---|---|
pod:api | pod is exactly api | pod="api" |
-pod:api | pod is anything but api | pod!="api" |
pod:~api-.* | pod matches the regular expression | pod=~"api-.*" |
-pod:~api-.* | pod does not match the regular expression | pod!~"api-.*" |
Dashboard variables work in filter values, for example namespace:$namespace or pod:~$service-.*. When a variable has nothing selected, a filter that excludes it is left out rather than excluding everything.
note: A value that itself starts with - or ~ is read as an operator. To match such a value literally, switch to code mode and write the matcher yourself.
Functions
Functions apply in order, left to right: each one takes the result of the one before it. For example, rate then sum by (namespace) gives the per-second rate of each series, summed per namespace.
Adding a Function
Click Add Function and either browse or search:
- Browse by category, then pick a function
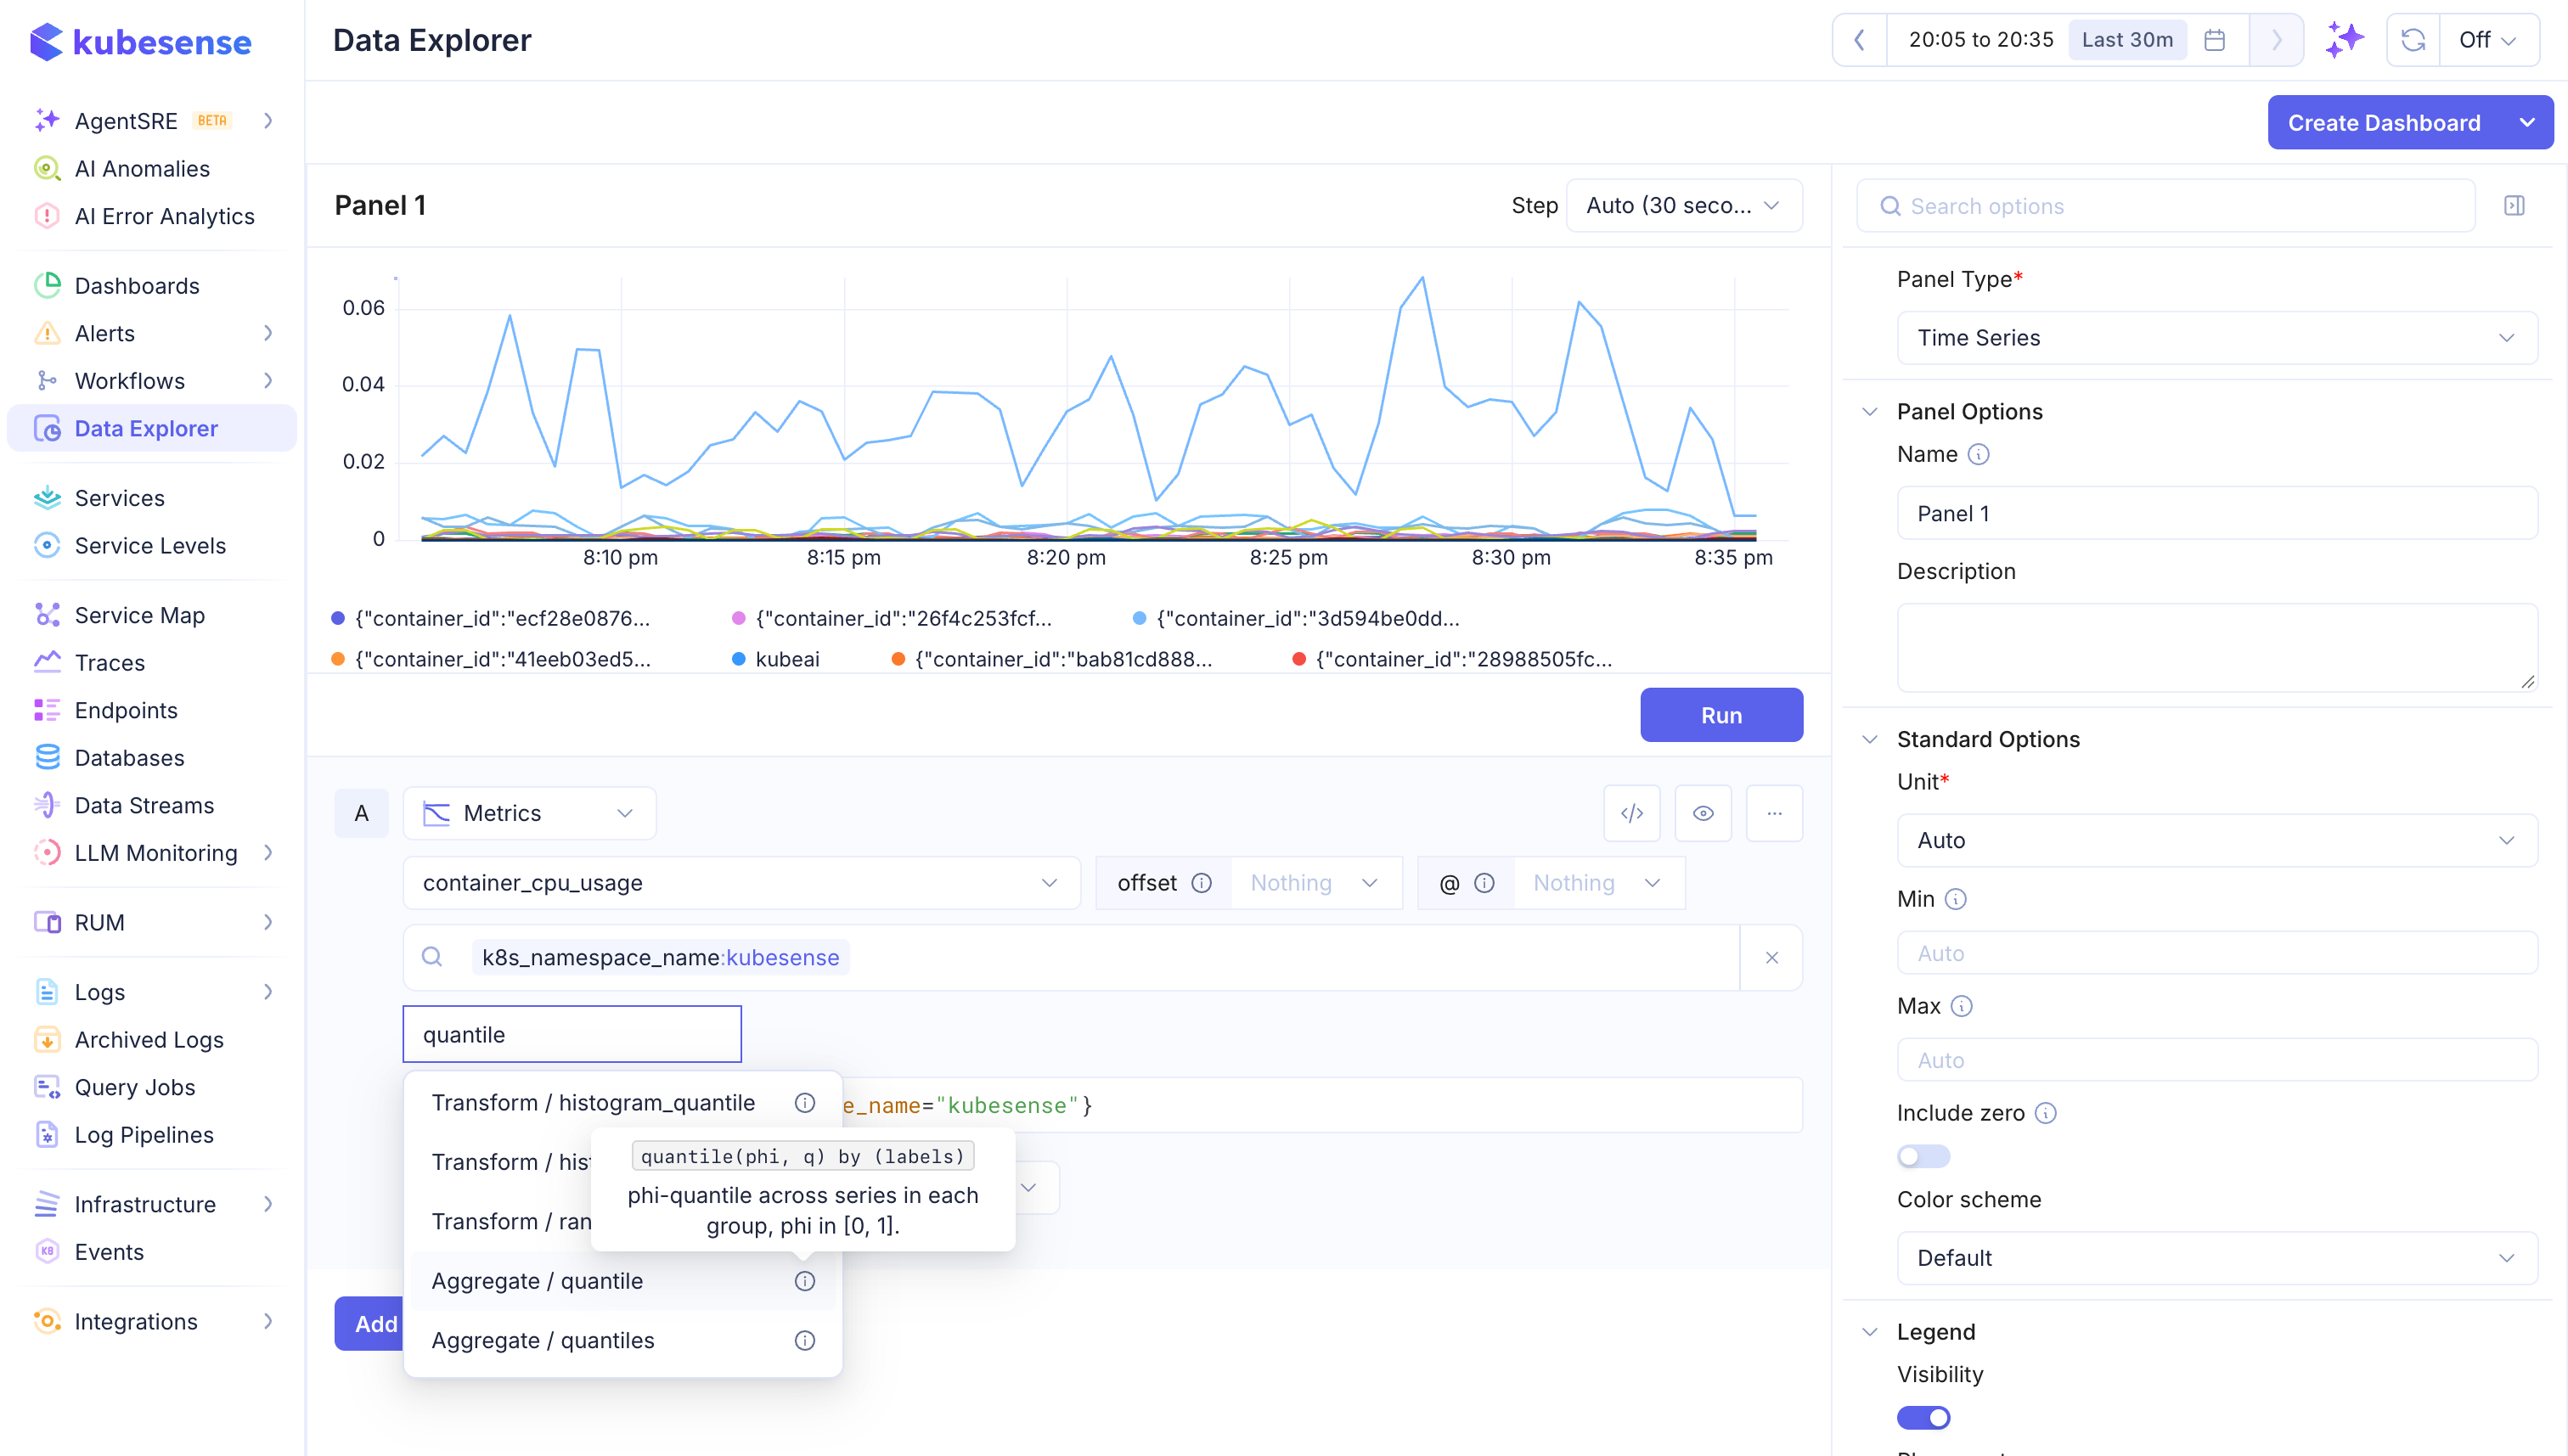
- Type part of a name to search the whole catalog at once, for example
quantilelistsquantile_over_time,histogram_quantileand the rest
Hover the ⓘ icon beside any function, in the menu or on a block, to see its signature and what it does.
| Category | What it does | Examples |
|---|---|---|
| Rollup | Computes one value per point from a window of past samples | rate, increase, avg_over_time, quantile_over_time |
| Transform | Changes each value on its own | abs, clamp, histogram_quantile, round |
| Label | Adds, removes, renames or sorts by labels | label_replace, label_keep, sort_by_label |
| Aggregate | Combines series into fewer series | sum, avg, topk, quantile, count_values |
| Operator | Arithmetic and comparisons against a number | +, *, >, default |
Changing a Function
Click a function's name on its block to swap it for another. The same search opens in place, and the arguments the two functions share, such as the window, carry over.
Arguments
Each block shows its function's arguments as fields. The common ones:
| Argument | Found on | Notes |
|---|---|---|
| over | Rollups | The lookbehind window, such as 5m or $__rate_interval. Remove it to let the query engine pick one |
| step | Rollups | Evaluates the rollup at this step instead of the panel's, like a PromQL subquery [5m:1m] |
| by / without | Aggregates | The labels to keep, or to drop, when combining series |
| limit | Aggregates | Caps how many series the aggregate returns |
| keep_metric_names | Rollups, transforms, operators | Keeps the metric name, which these functions drop by default |
| bool | Comparisons | Returns 1 or 0 for every point instead of filtering |
| quantile / phi | quantile_over_time, quantile, … | A value from 0 to 1. 0.95 is the 95th percentile |
Optional arguments are hidden until you add them with the + on the block, and each has its own × to remove it. The × at the end of the block removes the function.
Required Labels
Some label functions do nothing useful without labels, so the builder asks for them:
| Function | Needs |
|---|---|
labels_equal | At least 2 labels |
label_keep, label_lowercase, label_uppercase | At least 1 label |
sort_by_label, sort_by_label_desc, sort_by_label_numeric, sort_by_label_numeric_desc | At least 1 label |
Until you fill them in, the block is outlined in red with Add at least N labels, and Run and saving the panel are refused. A dashboard imported from JSON with one of these functions missing its labels is rejected the same way.
Offset and @
Next to the metric are two optional modifiers for the series selector. Hover their ⓘ icons for a reminder in the product.
| Modifier | What it does | Example |
|---|---|---|
| offset | Shifts the data back in time. Each point shows the value from that long before it, so the line keeps its shape, just later | offset 1d compares with the same time yesterday |
| @ | Reads every point at one fixed time: start() or end() of the time range, or a Unix timestamp | topk(5, x @ end()) picks the top 5 at the end of the range and keeps them fixed |
info: On its own, @ draws a flat line: every point reads the same moment. It is useful combined with something that still changes over time, such as comparing against a baseline or choosing series at one moment.
Click the × on either modifier to clear it.
Code Mode
Click the Write PromQL icon in the query header to switch to code mode. The editor opens with the query the builder produced, and you can edit it freely, including variables such as $namespace and $__rate_interval.
Click Build a query to return to the builder. The builder keeps its own settings, so edits made in code mode are not carried back into it.
Duplicating a Query
Open a query's ⋯ menu and click Duplicate to add an exact copy right below it, under the next free letter. Change the copy to compare two variants side by side, for example the same metric with and without an offset.
Duplicate is not offered on panel types that hold a single query, and is disabled once the panel has 10 queries.