
SLO
The SLO visualization puts your service level objectives on a dashboard. It does not run a query of its own: you pick which SLOs to show, and the panel reads the compliance and error budget that KubeSense has already calculated for each one.
When to Use
- Showing how every SLO is doing as five numbers a team can read from across the room
- Listing the SLOs for one team or one metric, with their compliance side by side
- Keeping one critical SLO, and the error budget it has left, next to the services it covers
An SLO panel reports what KubeSense has already evaluated for each objective. Use a Time Series panel when you want to chart the underlying metric over time.
Building an SLO Panel
- Open the Data Explorer
- Select SLO as the Panel Type in the right sidebar
- Pick a widget under Show — Summary, List or Single SLO
- Choose the SLOs it covers: set Filters for Summary and List, or pick one SLO for Single SLO
- Click Run to render the panel
There is no query builder, no formula and no Step control, because the SLO already defines its own query, target and window.
Time
An SLO panel does not follow the dashboard's time range. Each SLO is judged over its own evaluation window, such as 1 day, so changing the time picker does not change these numbers. For the same reason the panel has no Time Preferences setting.
Summary
Five tiles count the SLOs that match the panel's filters.
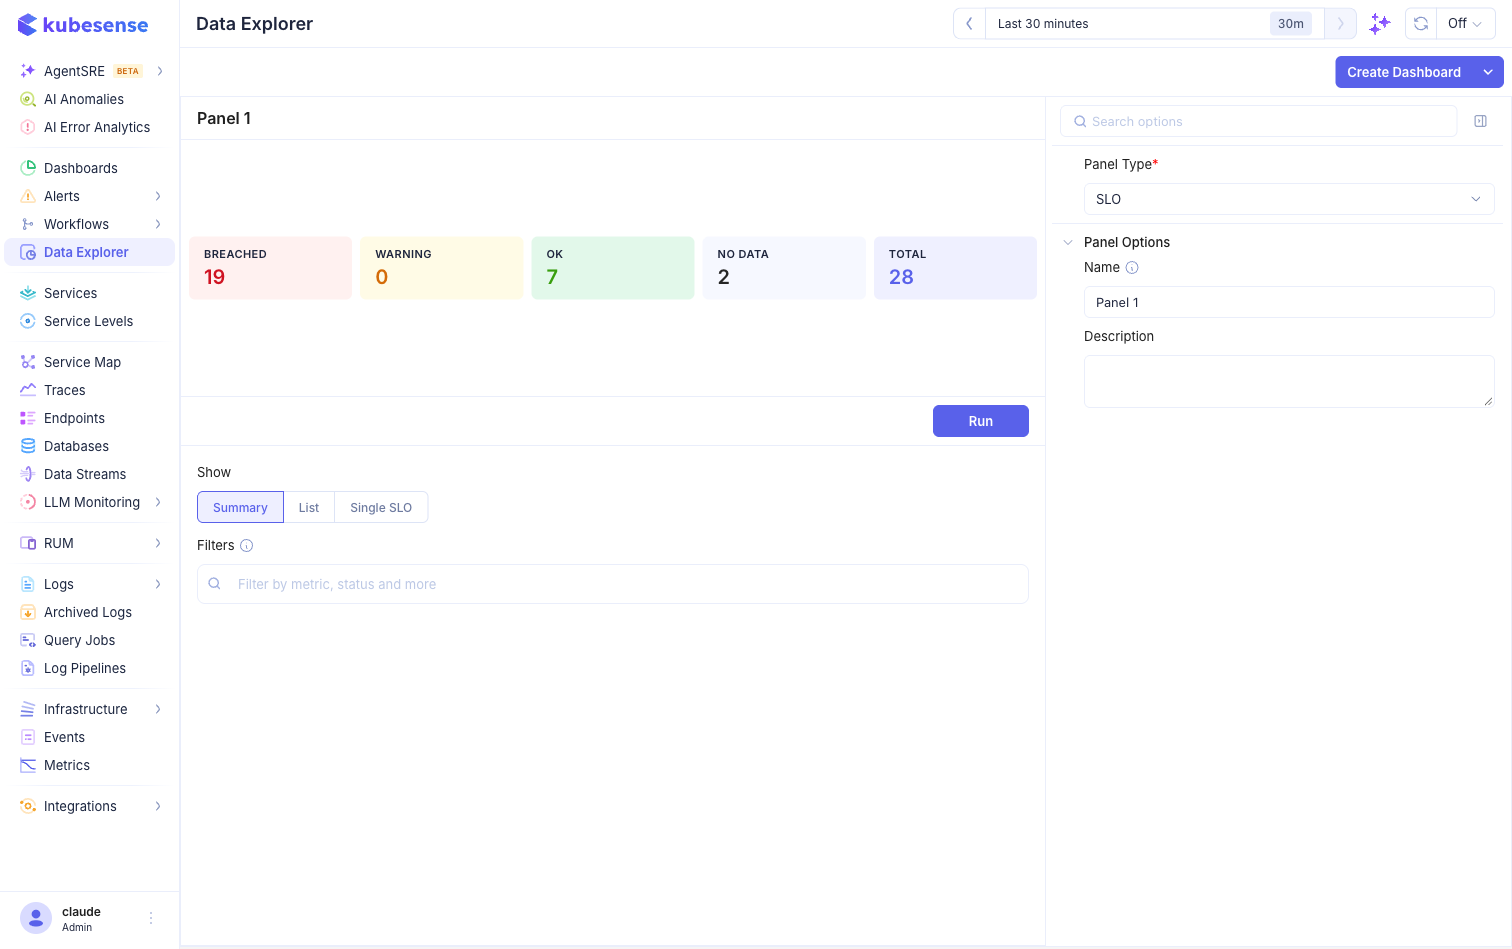
| Tile | Counts |
|---|---|
| Breached | SLOs below their target |
| Warning | SLOs that meet their target but sit below their warning target |
| OK | SLOs that meet their target and are clear of any warning |
| No data | SLOs with nothing evaluated yet, so there is nothing to compare |
| Total | Breached, Warning, OK and No data added together |
The tiles are a readout. On the SLO page they filter the table, but on a dashboard clicking one does nothing, so a click on one panel never changes what the rest of the dashboard shows.
Leave Filters empty to count every SLO. See Filters below.
List
One SLO per row, using the same columns as the SLO page.
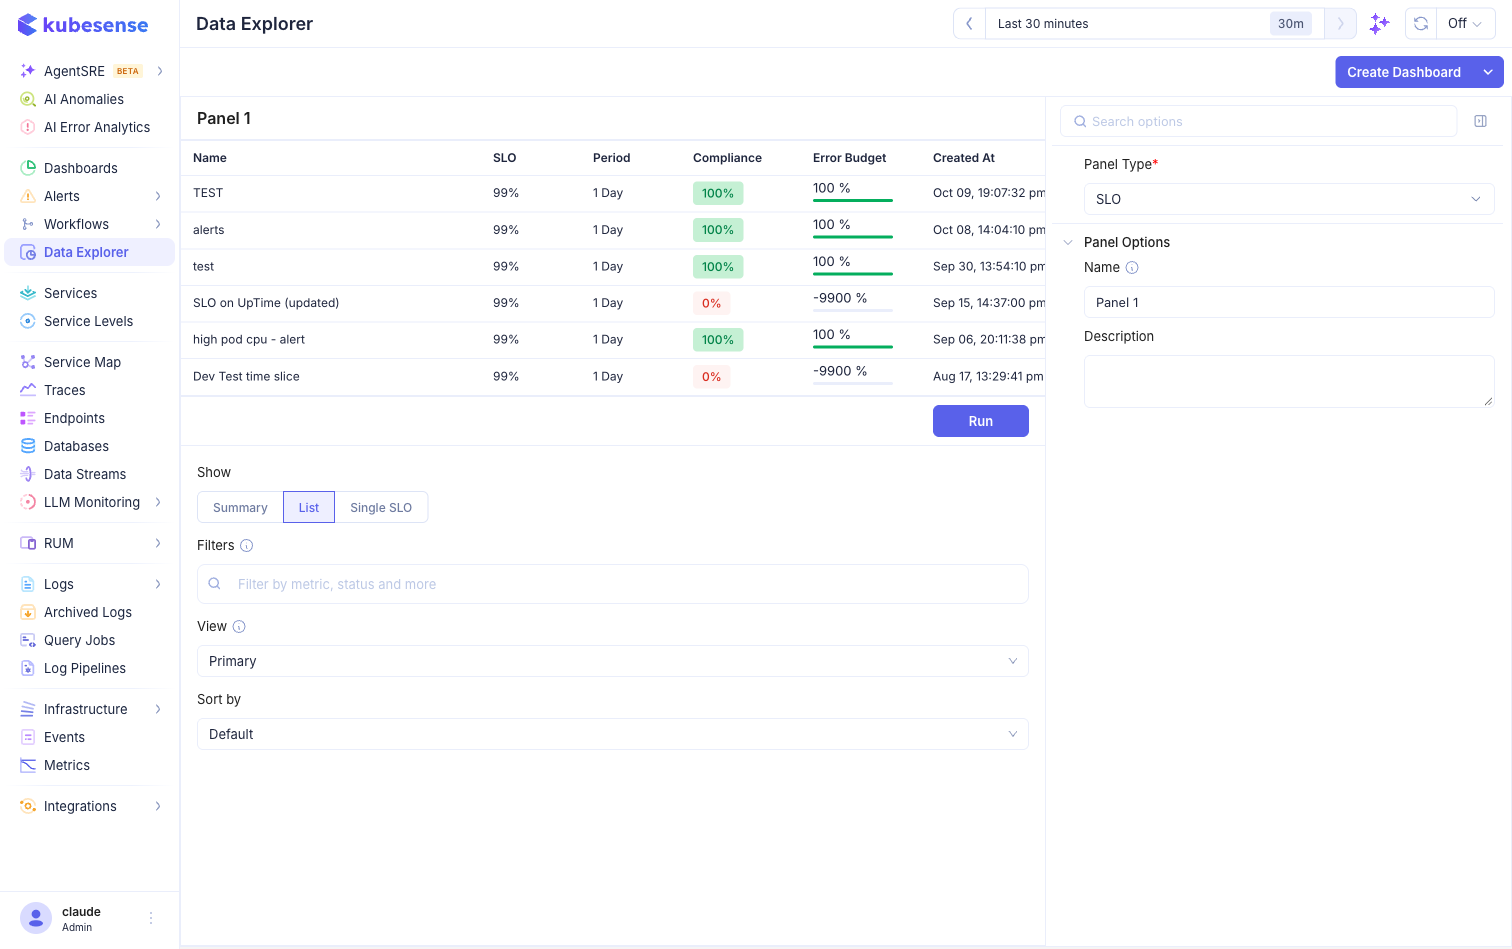
The Primary view shows:
| Column | Shows |
|---|---|
| Name | The SLO's name |
| SLO | Its target, such as 99% |
| Period | Its evaluation window, such as 1 Day |
| Compliance | The current compliance, coloured by how it compares with the target |
| Error Budget | How much of the budget is left, with a bar |
| Created At | When the SLO was created |
View
View switches the table between a snapshot and a history.
| View | Shows |
|---|---|
| Primary | One row per SLO with its current compliance and error budget |
| Daily | Compliance for each of the last four days, ending today |
| Weekly | Compliance for each of the last four weeks |
| Monthly | Compliance for each of the last four months |
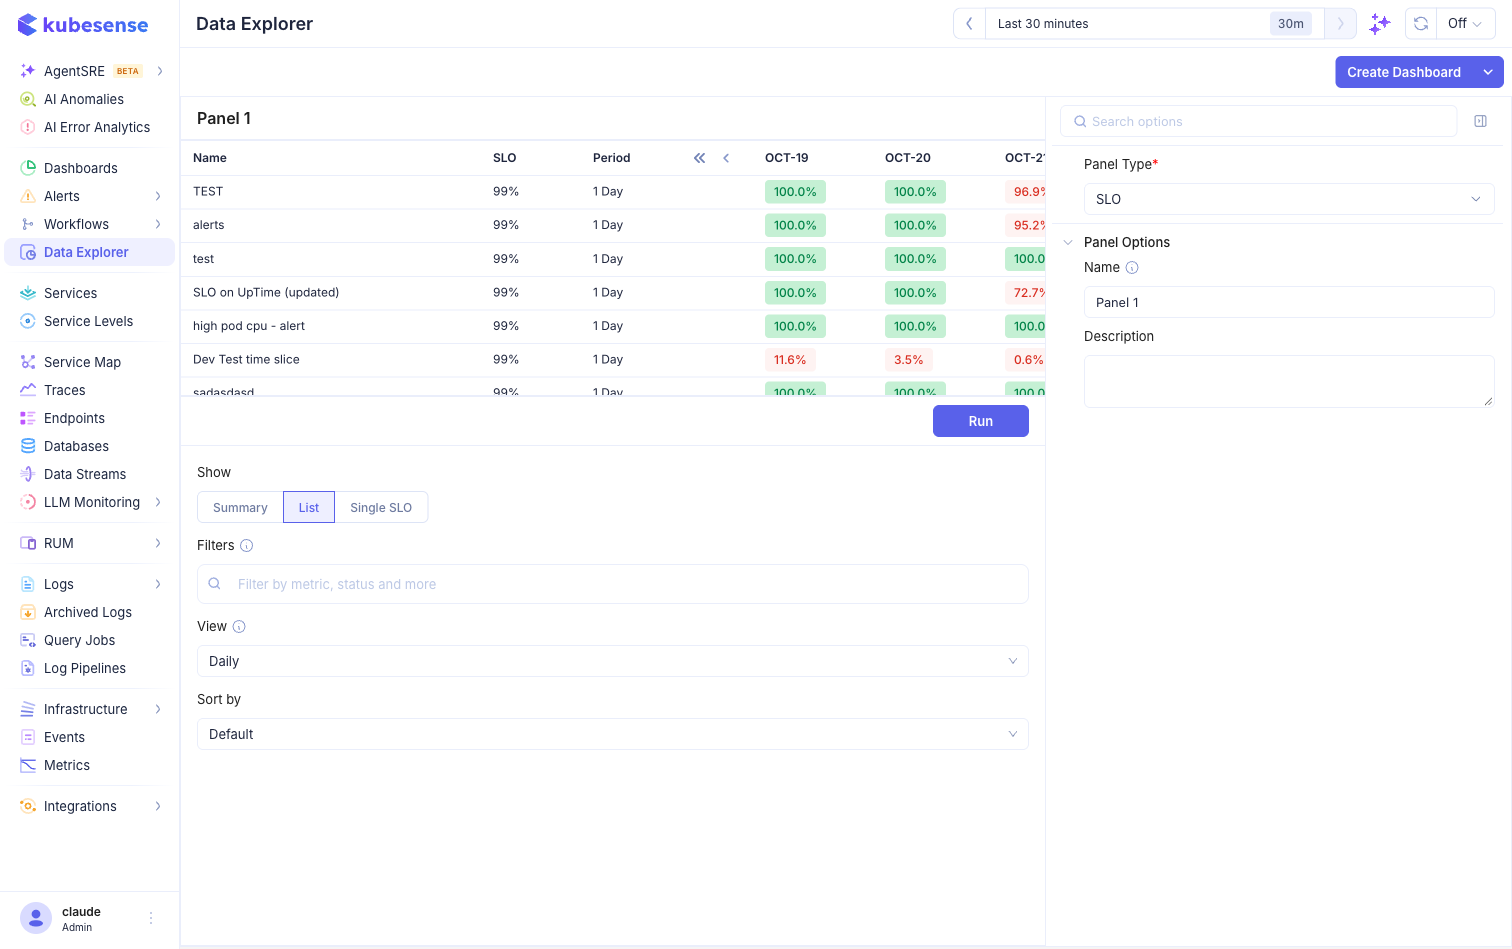
warning: Daily, Weekly and Monthly load a timeline for every visible row, so they are slower than Primary. On a dashboard with many panels, prefer Primary.
Sort by
Sort by orders the rows by Name or Created, and Order sets ascending or descending. Leave it on Default for no explicit sort.
The sort is part of the saved panel. Viewers cannot re-sort the table from the dashboard.
The table loads more rows as you scroll. Rows are not clickable and the panel has no edit or delete actions. To change an SLO, open it on the Service Levels page.
Single SLO
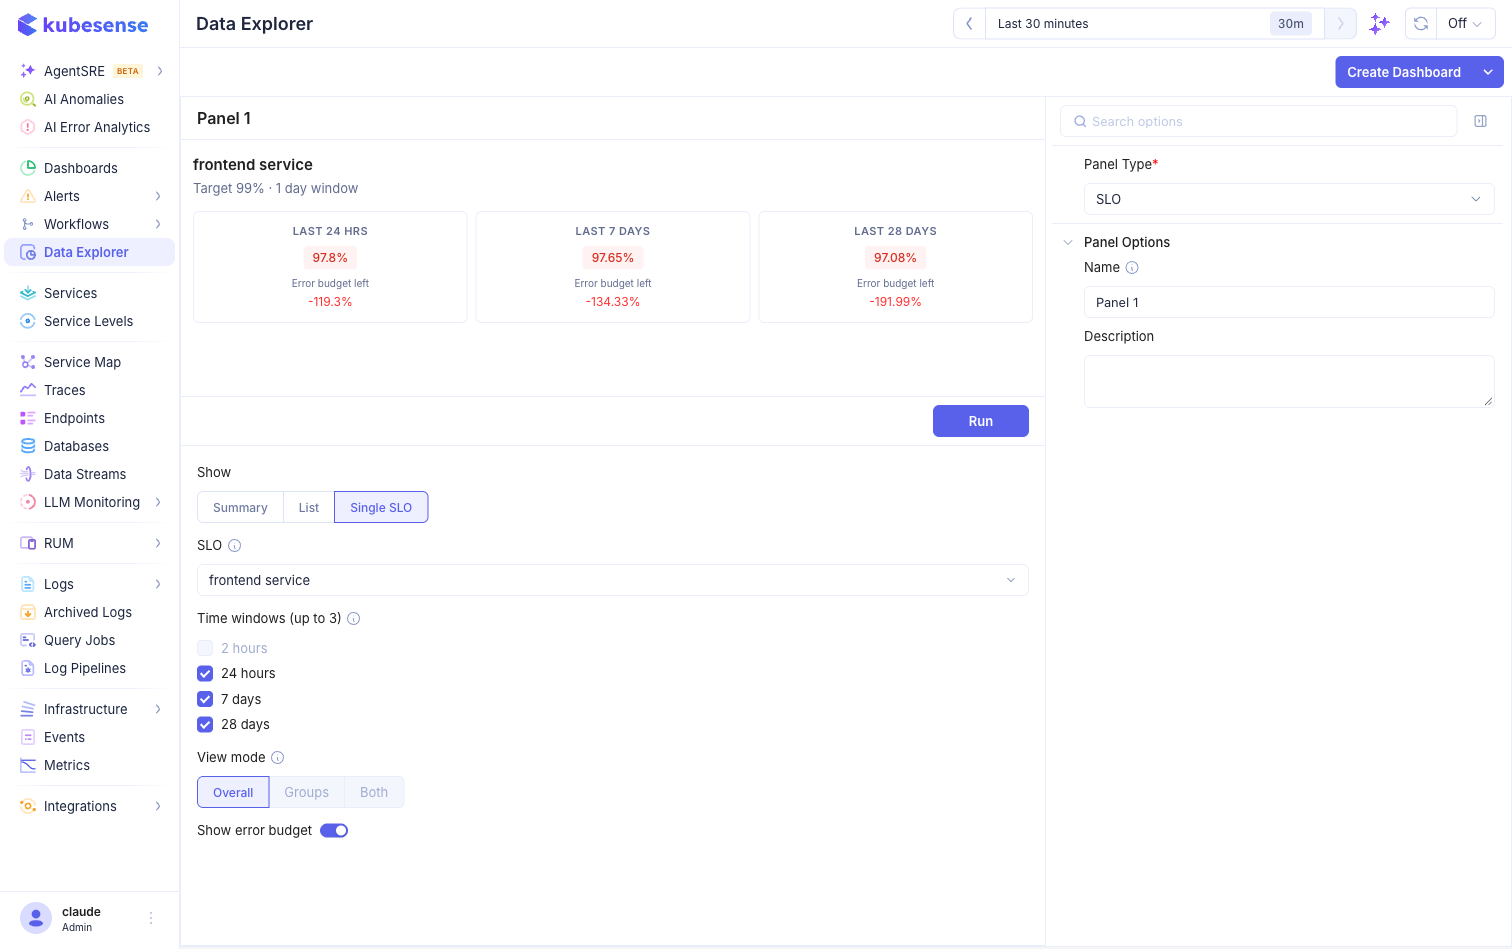
One objective, shown for the windows you choose.
The panel shows the SLO's name, then its target and evaluation window, for example Target 99% · 1 day window. Below that is one tile for each time window.
Each tile shows:
- Compliance for that window, coloured against the SLO's target and warning target
- Error budget left, if you keep Show error budget on
The error budget percentage is coloured by how much remains: green above 70%, amber from 30% to 70%, and red below 30%. A negative figure is normal and means the budget is spent. A 99% target that actually reached 97.8% has used up more than its whole 1% budget, so the panel shows a negative number rather than clamping it at zero. For SLOs that are not count-based, the remaining time is shown in brackets beside the percentage.
A dash (—) means nothing was evaluated for that window. It is not the same as 0%.
Fields
| Field | What it does |
|---|---|
| SLO | The objective to show. Type to search by name |
| Time windows | Up to three of 2 hours, 24 hours, 7 days and 28 days. The default is 24 hours, 7 days and 28 days |
| View mode | Overall, Groups or Both. See below |
| Show error budget | Adds the Error budget left line to each tile and group |
Only these four windows are offered, because KubeSense calculates them for every SLO ahead of time. 28 days is four whole weeks, not a calendar month, which keeps week-over-week comparisons even. Once you have picked three windows, the others are disabled until you clear one. Tiles always appear in the same order, whatever order you ticked them in.
Groups
An SLO can be grouped by one or more labels, for example by workload. View mode controls how a grouped SLO is shown:
- Overall shows the tiles for the SLO as a whole
- Groups shows a table with one row per group and one column per time window, each with the group's compliance and, below it, its error budget
- Both shows the tiles with the group table beneath
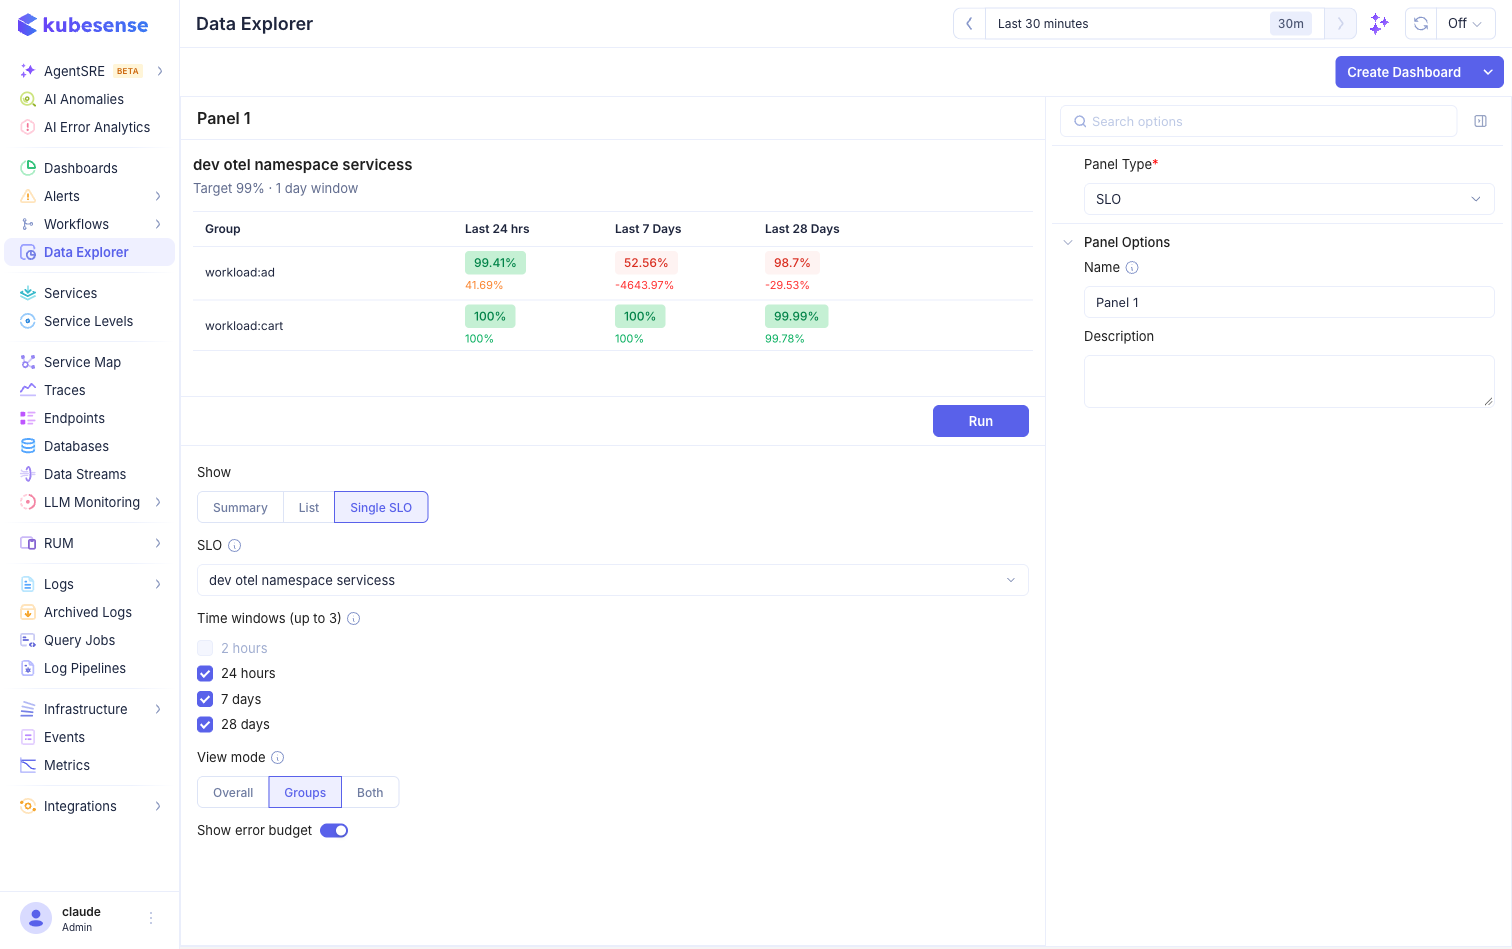
Groups and Both are disabled when the SLO has no groups. Hover over them to see why. If a saved panel is set to Groups and its SLO later loses its groups, the panel falls back to the overall tiles instead of going blank.
If the SLO is deleted, the panel says so by name, for example frontend service is no longer available. It uses the name saved with the panel.
Filters
Filters apply to Summary and List. They scope the panel the same way the SLO page does.
| Field | Filters by |
|---|---|
metric | The metric the SLO is measured on |
status | The SLO's current status |
burn_rate_status | Whether the error budget is burning too fast |
Type key:value to include a value, or -key:value to exclude it. Leave Filters empty to include every SLO you can see.
Filters belong to the panel. Setting them here does not change the filters on the SLO page or on any other SLO panel.
Limits
- A panel shows one widget. To see a summary and a list together, add two panels.
- Single SLO shows one objective. To compare several, use List.
- The time range is fixed by each SLO's own window. You cannot pin an SLO panel to a custom period.
- To create or edit an SLO, use the Service Levels page or the SLO API.