
RUM
RUM is a Data Explorer data source for your real user monitoring data. Use it to chart or tabulate sessions, views, actions, errors, resources, and long tasks from your browser and mobile applications, and to put them on a dashboard. You can query across applications in one chart.
RUM works with the chart, table, and List visualizations. It is not available for alerts, SQL, or SPL. You need the RUM permission on your role to use it. The RUM pages need it too, because the RUM list routes now check it.
Pick a RUM event type
Each query reads one RUM event type. To pick it, open the data source menu on the query row.
- Hover RUM. A second list opens with the six event types.
- Click an event type, such as Views.
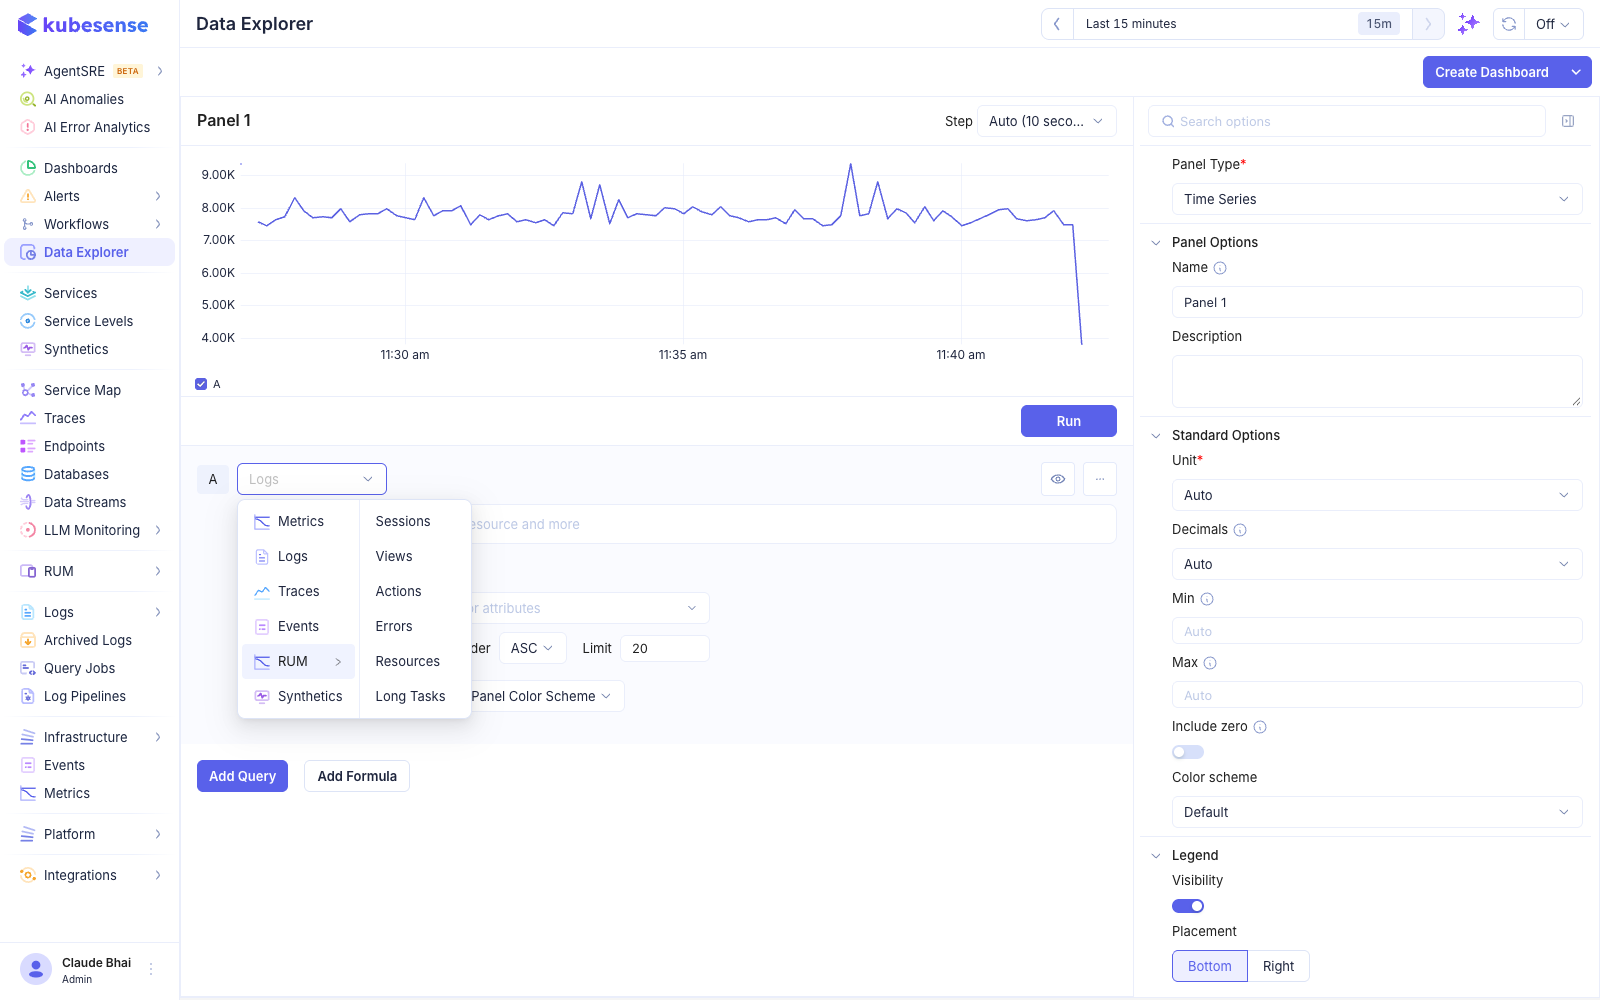
You can also type in the menu. Typing views finds RUM › Views.
If RUM is missing from the menu, your role does not have RUM access, or RUM is not enabled for your deployment. The menu also omits RUM on any panel that uses SQL or SPL. See Role Access to grant the RUM permission.
Event types
| Event type | One row is | Count it to answer |
|---|---|---|
| Sessions | A user session | How many sessions, and how many had errors |
| Views | A finished page or screen view | Page views, plus load metrics such as lcp |
| Actions | A click, tap, or scroll | Which actions are slow or frustrating |
| Errors | A captured error or crash | Which errors occur, and how many are crashes |
| Resources | An HTTP or asset request | Slow or failing requests, by host |
| Long Tasks | A main-thread long task | What blocks the UI |
Charts and tables count only ended views of non-system sessions. The List panel also lists views that are still open. Every row is placed in time by its own start time, so a long session counts in the window where it started.
Filter RUM data
The query row has a filter toggle with two modes, Basic and Advanced. They work as they do for Logs.
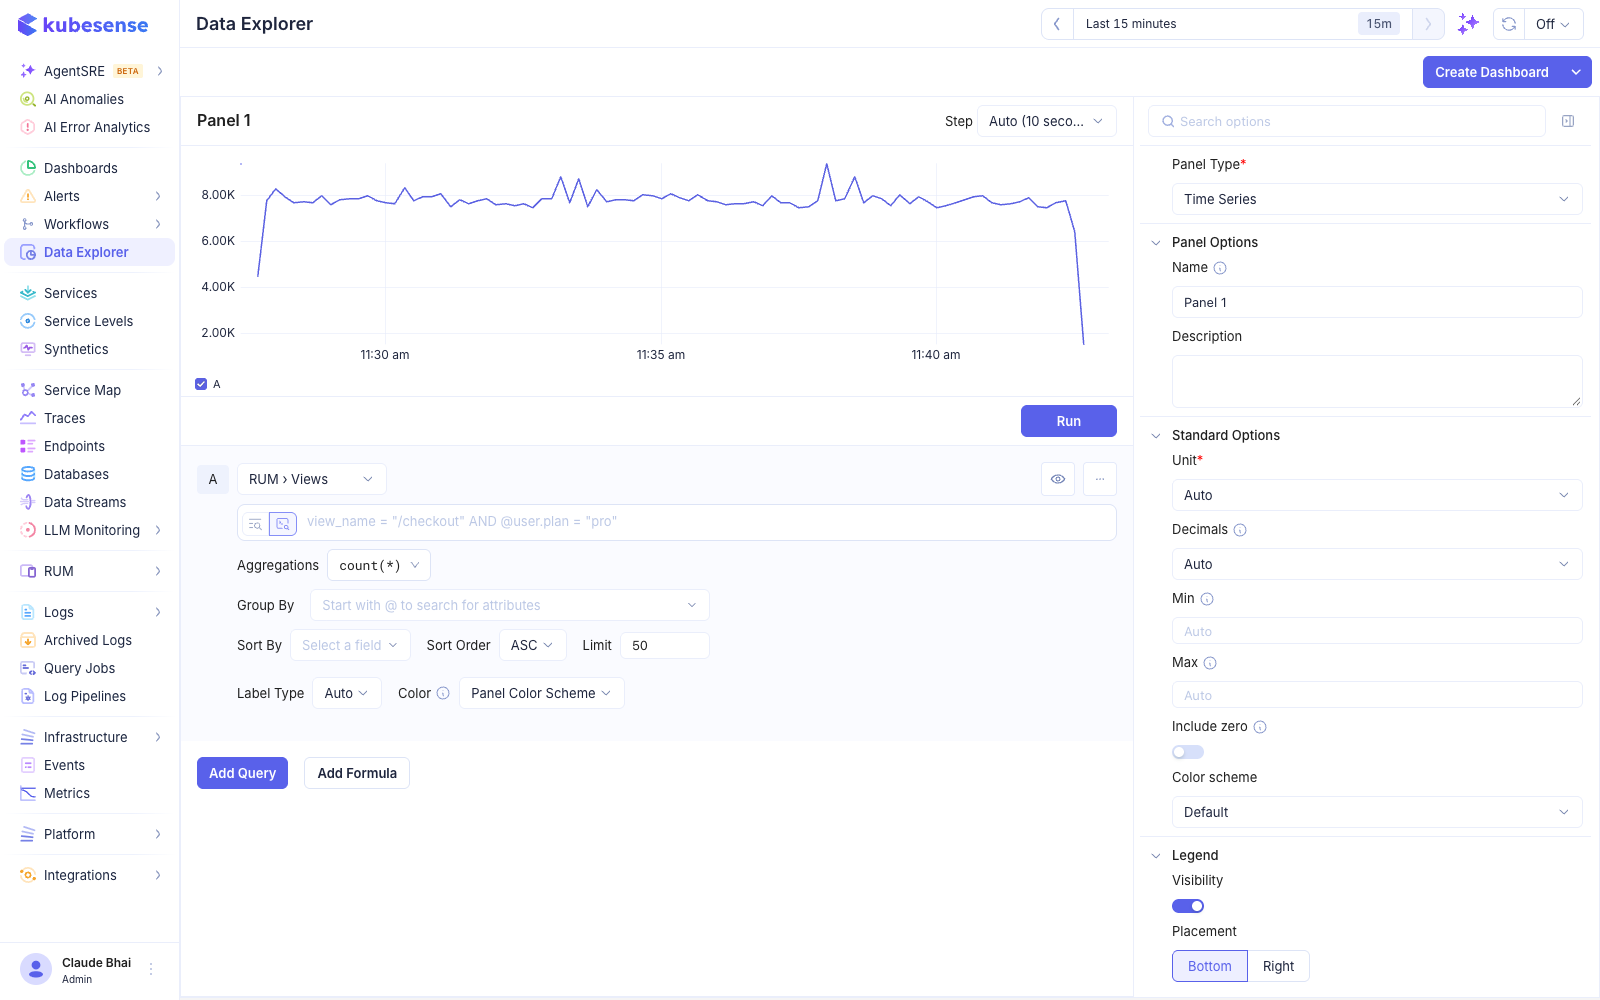
Basic offers filter chips built from the fields of the selected event type. Pick a field, an operator, and a value. Advanced takes a text expression. Field names are the ones in the RUM field catalog.
env = "production" AND browser_name = "Chrome"view_name = "/checkout" AND lcp_ms > 2500severity = "crash" AND country IN ("US", "DE")Type a custom attribute with an @ prefix, such as @user.plan = "pro". Type a feature flag as feature_flag.<key>, such as feature_flag.new_checkout = "true". Feature flag keys are case-sensitive and their values are text.
Application is a filter
RUM queries do not require an application. To scope a query to one application, filter on app_name or application_id. Without such a filter, the query covers all applications, so you can compare them in one chart. For example, group by app_name.
LIKE works on low-cardinality fields only
LIKE and ILIKE work on fields that hold a small set of distinct values, such as env, country, error_type, browser_name, and action_name. For every other field, use = or IN. Examples are user_id, user_email, view_url, resource_url, and error_message.
The same field can differ by event type. view_name accepts LIKE on Views and requires = or IN on the other event types.
A query that uses LIKE on another field fails with this message.
LIKE is not supported on user_email; use = or INAttributes (@key) never accept LIKE. They accept =, !=, IN, and the comparison operators. Comparisons need a number.
To see which fields allow LIKE, check the catalog. The field suggestions in Basic mode offer LIKE only where it works.
Fields that hold lists
A few fields hold lists. On Sessions these are service, state, city, network_connectivity, and ip. On Views, ip is a list. On Errors, Resources, and Long Tasks, action_id is a list. For these fields, = and IN test whether the list contains the value. You can filter on them but not group by them or measure them.
Measure and group RUM data
Aggregations
Pick an aggregation as you do for Logs and Traces: count(*), unique_count, avg, sum, min, max, p50, p75, p90, p95, or p99. Count takes no field. Every other aggregation takes one field. The numeric aggregations need a number field or an attribute. unique_count accepts any field that is not a list.
Durations and units
KubeSense stores durations in nanoseconds. Each duration field has two filter-only twins: an _ms twin in milliseconds and an _s twin in seconds. For example, lcp has lcp_ms and lcp_s, and duration has duration_ms and duration_s.
- Aggregate the base field, for example
p75oflcp. The result is in nanoseconds, and the chart or table shows it as a readable duration. - Filter on the twin.
lcp_ms > 2500filters at 2.5 seconds. - The measure picker lists only base fields. Twins appear only in filters.
You cannot group by a duration, and you cannot aggregate, group by, or list a twin.
Group by
You can group by most string, boolean, and number fields. These cannot be a group-by:
- Fields that hold lists, such as
serviceon Sessions. - Durations, in any unit.
- Free-text identifiers and text, such as
session_id,view_id,view_url, anderror_message.
Group by a low-cardinality field instead, such as view_name, browser_name, or country.
Feature flags are the one case that depends on the event type. You can filter on feature_flag.<key> on every event type. You can group by or measure a flag only on Views and Errors, because the other event types store the flag per session. For them, filter on the flag instead.
You can group by a custom attribute. Type the key with an @ prefix.
Switch the event type
To change the event type of a query, open the data source menu and pick another one, for example RUM › Errors. The query keeps what still applies to the new event type.
- Aggregation, group-by, and sort fields that the new event type does not have are dropped. If the aggregation is dropped, it returns to
count(*). - The filter stays only if every field in it exists on the new event type. Otherwise it is cleared.
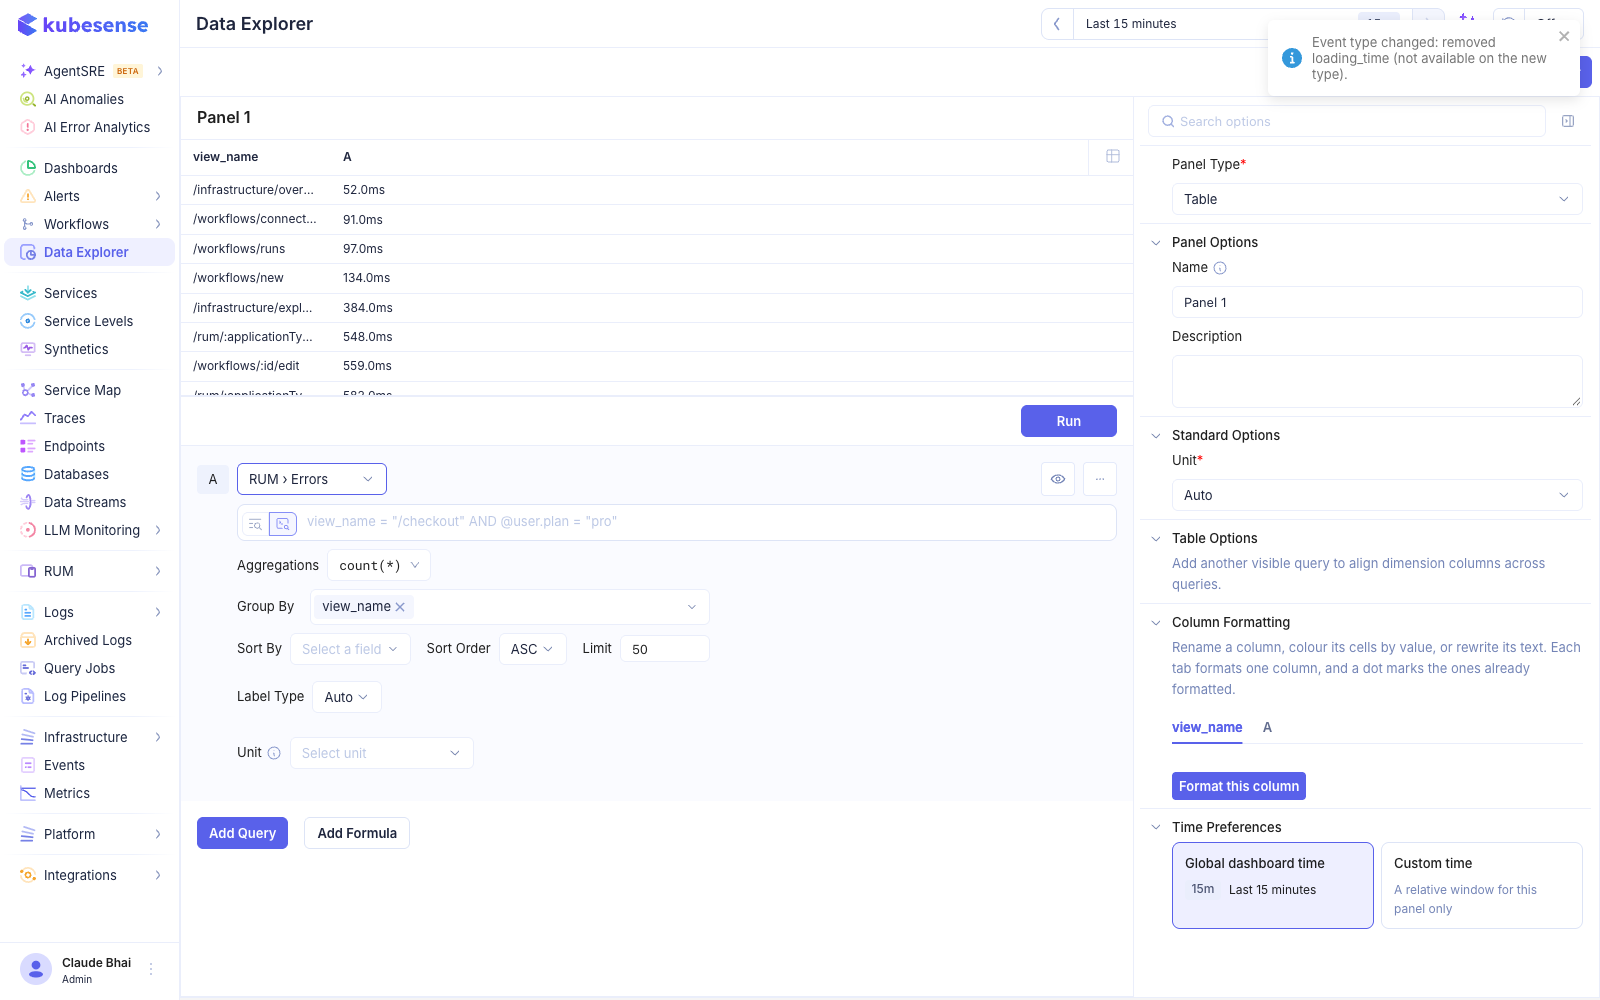
A message lists what was dropped. Switching to a data source other than RUM resets the query.
List panel
A List panel shows individual RUM rows instead of aggregates. Use it to read the sessions that crashed, the slowest requests, or the text of an error. To pick it, select a RUM event type, then choose List as the panel type.
Each event type has default columns. You can change them in the panel.
| Event type | Default columns |
|---|---|
| Sessions | Start time, session type, time spent, view count, error count, action count, frustration count, first view, last view |
| Views | Start time, view name, frustration count, loading type, loading time, view time spent, country, browser |
| Actions | Start time, action type, action name, frustration type, view name |
| Errors | Start time, view name, error source, error message |
| Resources | Start time, view name, resource URL, duration, response size, status code, resource type |
| Long Tasks | Start time, duration, view name |
Click a row to open its RUM drawer in place, without leaving the panel. On Sessions and Views rows that have a recording, a replay button opens the session replay.
Paging and limits
-
The list loads 50 rows per page and pages by page number. The API allows up to 200 rows per page.
-
Rows are sorted by start time, newest first. You can page through the whole window, and a sort by another column pages the same way. There is no depth limit.
-
The list does not show a total row count.
-
A time range older than the raw data window is shortened to the window, and the panel says so. The window also widens to the bucket boundaries the RUM data is stored in. See Data window.
-
Every row always includes the columns the panel needs to open it, whatever columns you pick.
Event type Always-present columns Sessions application_id,session_id,session_start,session_has_replayViews application_id,session_id,view_id,view_start,session_has_replayActions application_id,session_id,view_id,action_id,action_start,session_has_replayErrors application_id,session_id,view_id,error_id,error_start,is_crash,session_has_replayResources application_id,session_id,view_id,resource_id,resource_start,session_has_replayLong Tasks application_id,session_id,view_id,task_id,task_start,session_has_replay -
These fields hold raw payloads and cannot be a column or a sort:
error_stack,handling_stack,threads,graphql,display, andtags. -
Rows match the tables on the RUM pages. Sessions and Views are deduplicated. Views that are still open are listed.
-
Actions, Errors, Resources, and Long Tasks are grouped by id, so each id is one row. The start time is the first occurrence. Resource durations are medians. Long task durations are averages.
-
Errors lists captured errors only.
-
The List panel reads through the RUM list APIs,
POST /rum/explorer/{sessions,views,actions,errors,resources,longtasks}. These need the RUM permission.
Data window
RUM queries read raw RUM data. By default, KubeSense keeps raw data for 7 days for actions, errors, resources, and long tasks, and for 30 days for sessions and views. Your deployment can change this.
A long time range therefore covers less than the RUM pages show for the same range, because those pages also read pre-aggregated data. For a range longer than the retention, use the RUM pages.
Limits
- RUM supports charts, tables, and List panels.
- The explorer does not show the generated SQL for RUM queries.
- Value suggestions come from the panel's time window and ignore your other filters. Only fields that allow
LIKEget suggestions as you type a prefix. - RUM is not a data source for alert rules.
- The explorer does not suggest attribute keys. Type the
@keyyourself. A key that does not exist matches no rows and returns no error. - A field that only one platform sends, such as
lcpon browser orbattery_levelon mobile, matches nothing for the other platform, and no error appears.
Related
- RUM for the dashboard and Sessions Explorer.
- Dashboard variables to add a RUM variable (event type and field) that filters RUM panels on a dashboard.
- MCP Server to query RUM from an AI assistant, including
search-rumfor the same rows as the List panel.